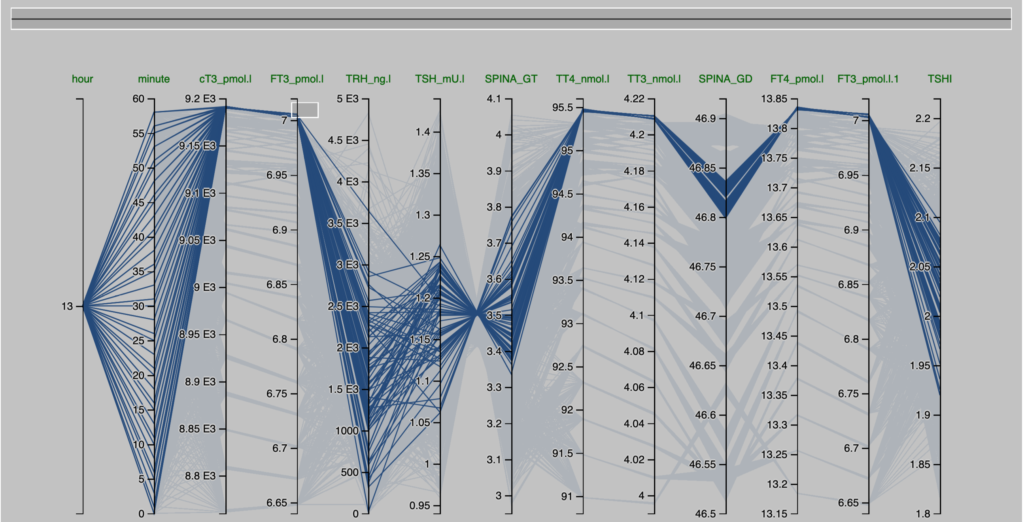
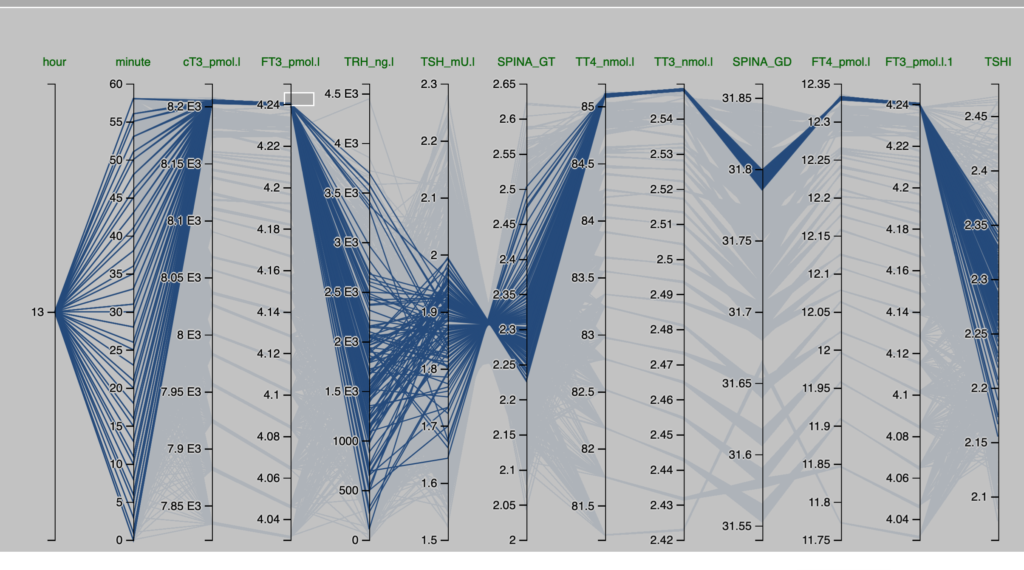
Observations from the Pilo scenarios
The figures are derived from Simthyr – based on the laboratory values for the persons in the Pilo study(1). The figures mimic what may be seen in humans with this condition.
| Pilo 1 (showing slight hyperdeiodination and high conversion rate) | Pilo 10 (with normal values for SPINA-GT and SPINA-GD) |
| These are the figures entered into SimThyr, as can be seen, these values are changed: GH, LS, SS, GT, GD1 | These are the figures entered into SimThyr, as can be seen, these values are changed: LS, GT, GD1 |
| alphaR = 0.4 betaR = 0.0023105 GR = 1 dR = 1E-10 alphaS = 0.4 betaS = 0.00023 alphaS2 = 260000 betaS2 = 140 GH = 450 dH = 4.7E-8 LS = 3600000 SS = 130 DS = 50 alphaT = 0.1 betaT = 1.1E-6 GT = 3.25E-12 dT = 2.75 alpha31 = 0.026 beta31 = 8E-6 GD1 = 4.698E-8 KM1 = 5E-7 alpha32 = 130000 beta32 = 0.00083 GD2 = 4.3E-15 KM2 = 1E-9 K30 = 2000000000 K31 = 2000000000 K41 = 20000000000 K42 = 200000000 Tau0R = 1800 Tau0S = 120 Tau0S2 = 3240 Tau0T = 300 Tau03z = 3600 | alphaR = 0.4 betaR = 0.0023105 GR = 1 dR = 1E-10 alphaS = 0.4 betaS = 0.00023 alphaS2 = 260000 betaS2 = 140 GH = 471.85 dH = 4.7E-8 LS = 2500000 (std:1.6879E6) SS = 100 DS = 50 alphaT = 0.1 betaT = 1.1E-6 GT = 2.22E-12 (std:3.375-12) dT = 2.75 alpha31 = 0.026 beta31 = 8E-6 GD1 = 3.188E-8 (std: 2.8E-8) KM1 = 5E-7 alpha32 = 130000 beta32 = 0.00083 GD2 = 4.3E-15 KM2 = 1E-9 K30 = 2000000000 K31 = 2000000000 K41 = 20000000000 K42 = 200000000 Tau0R = 1800 Tau0S = 120 Tau0S2 = 3240 Tau0T = 300 Tau03z = 3600 |
| Header | Pilo 1 |
| x | FT3_pmol.l |
| y | TSHI |
| result_type | predictive power score |
| pps | 0.0399161481951055 |
| metric | MAE |
| baseline_score | 0.228599683756024 |
| model_score | 0.219471509560077 |
| cv_folds | 5 |
| seed | 1 |
| algorithm | tree |
| model_type | regression |
| Header | Pilo 10 |
| x | FT3_pmol.l |
| y | TSHI |
| result_type | predictive power score |
| pps | 0.074013572098316 |
| metric | MAE |
| baseline_score | 0.229021692772779 |
| model_score | 0.212073708605622 |
| cv_folds | 5 |
| seed | 1 |
| algorithm | tree |
| model_type | regression |
| TRH_ng.l | FT3_pmol.l |
| pps | 0.00999382 |
| TRH_ng.l | TSH_mU.l | |
| pps | 0.241326 |
| SPINA_GT | TSH_mU.l | |
| pps | 0.820709 |
| SPINA_GT | TT4_nmol.l | |
| pps | 3.4861e-15 |
| TT3_nmol.l | TT4_nmol.l | |
| pps | 0.734311 |
| TT3_nmol.l | FT4_pmol.l | |
| pps | 0.7343158 |
| SPINA_GD | FT4_pmol.l | |
| pps | 0.2388143 |
| SPINA_GD | FT3_pmol.l | |
| pps | 0.1478555 |
| TSHI | FT3_pmol.l | |
| pps | 0.03991615 |
| FT3_pmol.l | TRH_ng.l | |
| pps | 0.02436586 |
| TRH_ng.l | TSH_mU.l | |
| pps | 0.2460819 |
| SPINA_GT | TSH_mU.l | |
| pps | 0.8224402 |
| SPINA_GT | TT4_nmol.l | |
| pps | 7.704948e-15 |
| TT3_nmol.l | TT4_nmol.l | |
| pps | 0.7880723 |
| TT3_nmol.l | FT4_pmol.l | |
| pps | 0.7880051 |
| SPINA_GD | FT4_pmol.l | |
| pps | 0.3212973 |
| SPINA_GD | FT3_pmol.l | |
| pps | 0.1749449 |
| TSHI | FT3_pmol.l | |
| pps | 0.07401357 |
- 1. Pilo A, Iervasi G, Vitek F, Ferdeghini M, Cazzuola F, Bianchi R. Thyroidal and peripheral production of 3,5,3′-triiodothyronine in humans by multicompartmental analysis. Am J Physiol. 1990 Apr;258(4 Pt 1):E715-26. PubMed PMID: 2333963.

