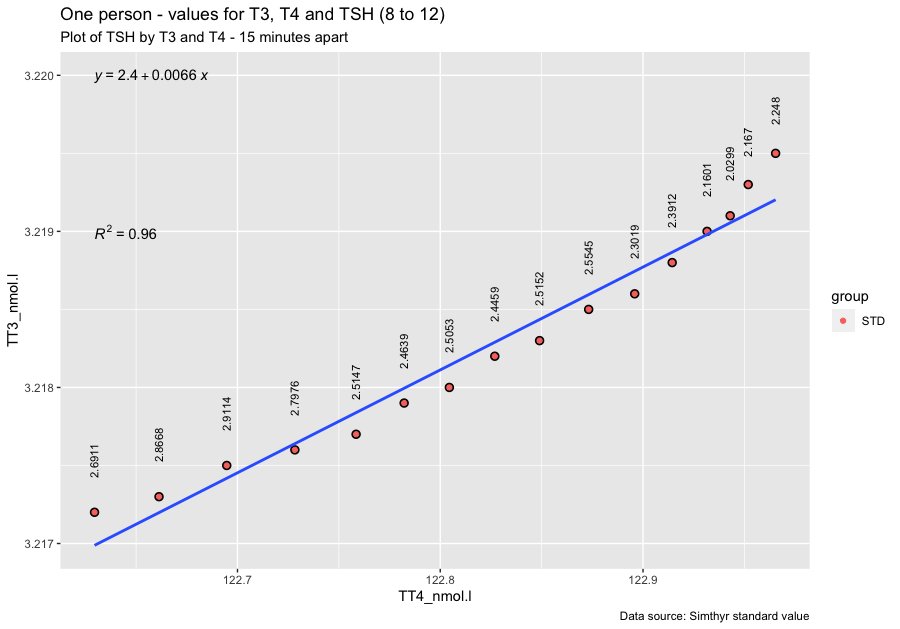
Stig Andersen et al. (1.) 2002 has a table with figures for TSH, TT3, and TT4. With Simthyr I have generated 16 values in intervals of 15 minutes from 8 to 12 o’clock. Of notice is the values for the 16 men and the simulated person from SimThyr the levels in the study are lower than that of the simulated person.
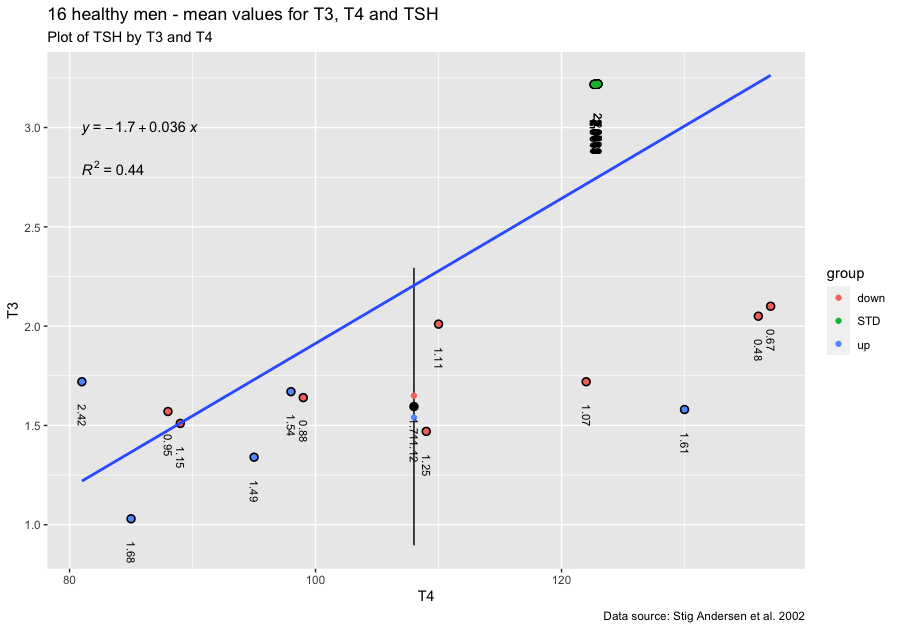
Notice the difference in mean T3 and TSH values between the 16 healthy men (down and up) and the simulated person from SimThyr (STD). The 16 figures from SimThyr are hard to read I have extracted the figures here:
None of these 16 pairs of values are alike. They change slightly over the period of time where most people are having drawn their laboratory tests.
The interactive graph below (opens slowly in a new window) shows the same picture. It is possible easily to identify how different the values are for each individual visualizing the index of individuality. Let the curser hit the dots and view the different patterns.
https://www.glensbo.dk/Files/sa1.html
References:
- Stig Andersen, Klaus Michael Pedersen, Niels Henrik Bruun, Peter Laurberg, Narrow Individual Variations in Serum T4 and T3 in Normal Subjects: A Clue to the Understanding of Subclinical Thyroid Disease, The Journal of Clinical Endocrinology & Metabolism, Volume 87, Issue 3, 1 March 2002, Pages 1068–1072, https://doi.org/10.1210/jcem.87.3.8165
- Simthyr – or here on these pages