Values from three simulations from SimThyr evaluated with ggmulti - High-Dimensional Visualizations.
Paterns and explanations.
SimThyr is a simulation program for the pituitary thyroid feedback control that is based on a parametrically isomorphic model of the overall system that aims in a better insight into the dynamics of thyrotropic feedback. Applications of this program cover research, including development of hypotheses, and education of students in biology and medicine, nurses and patients.
https://sourceforge.net/p/simthyr/home/SimThyr/
You may find different scenarios build for SimThyr here: https://sourceforge.net/projects/simthyr/files/Scenarios/ The two files presented below are taken from these scenarios.
Below you find plots for three hours and later data for a day.
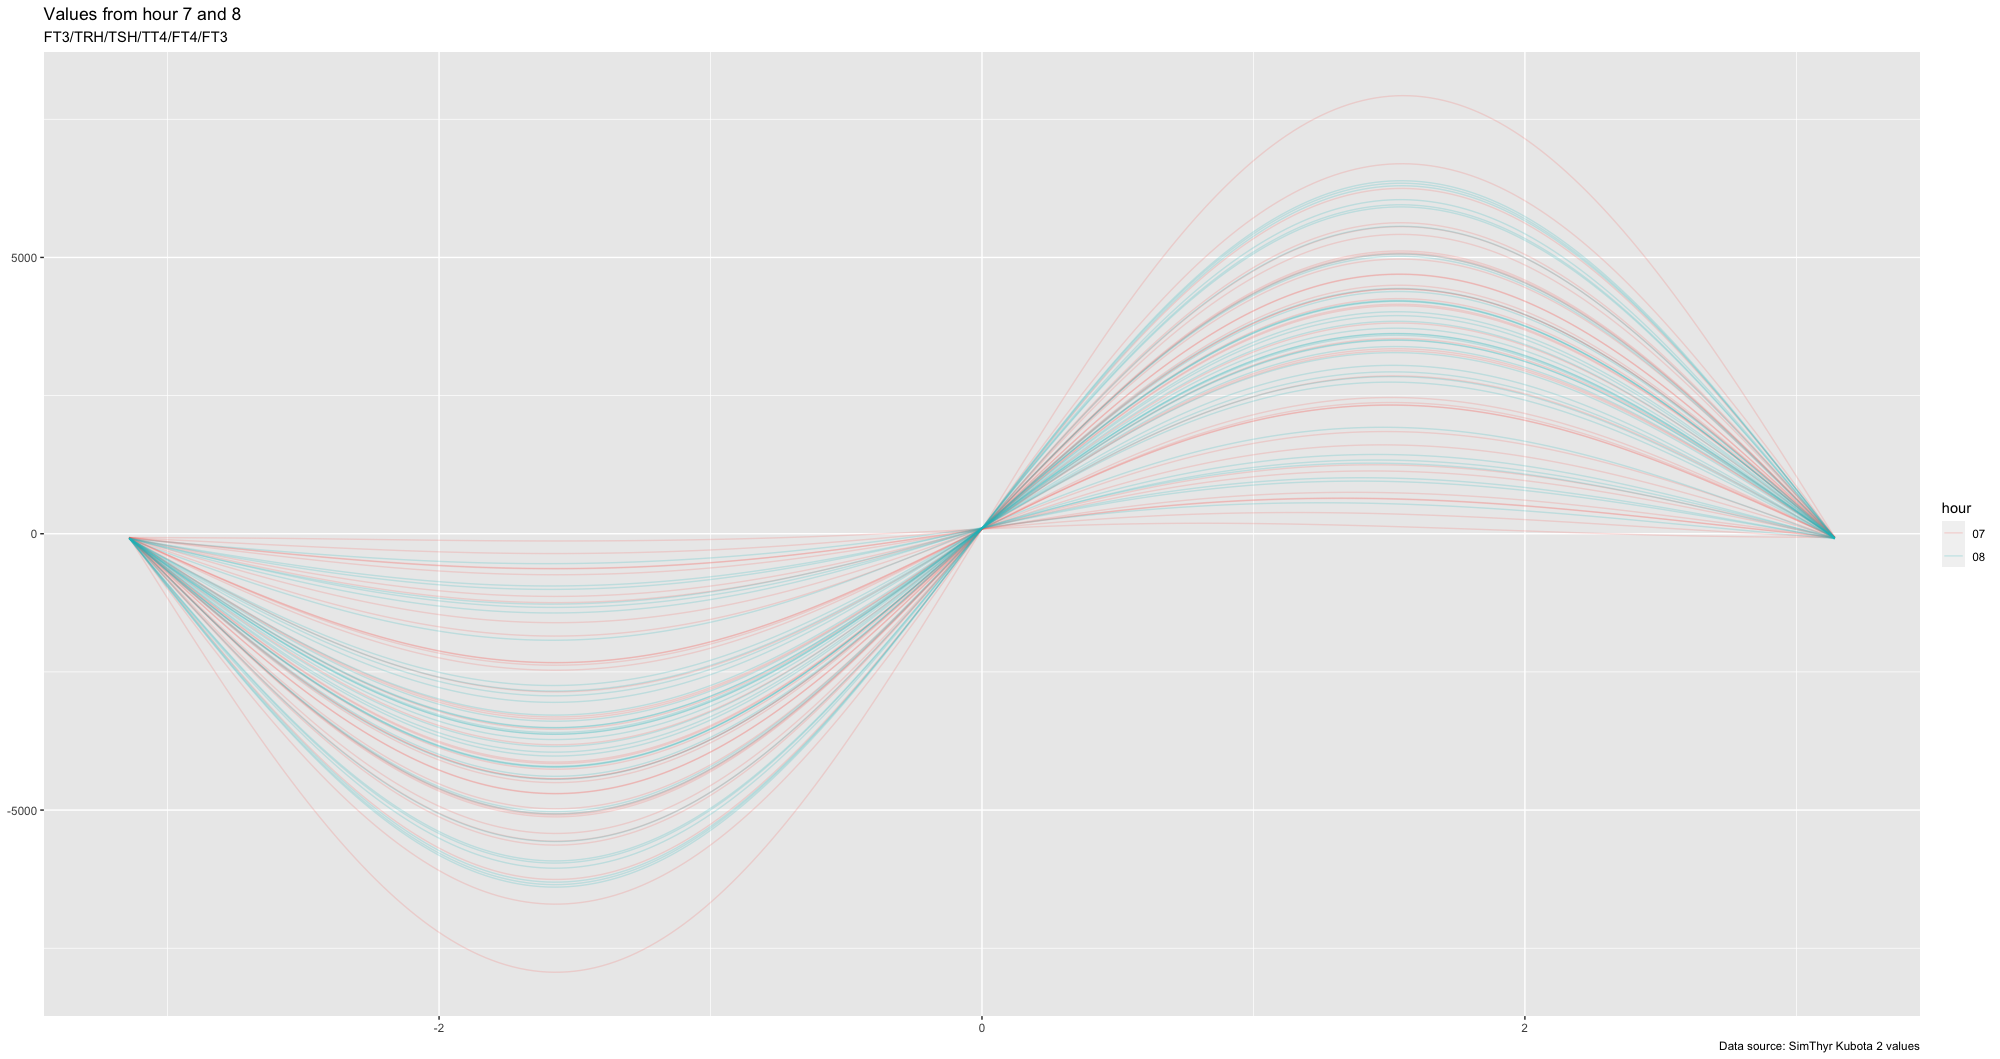
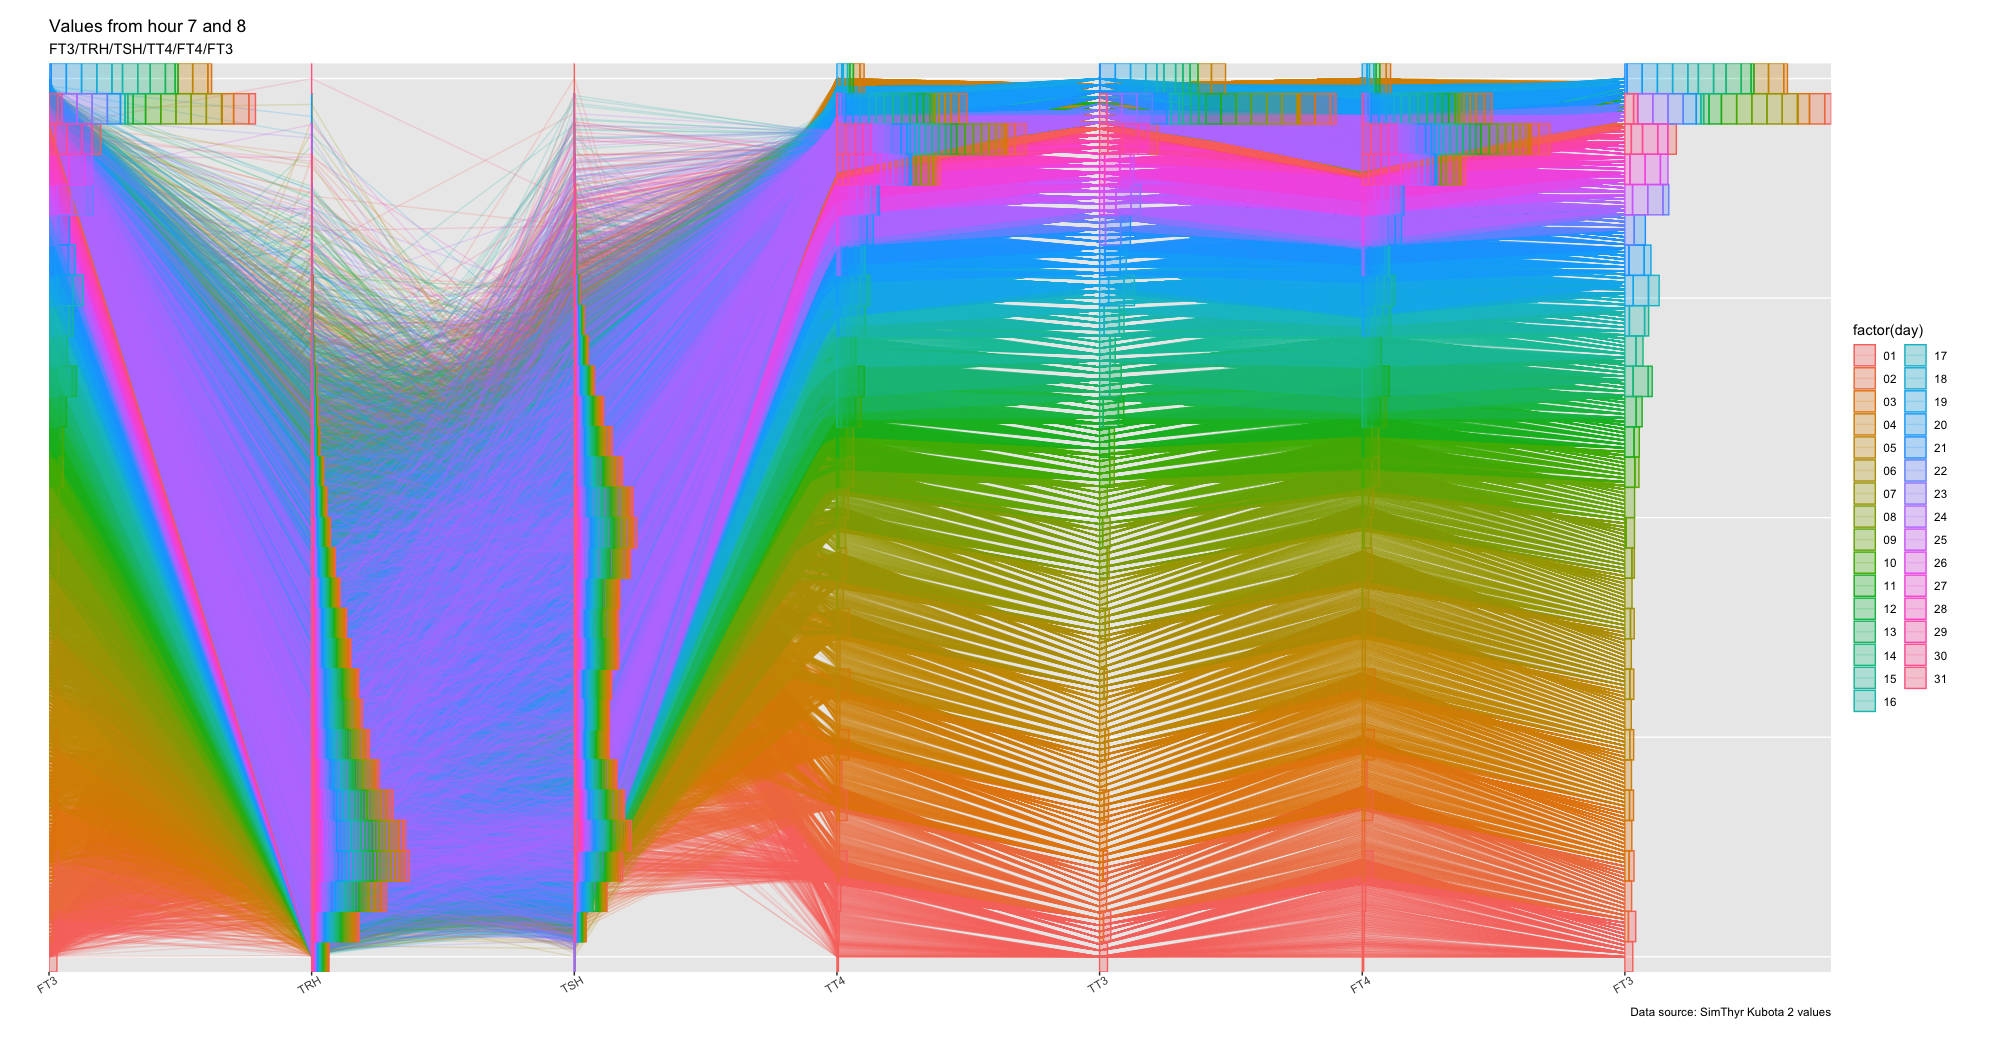
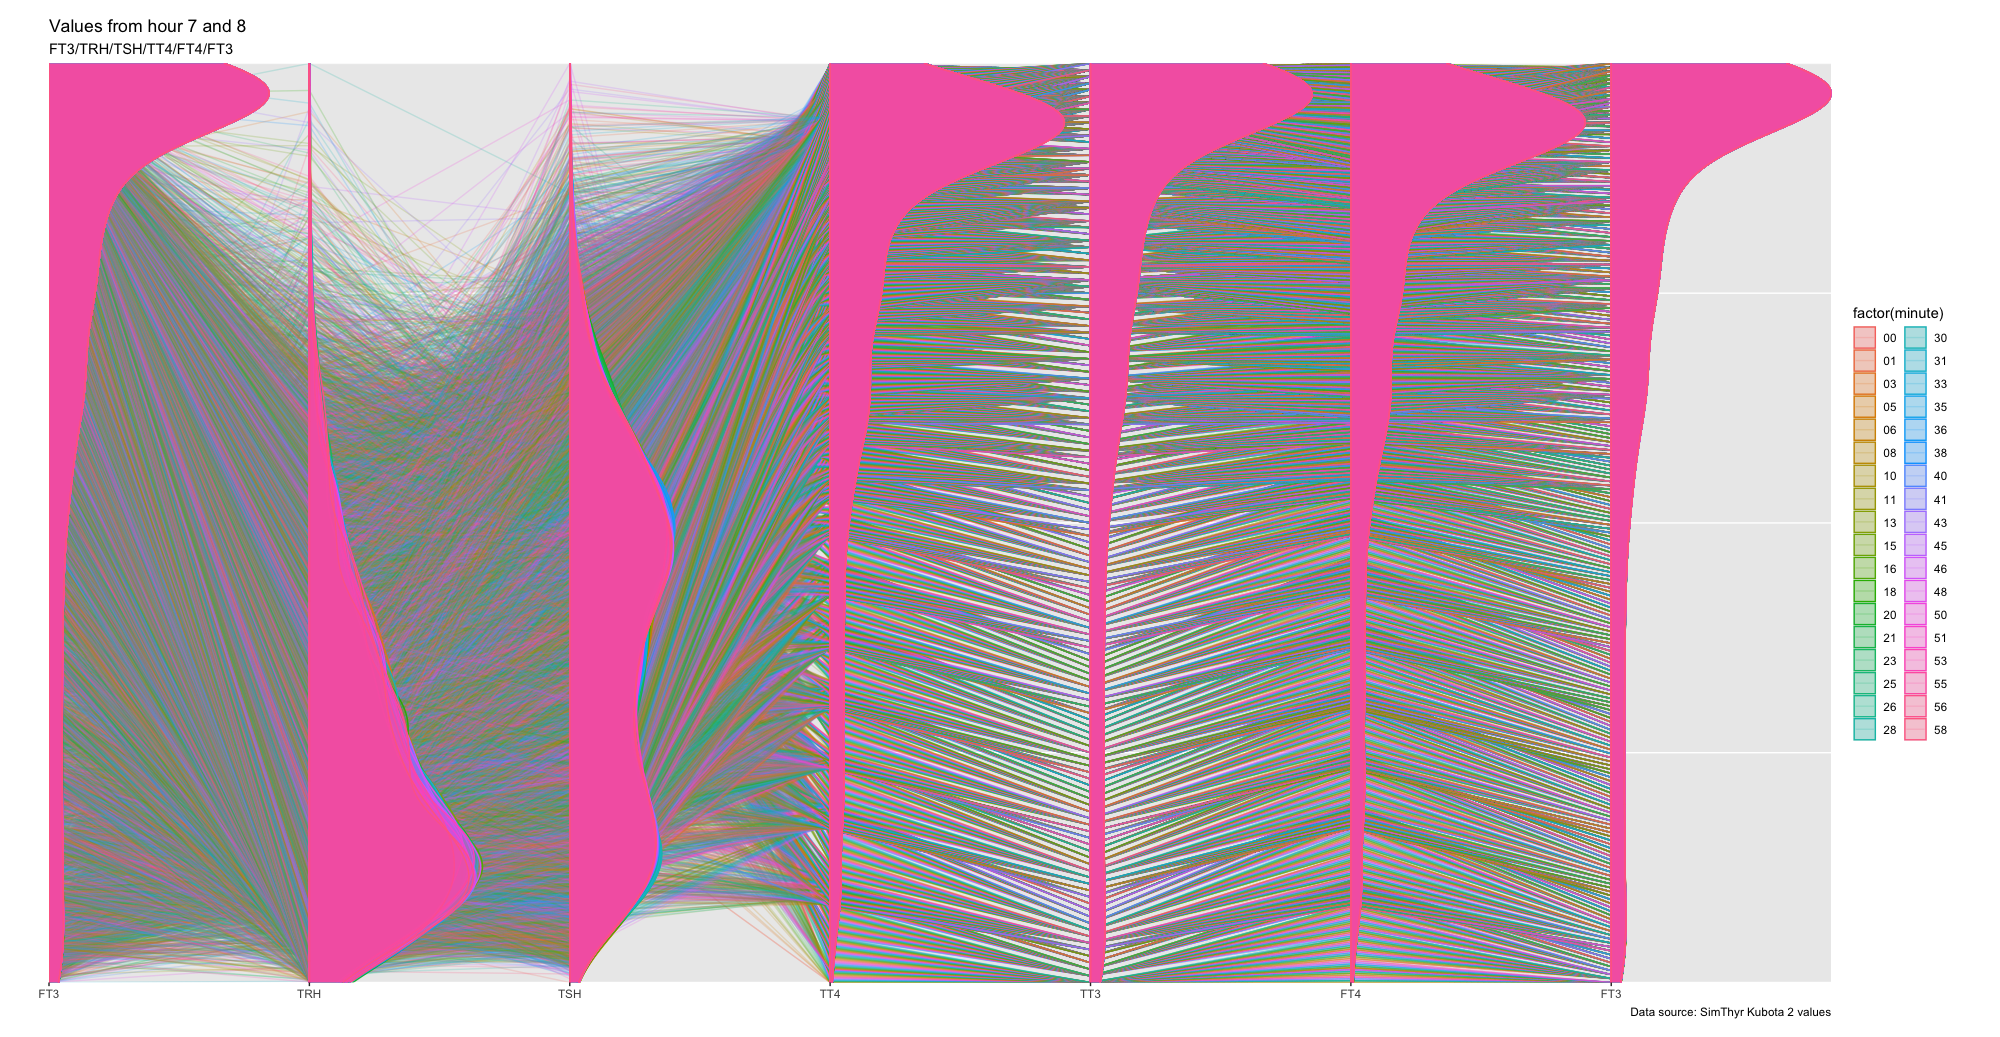
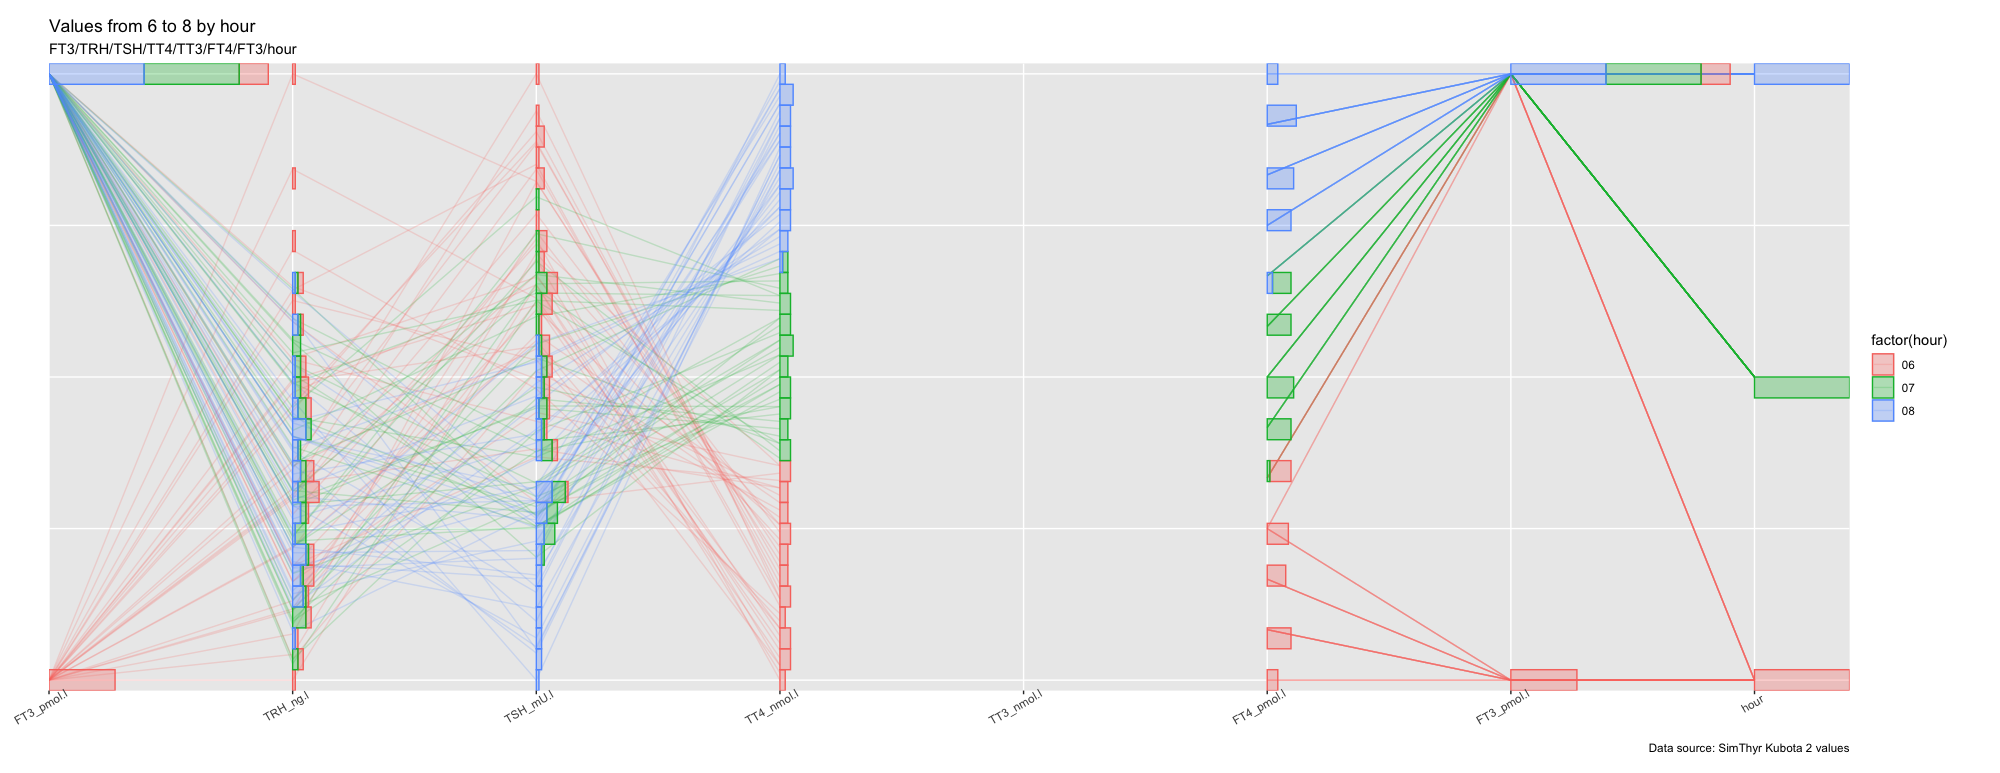
Kubota 2 (Case No. 2 from Kubota et al. showing overt hypothyroidism)
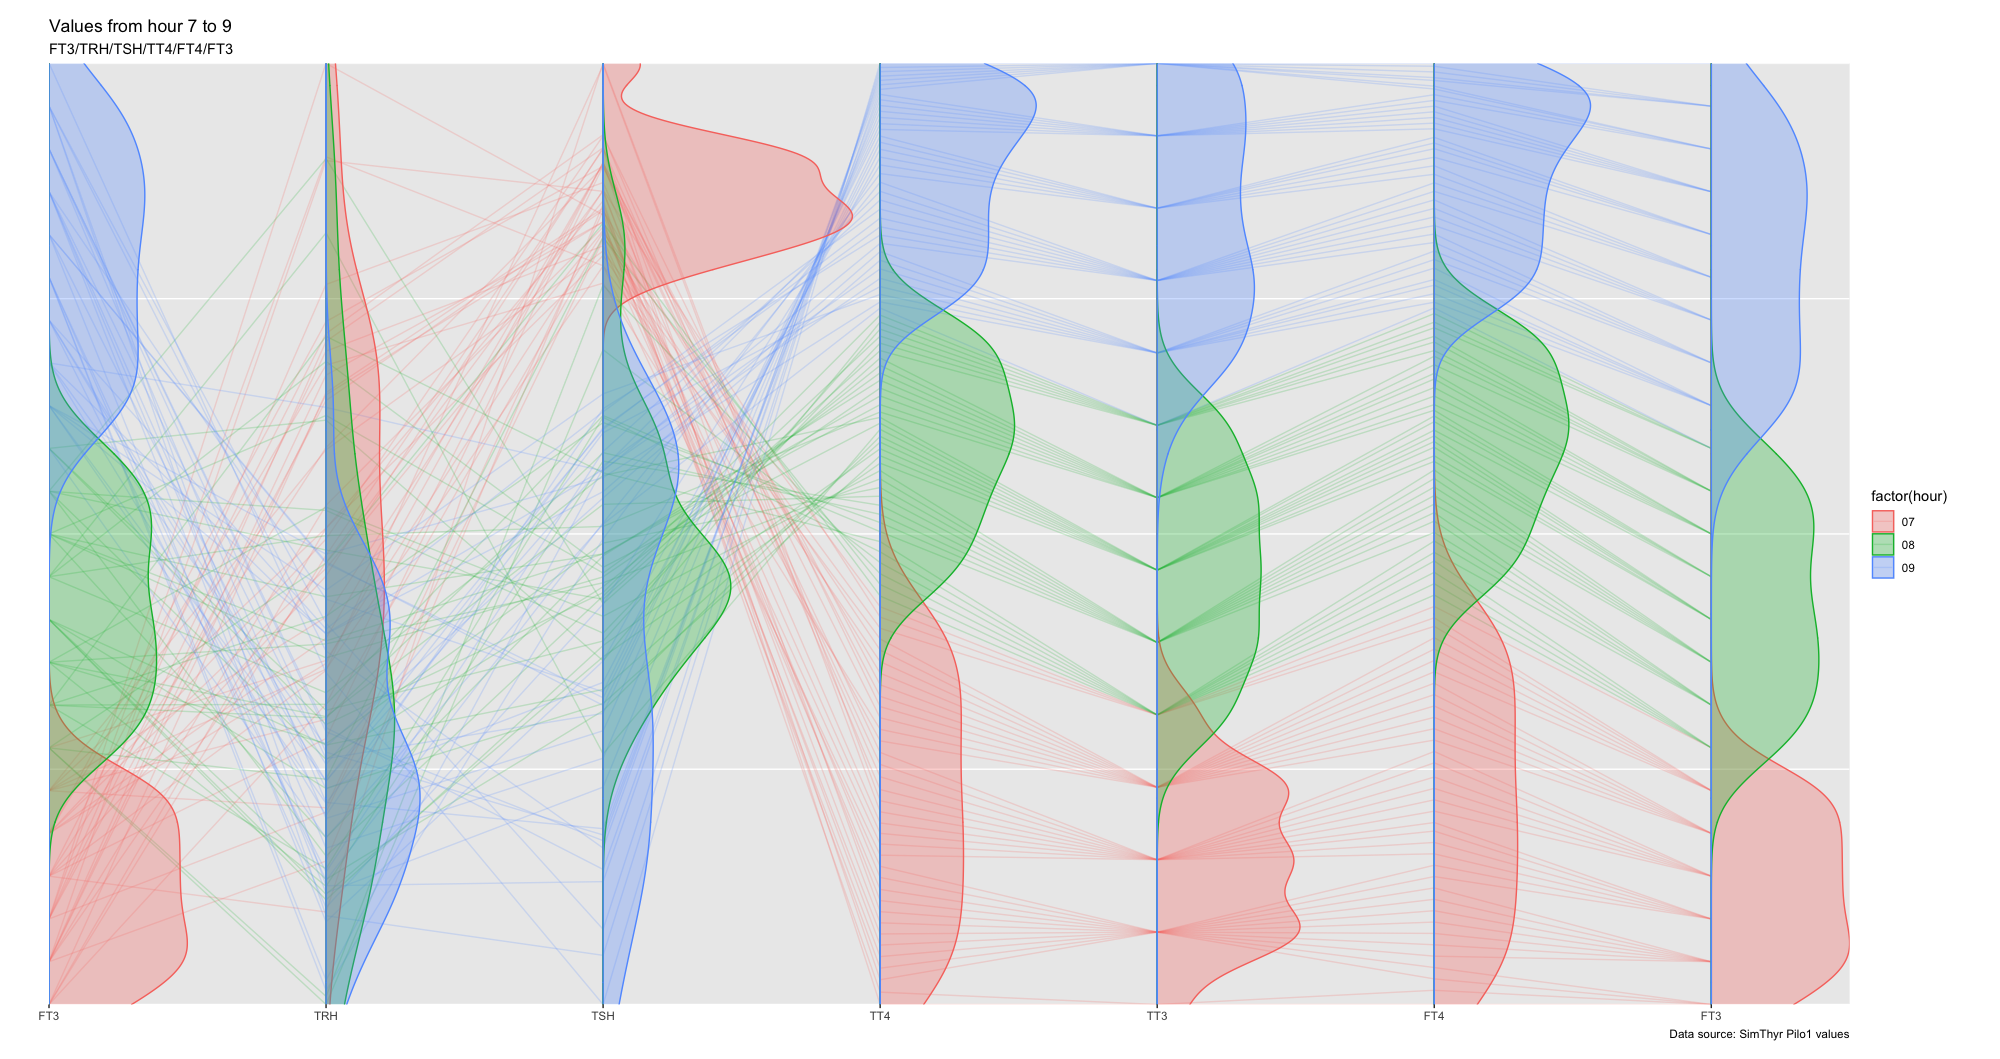
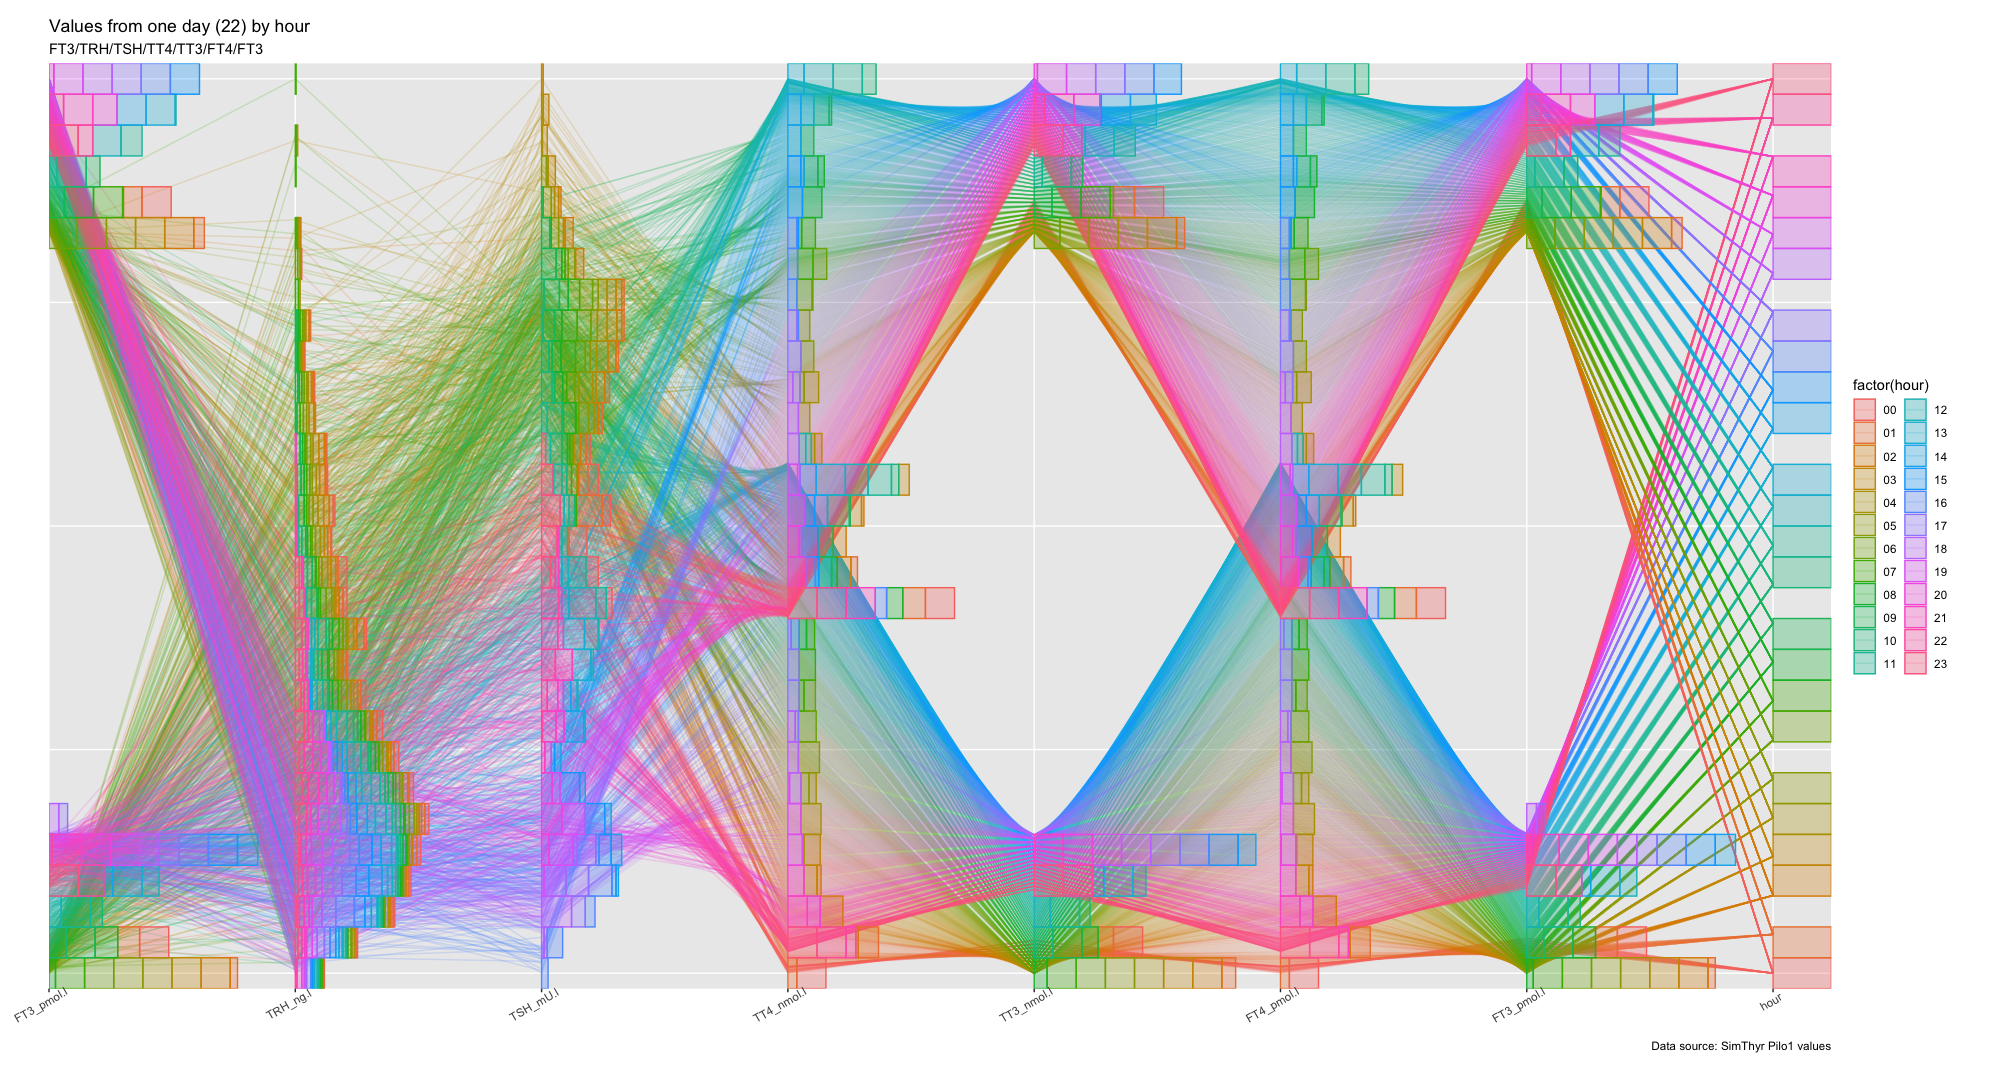
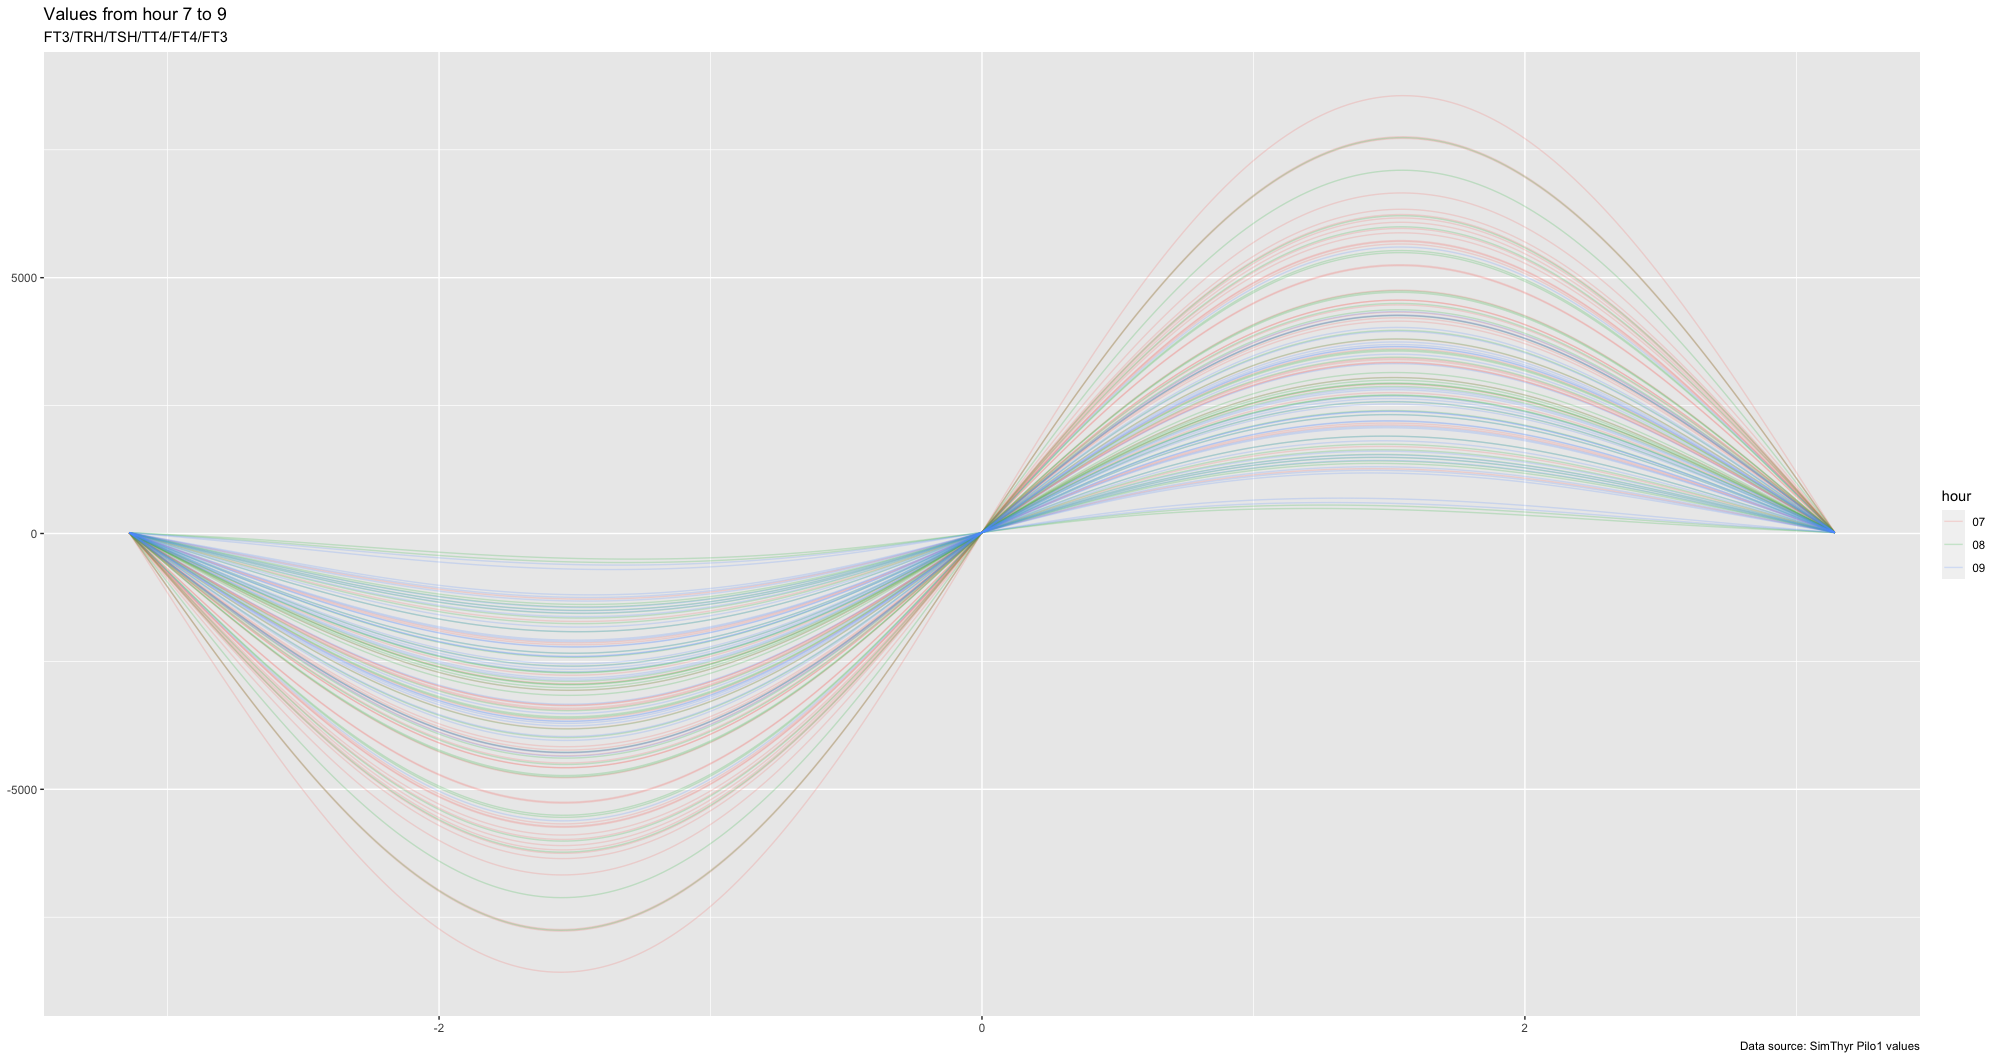
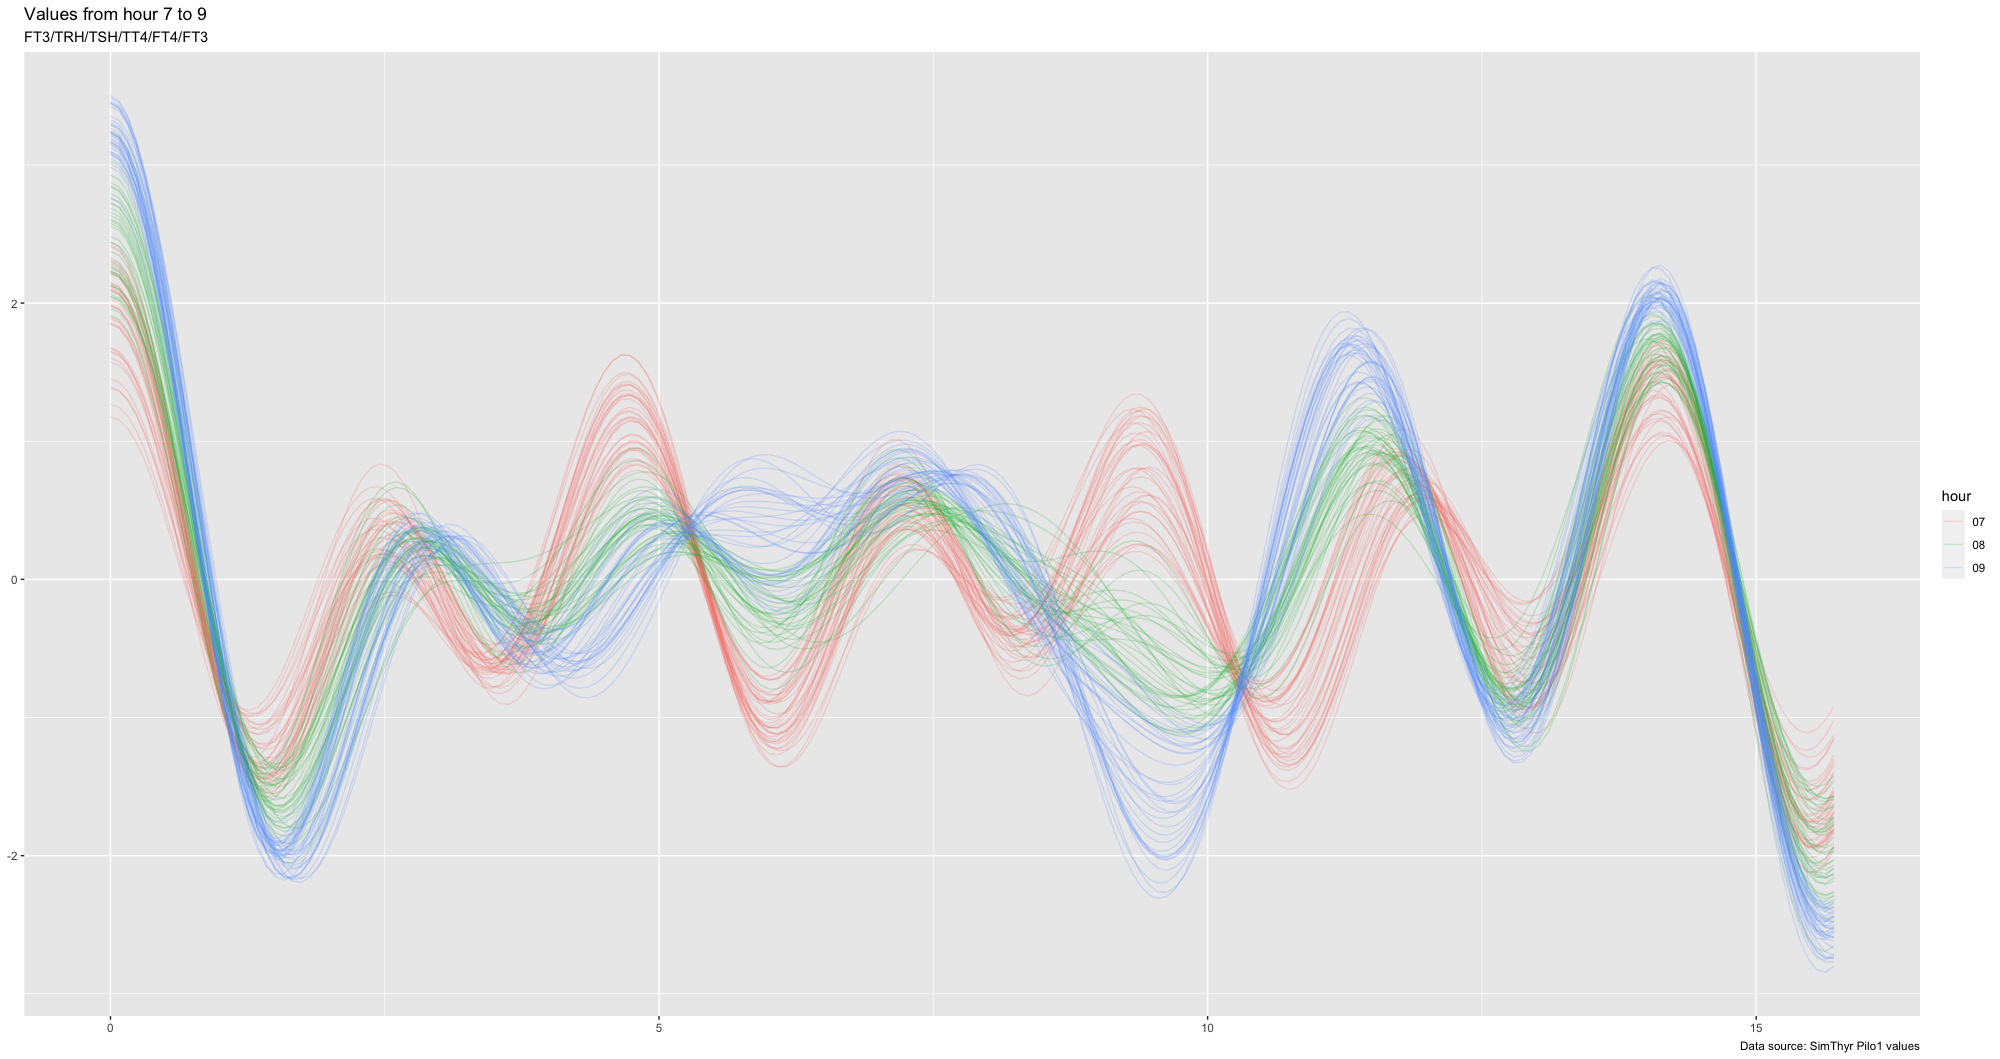
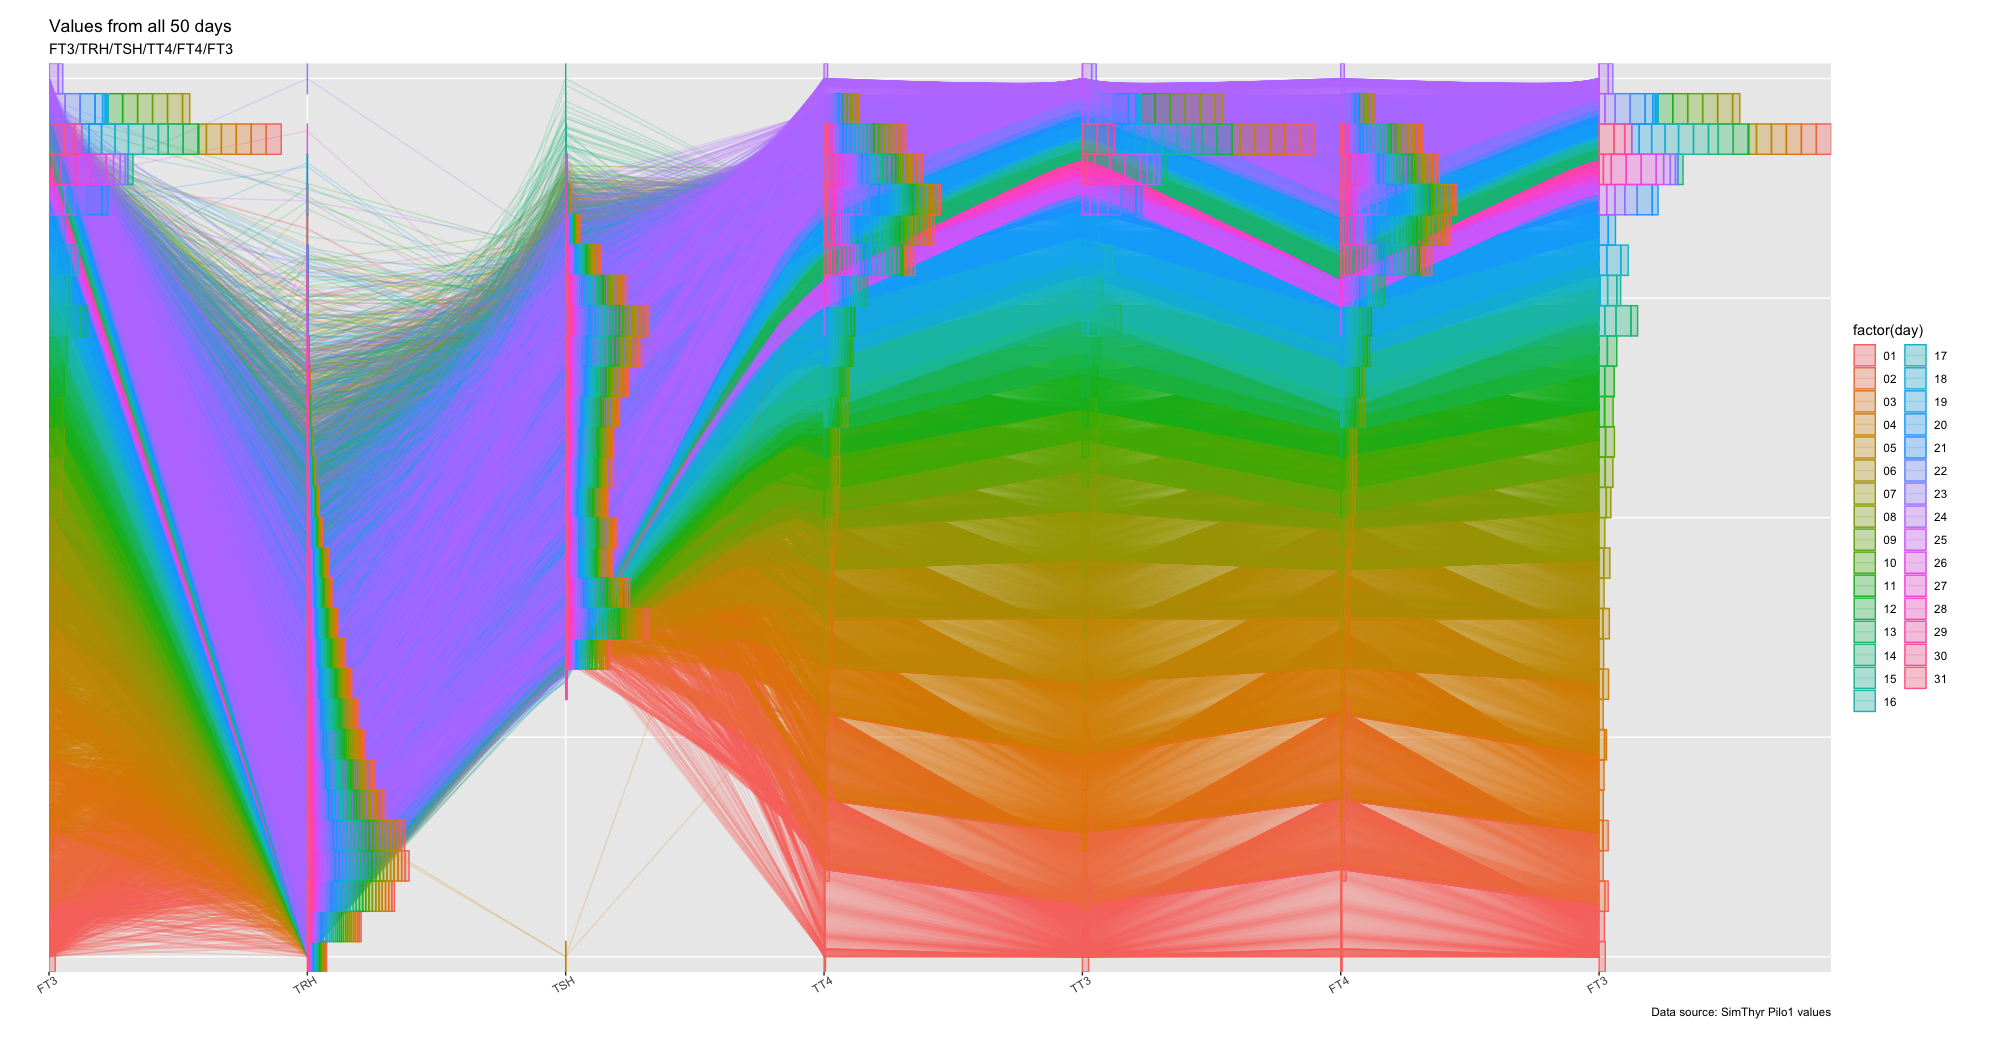
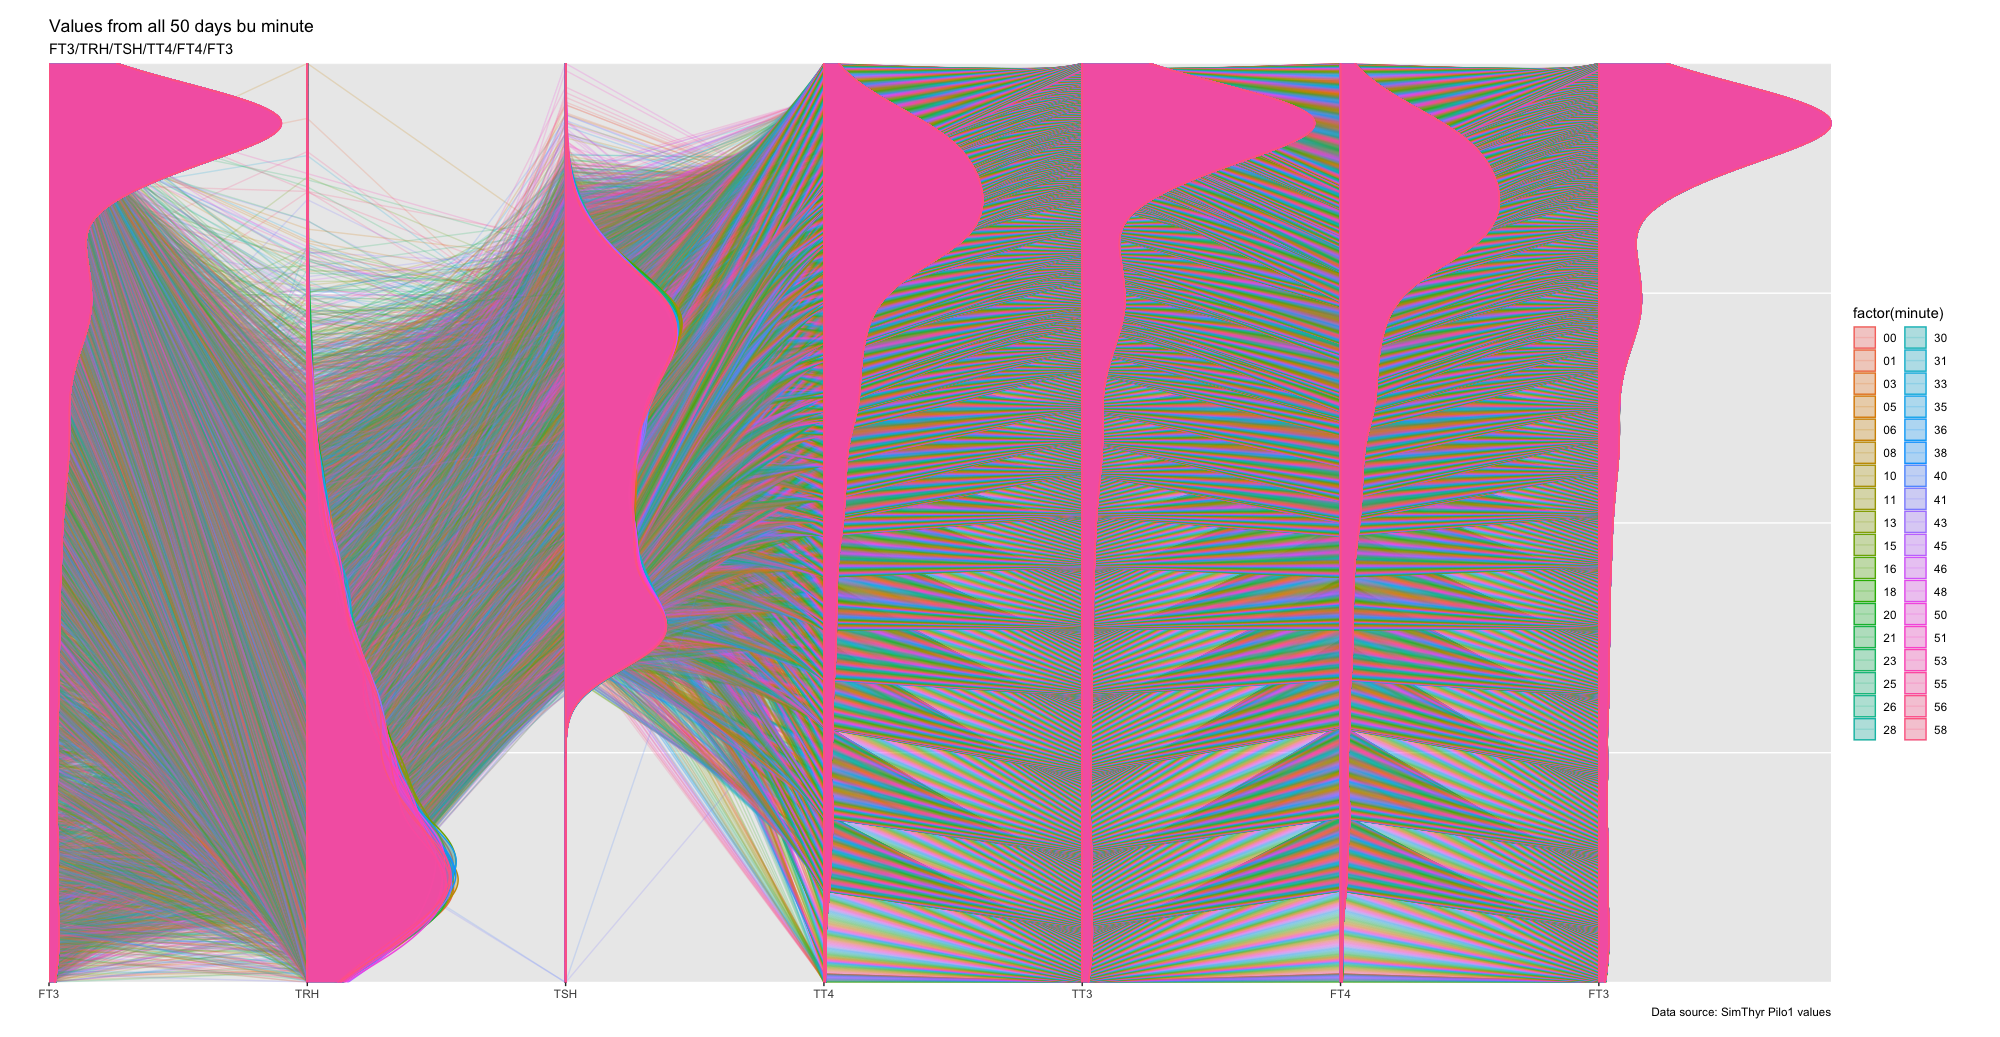
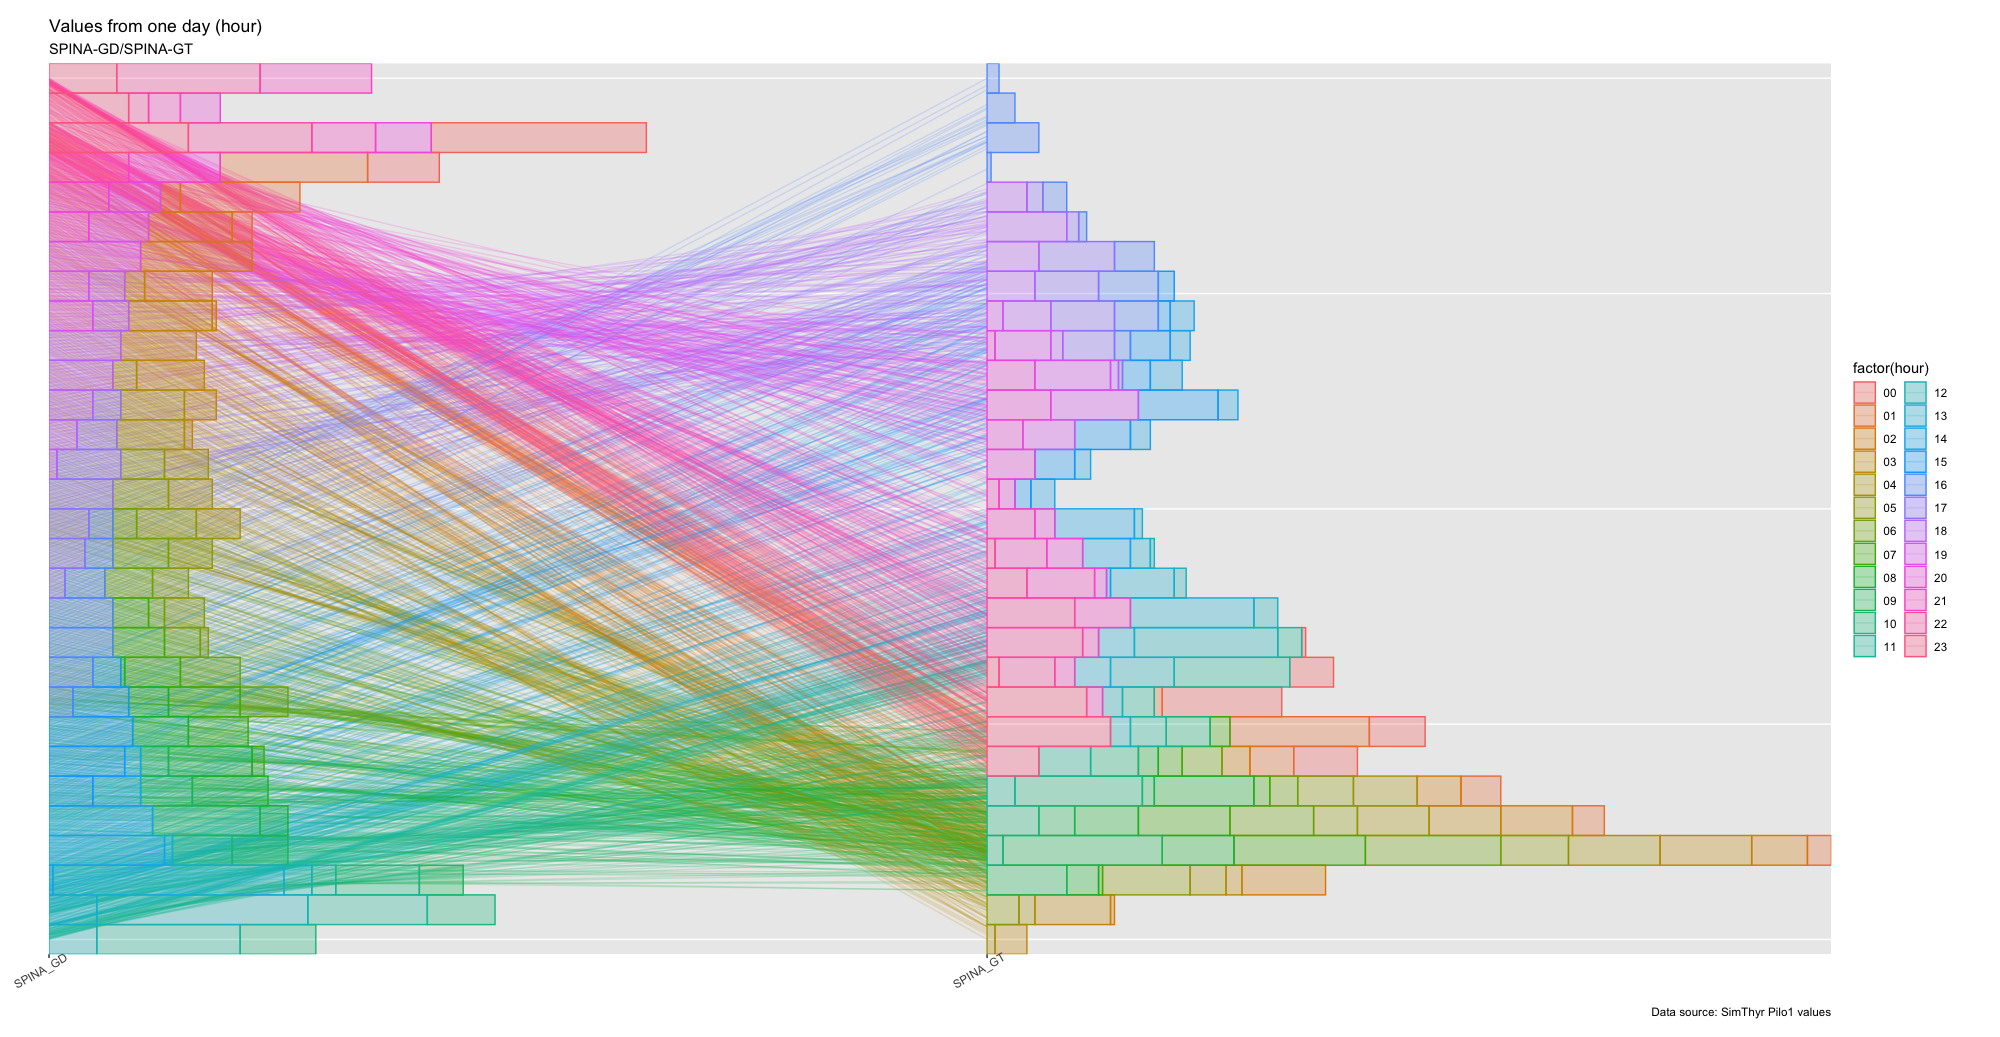
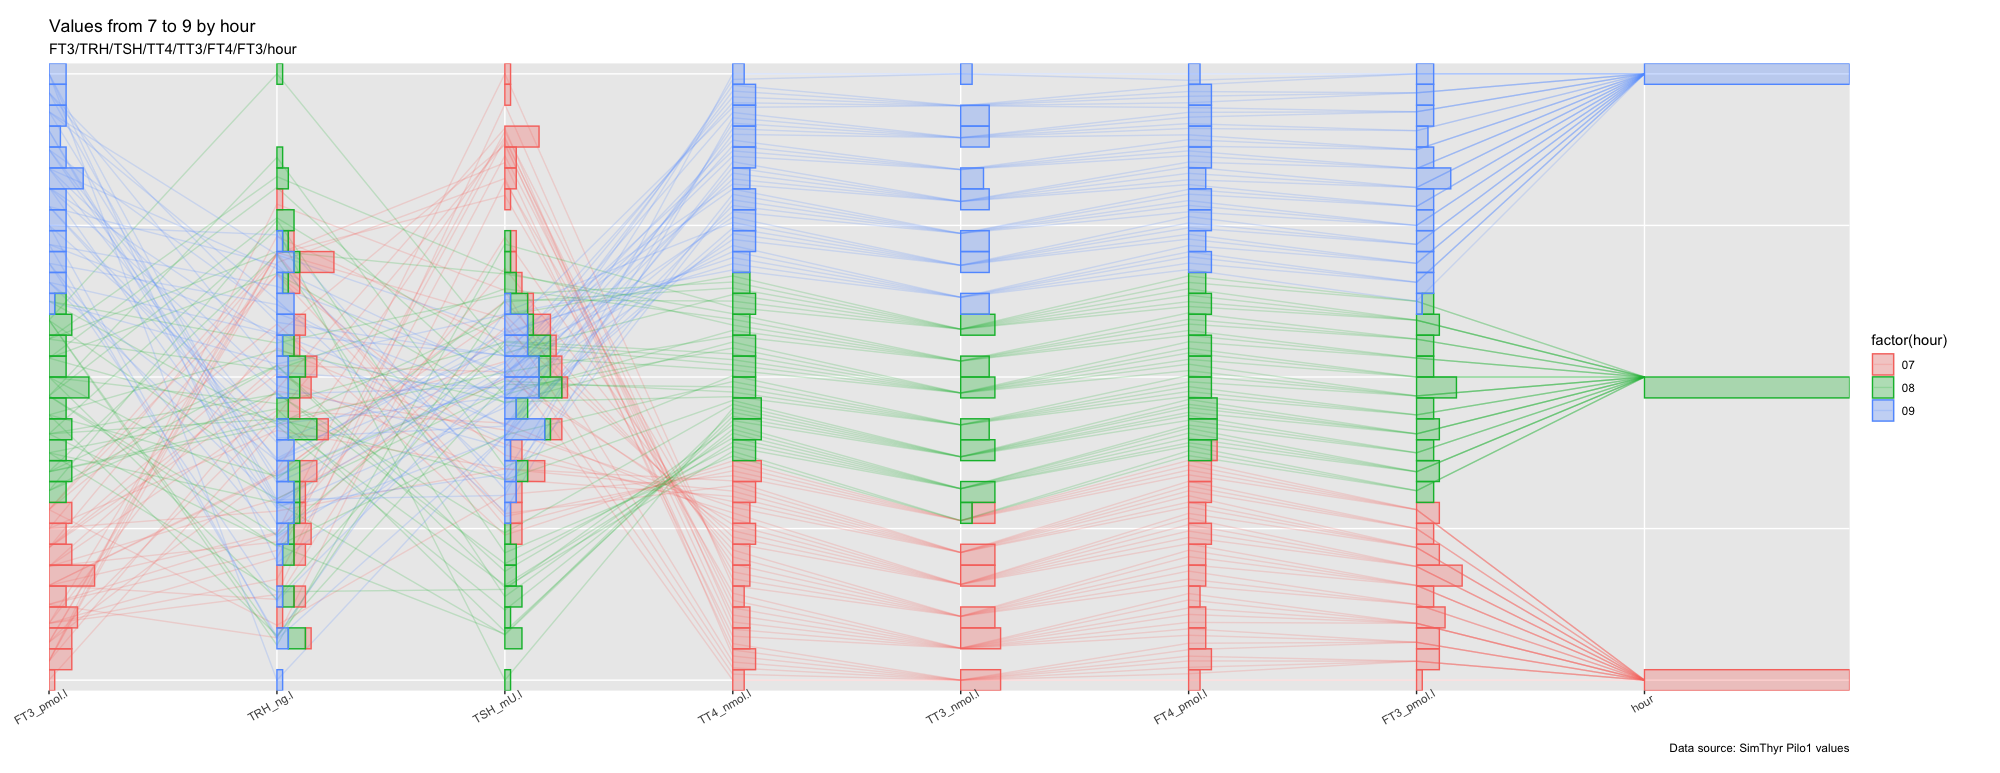
Pilo 1 (Case No. 1 from Pilo et al. showing slight hyperdeiodination and high conversion rate)
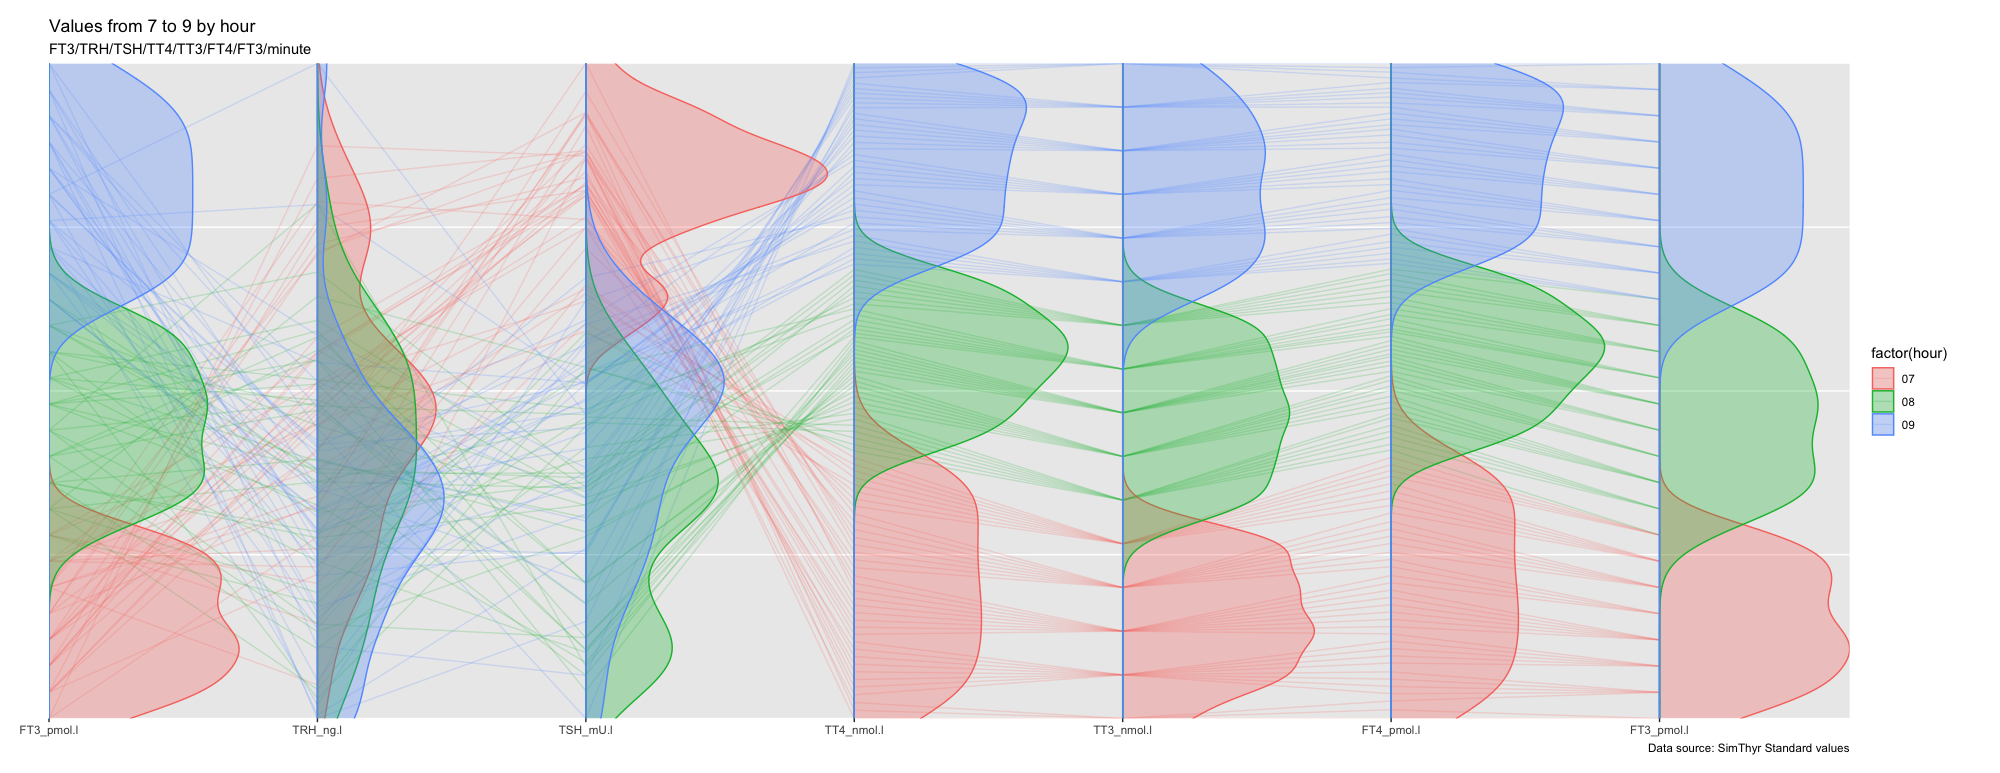
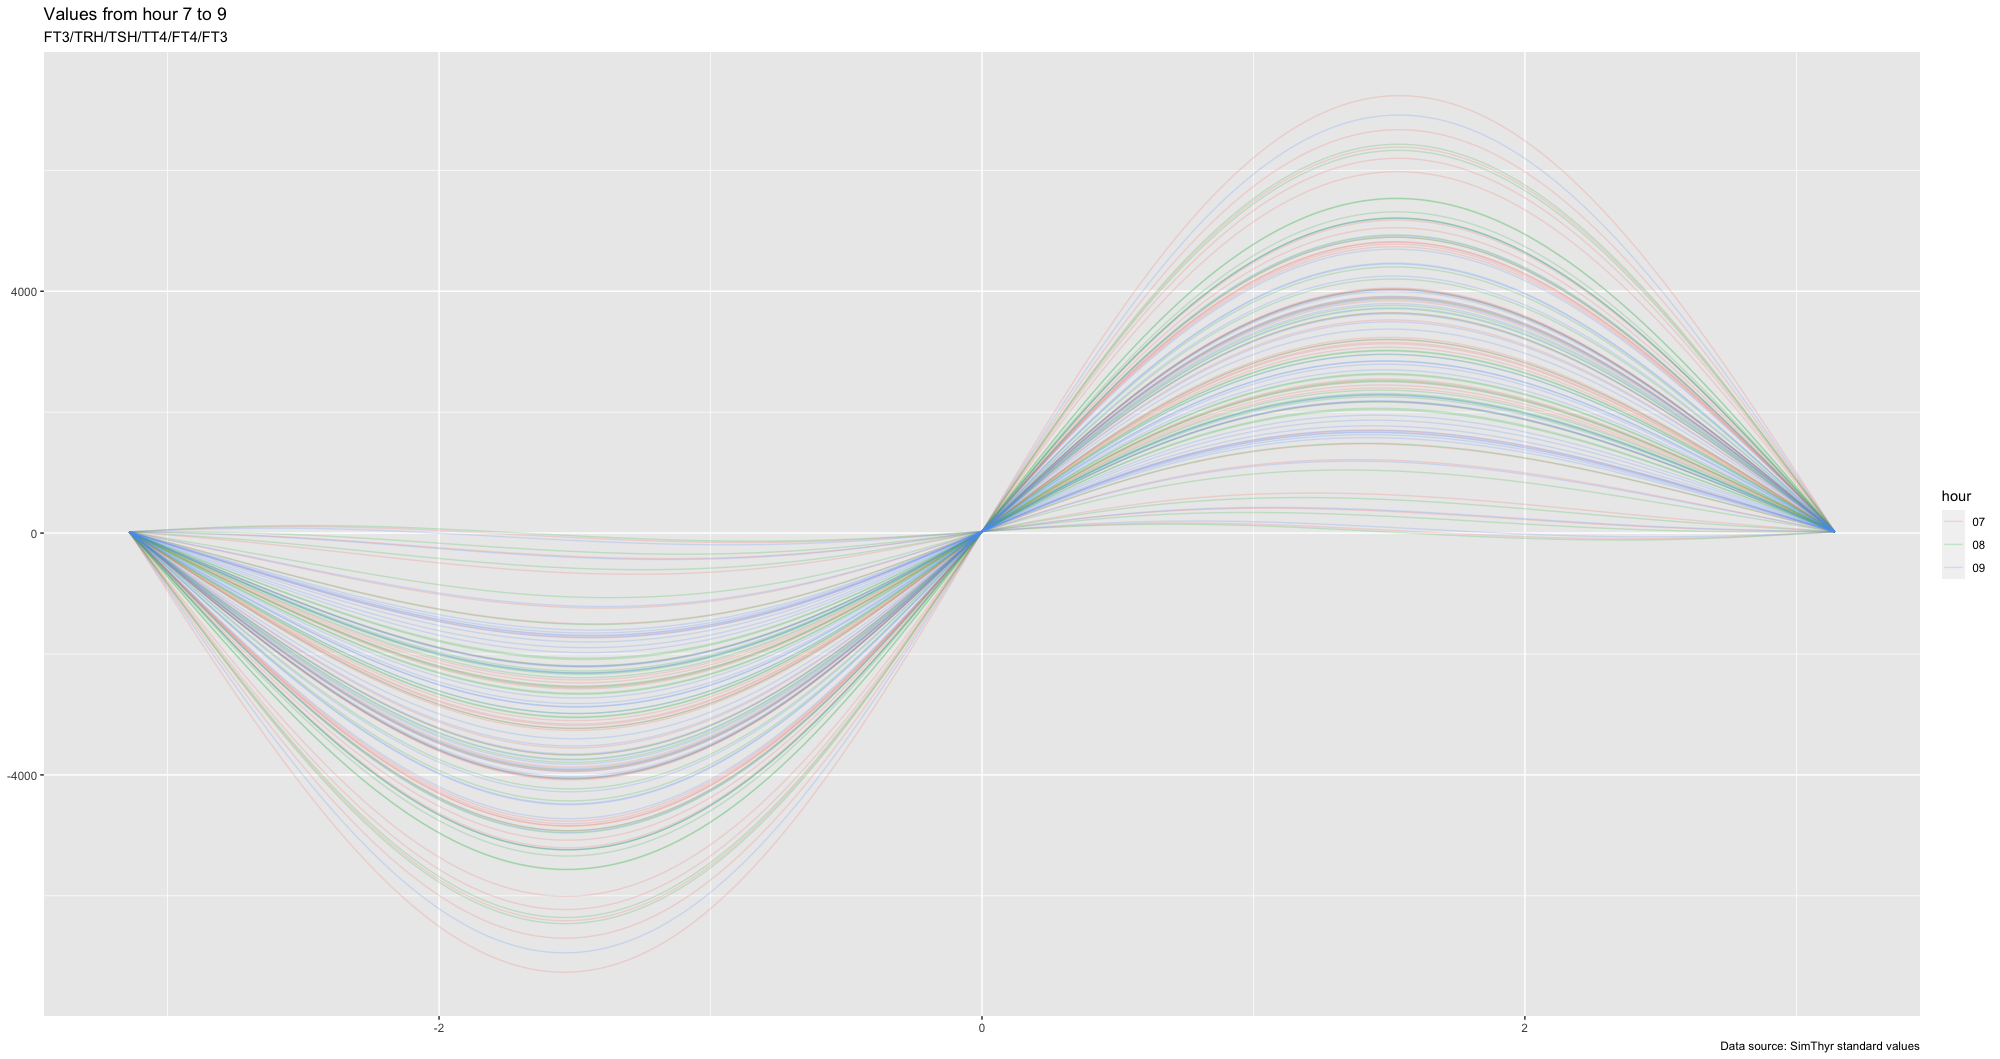
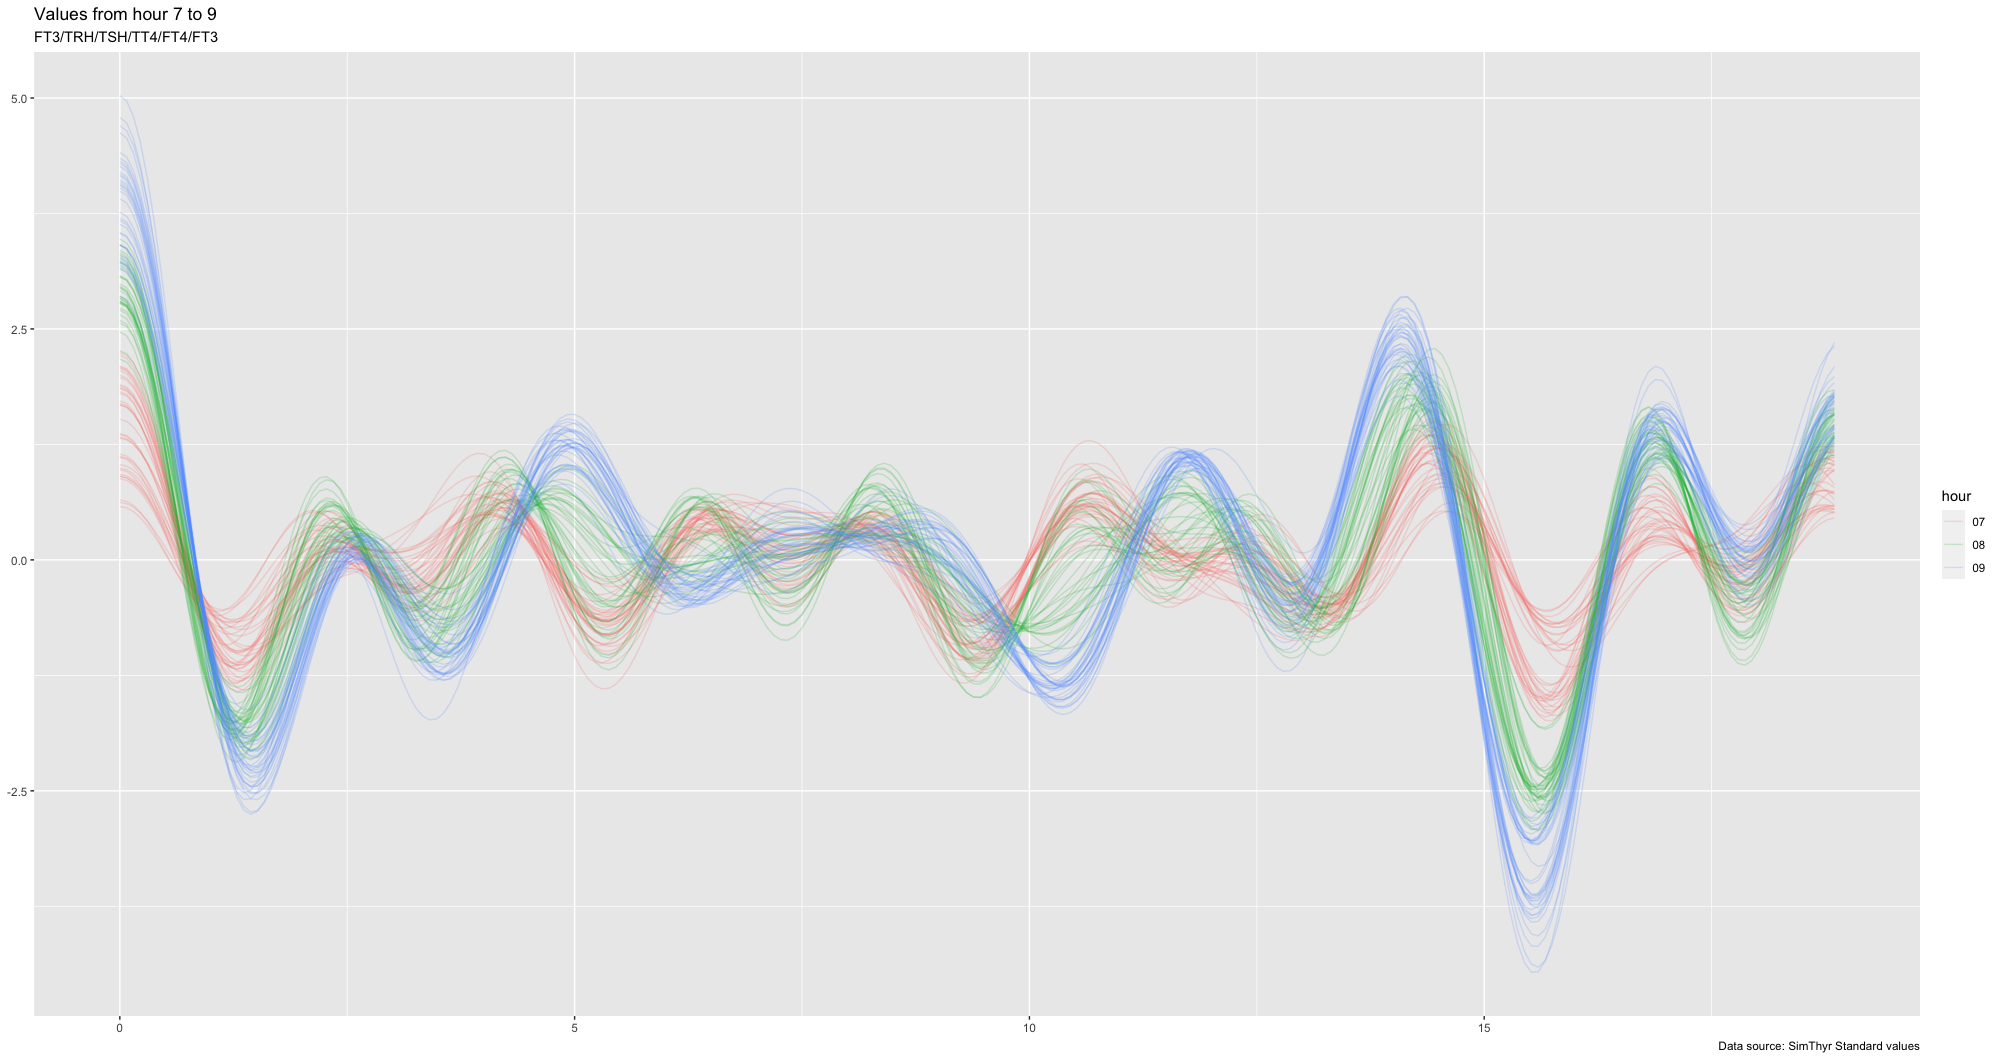
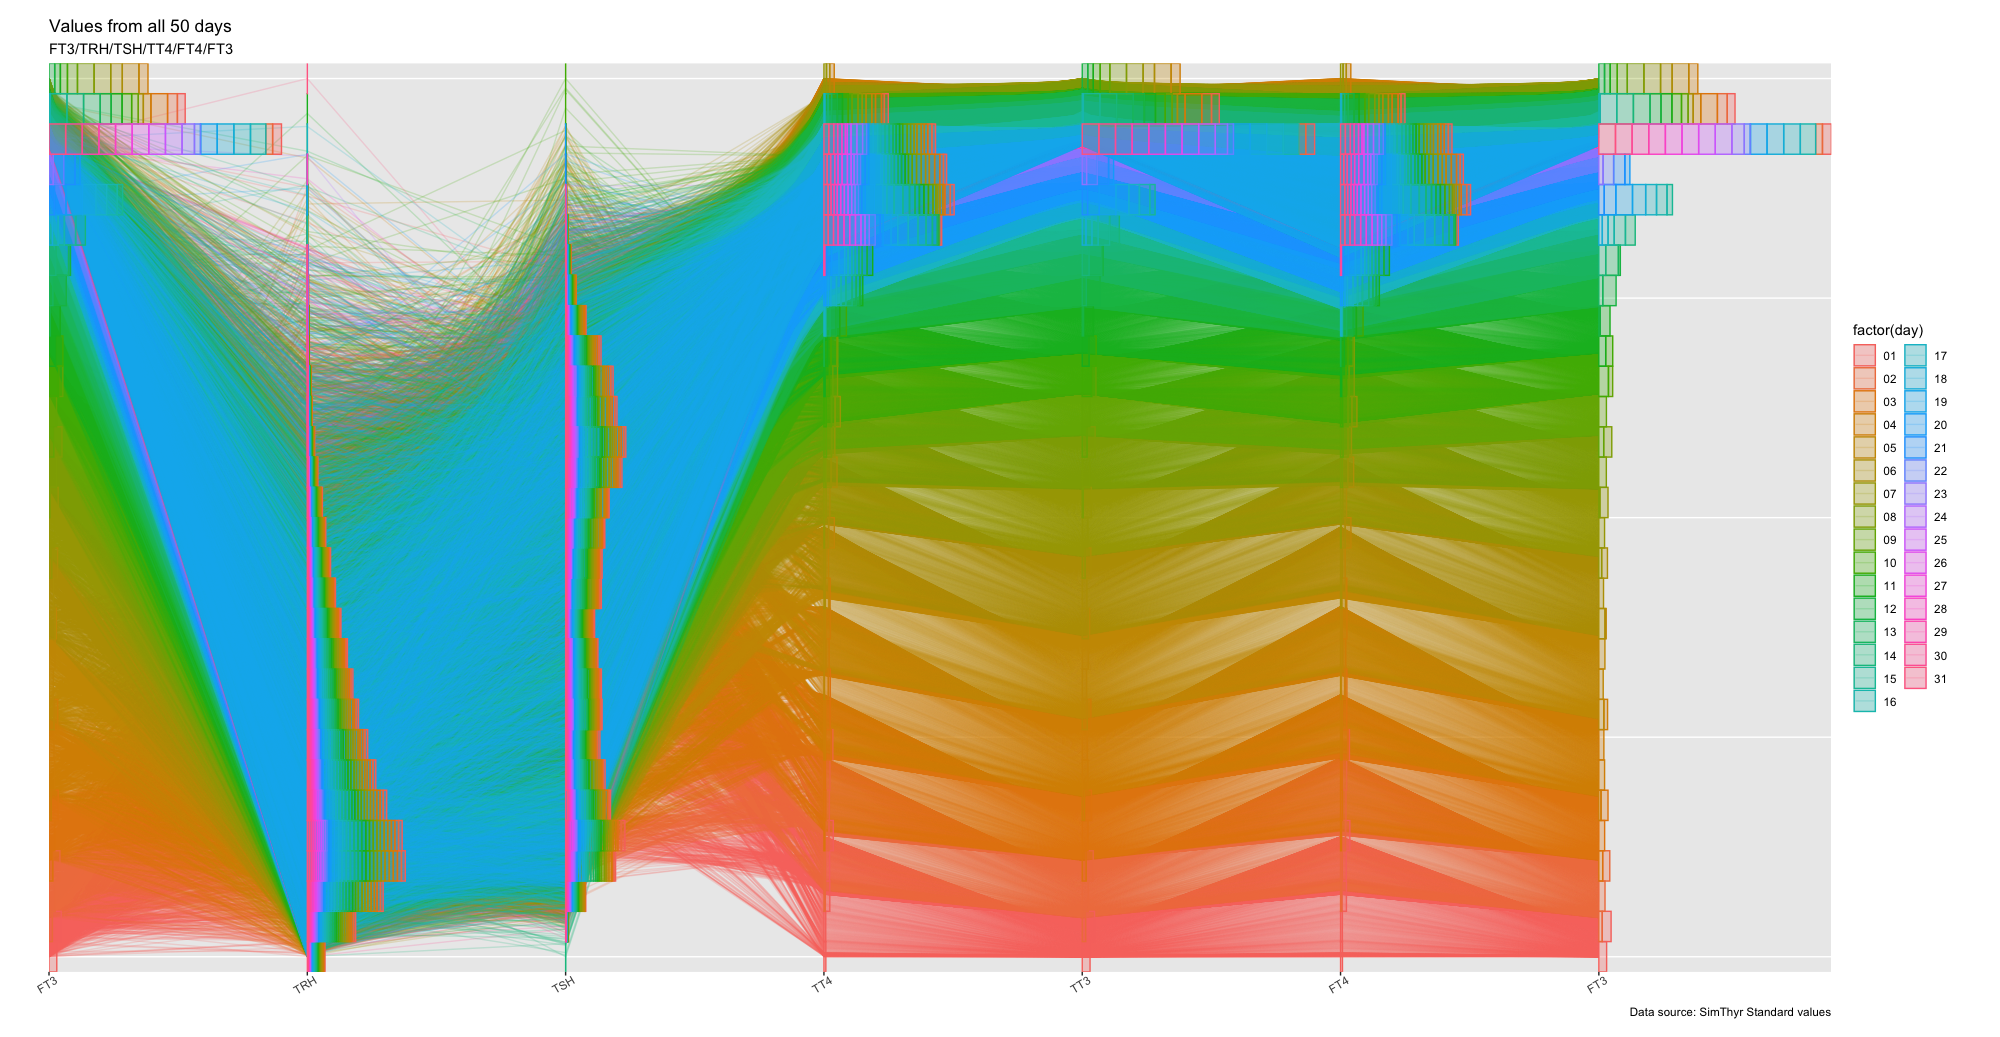
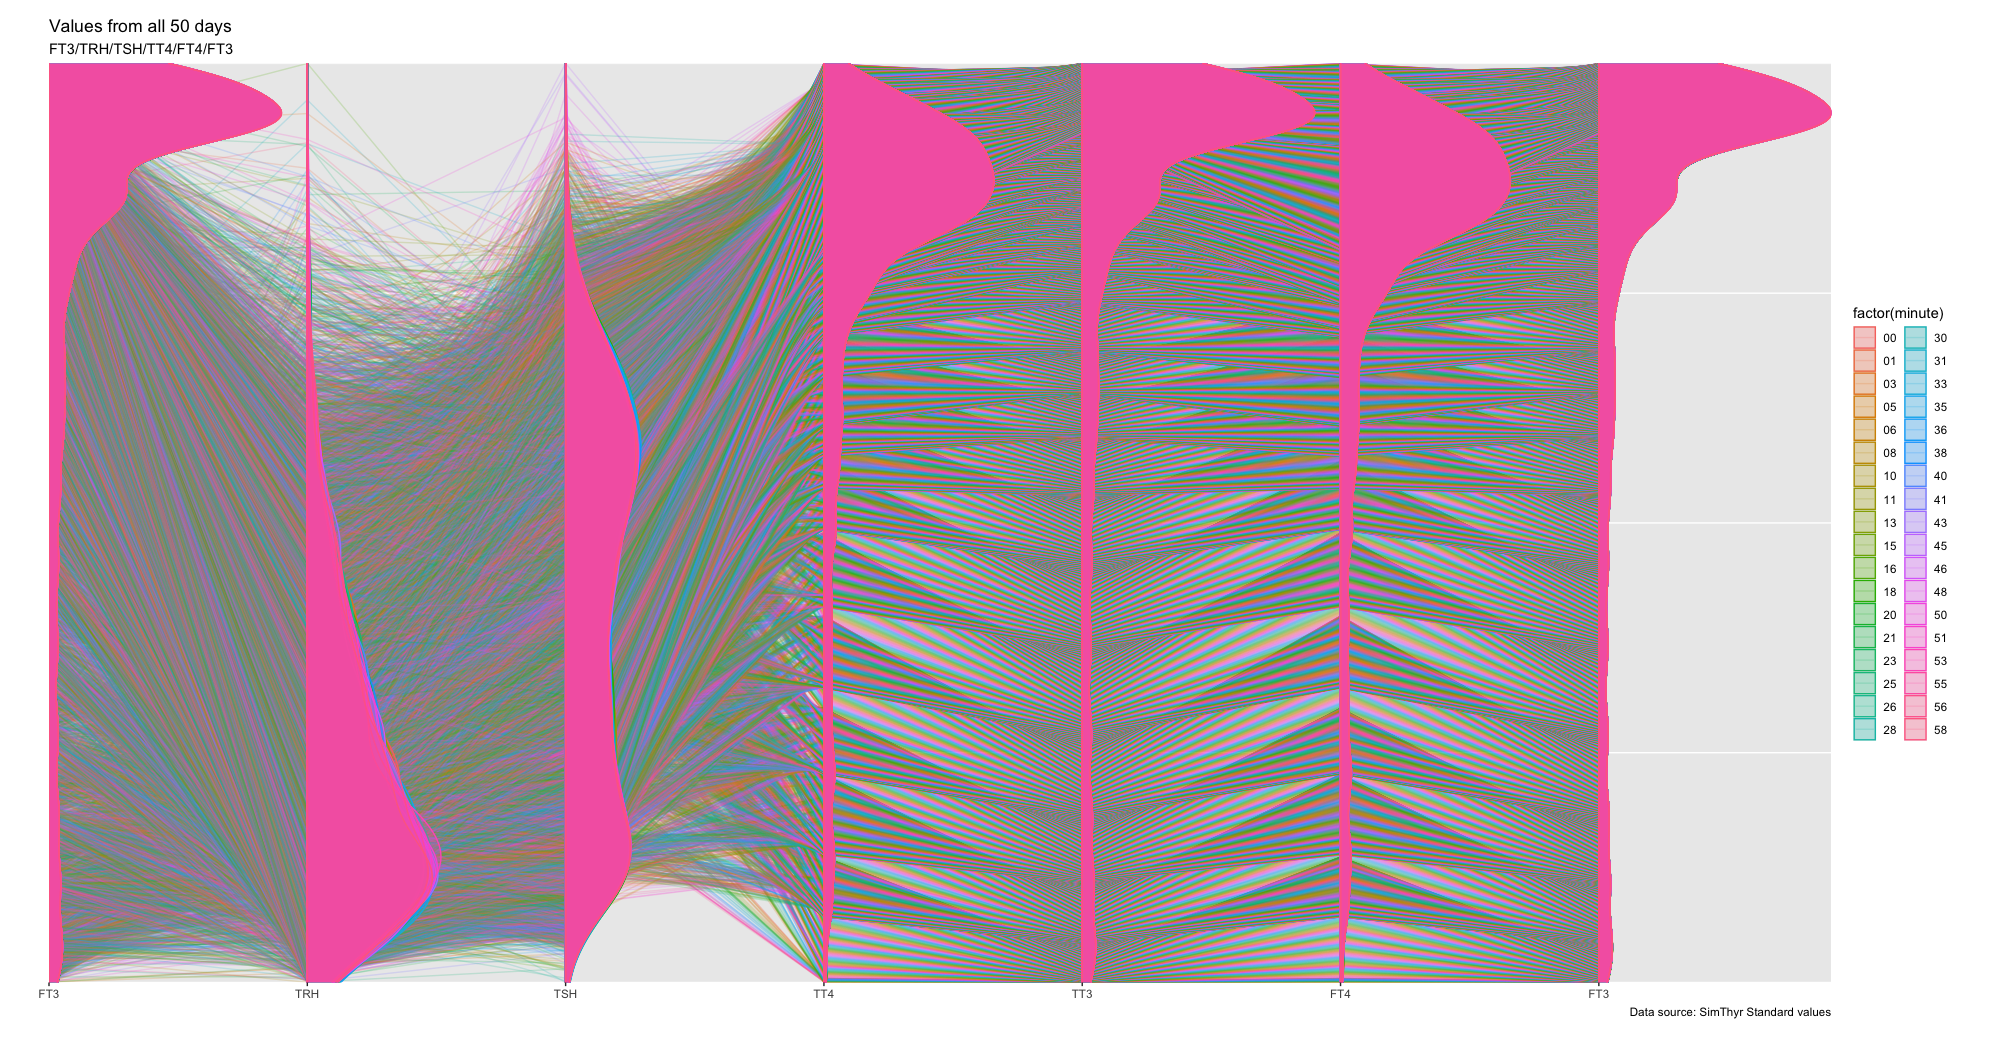
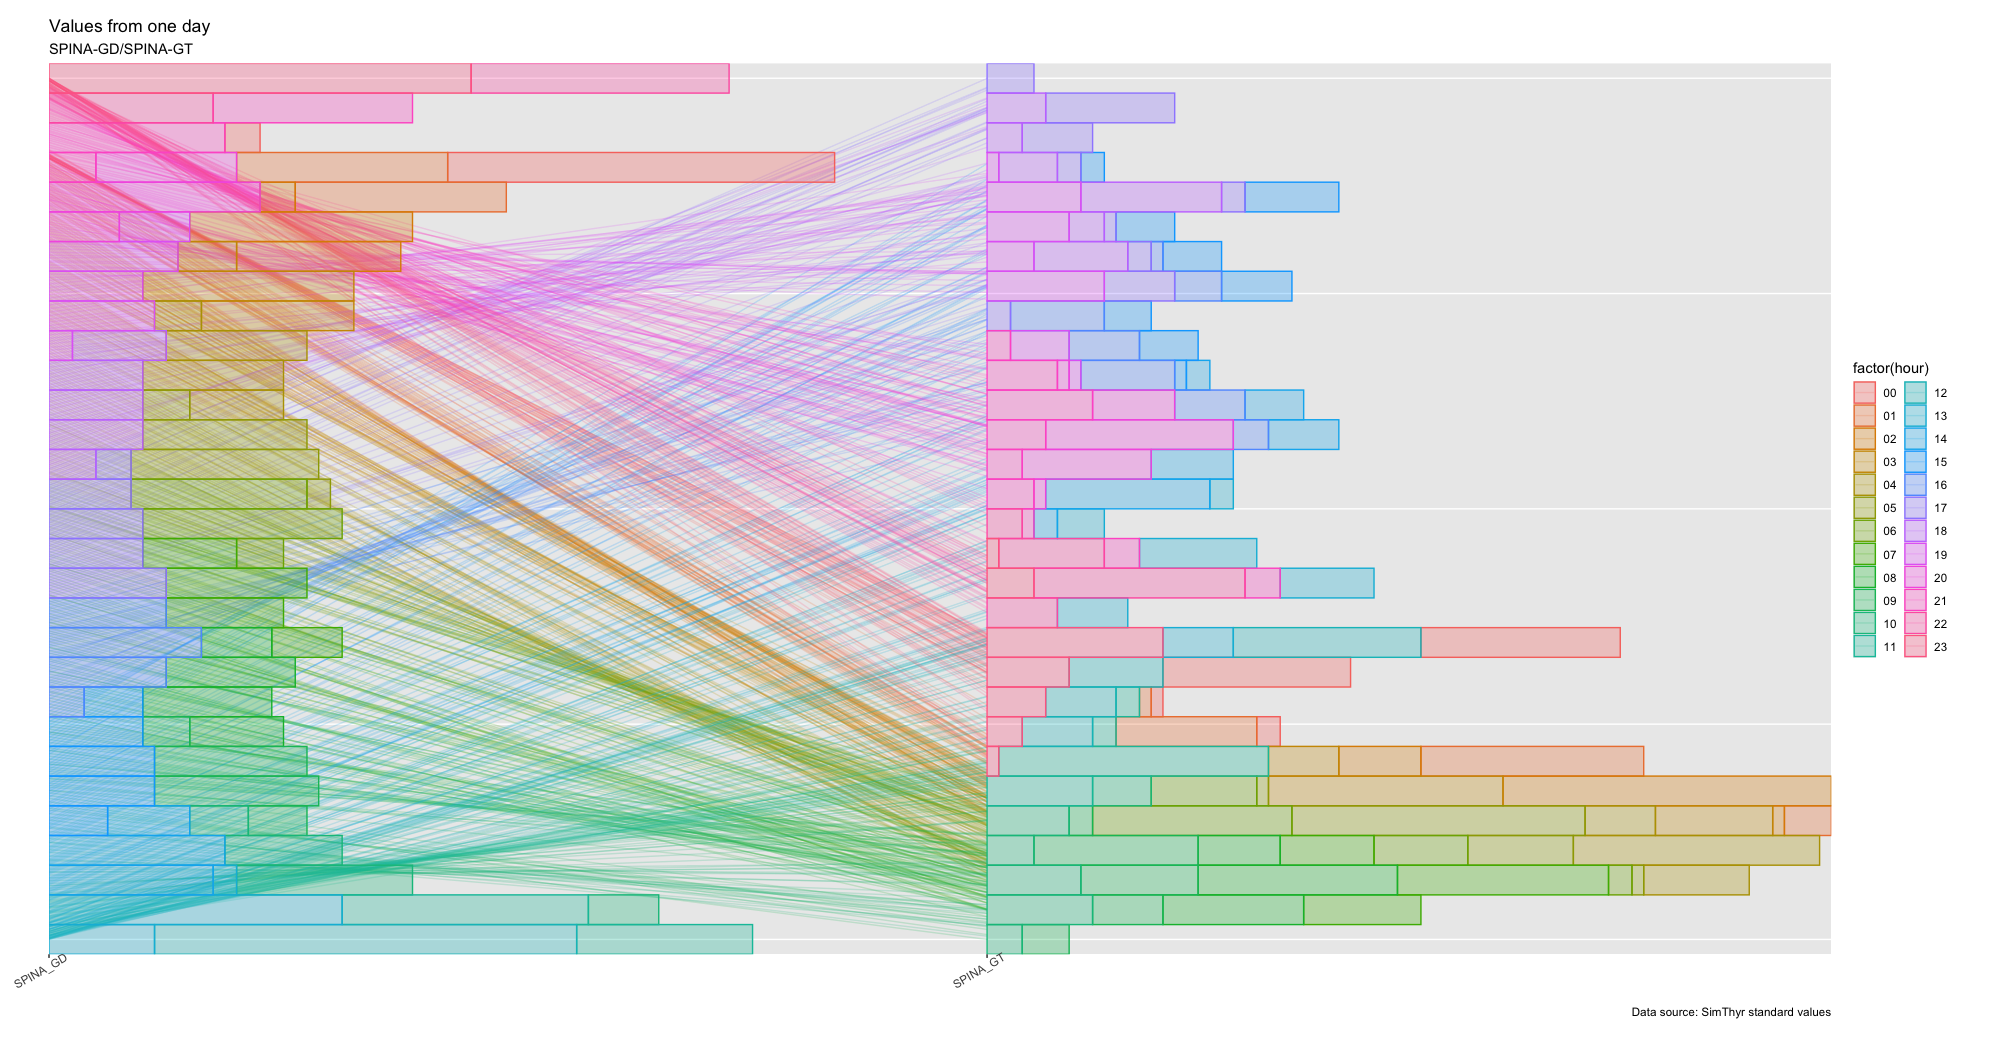
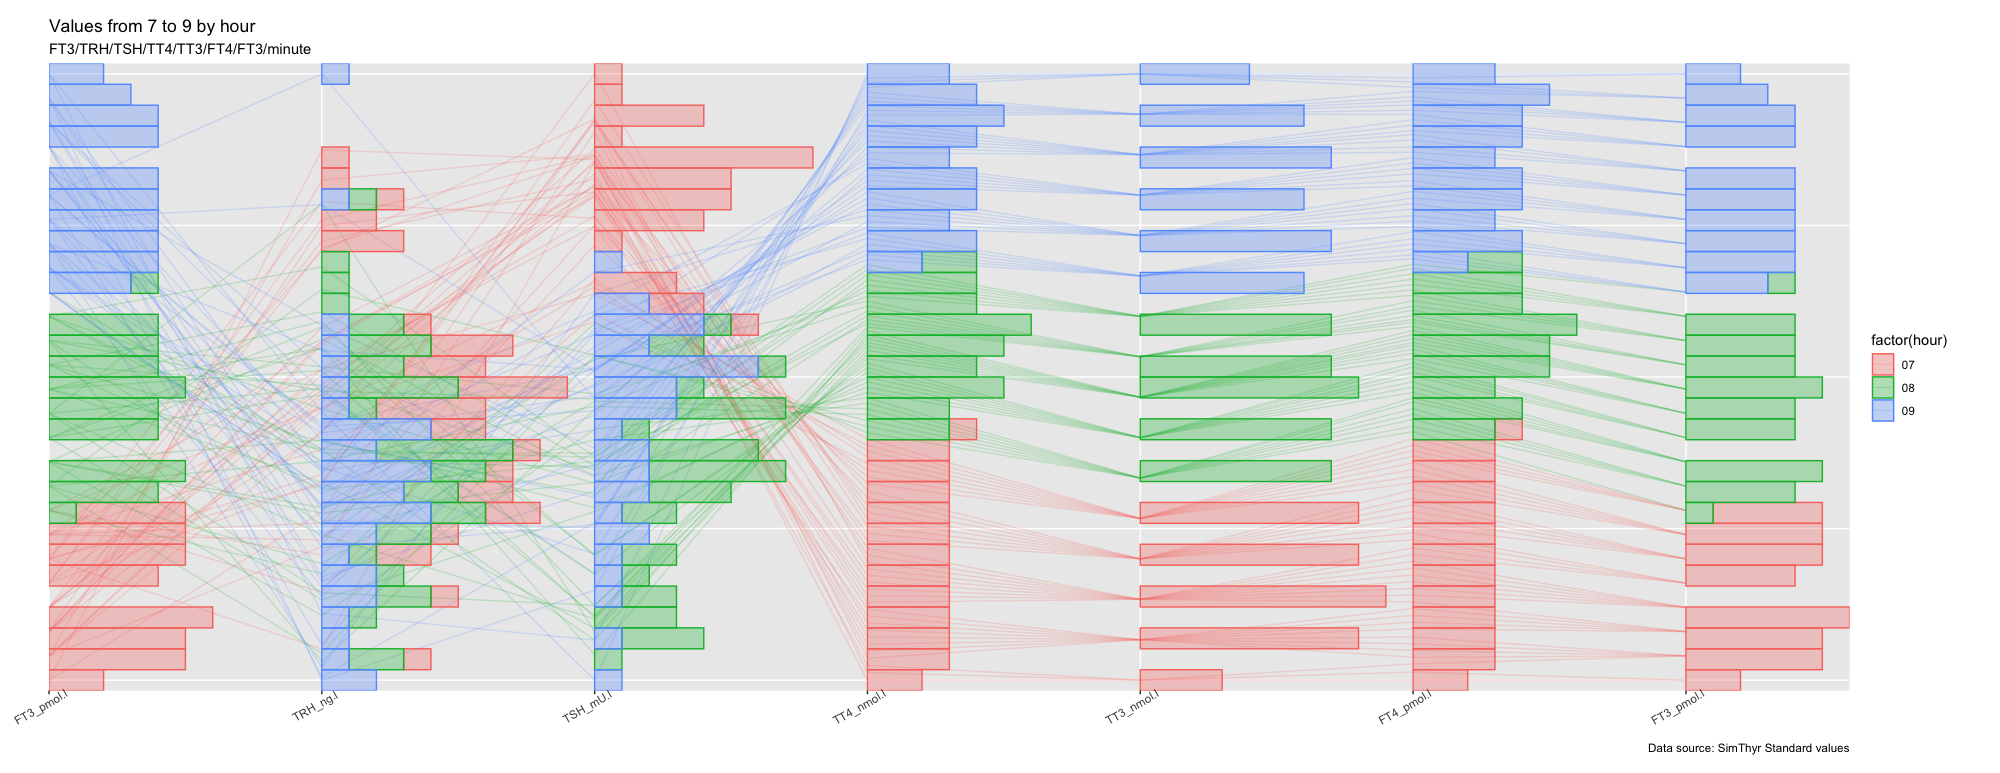
Standard
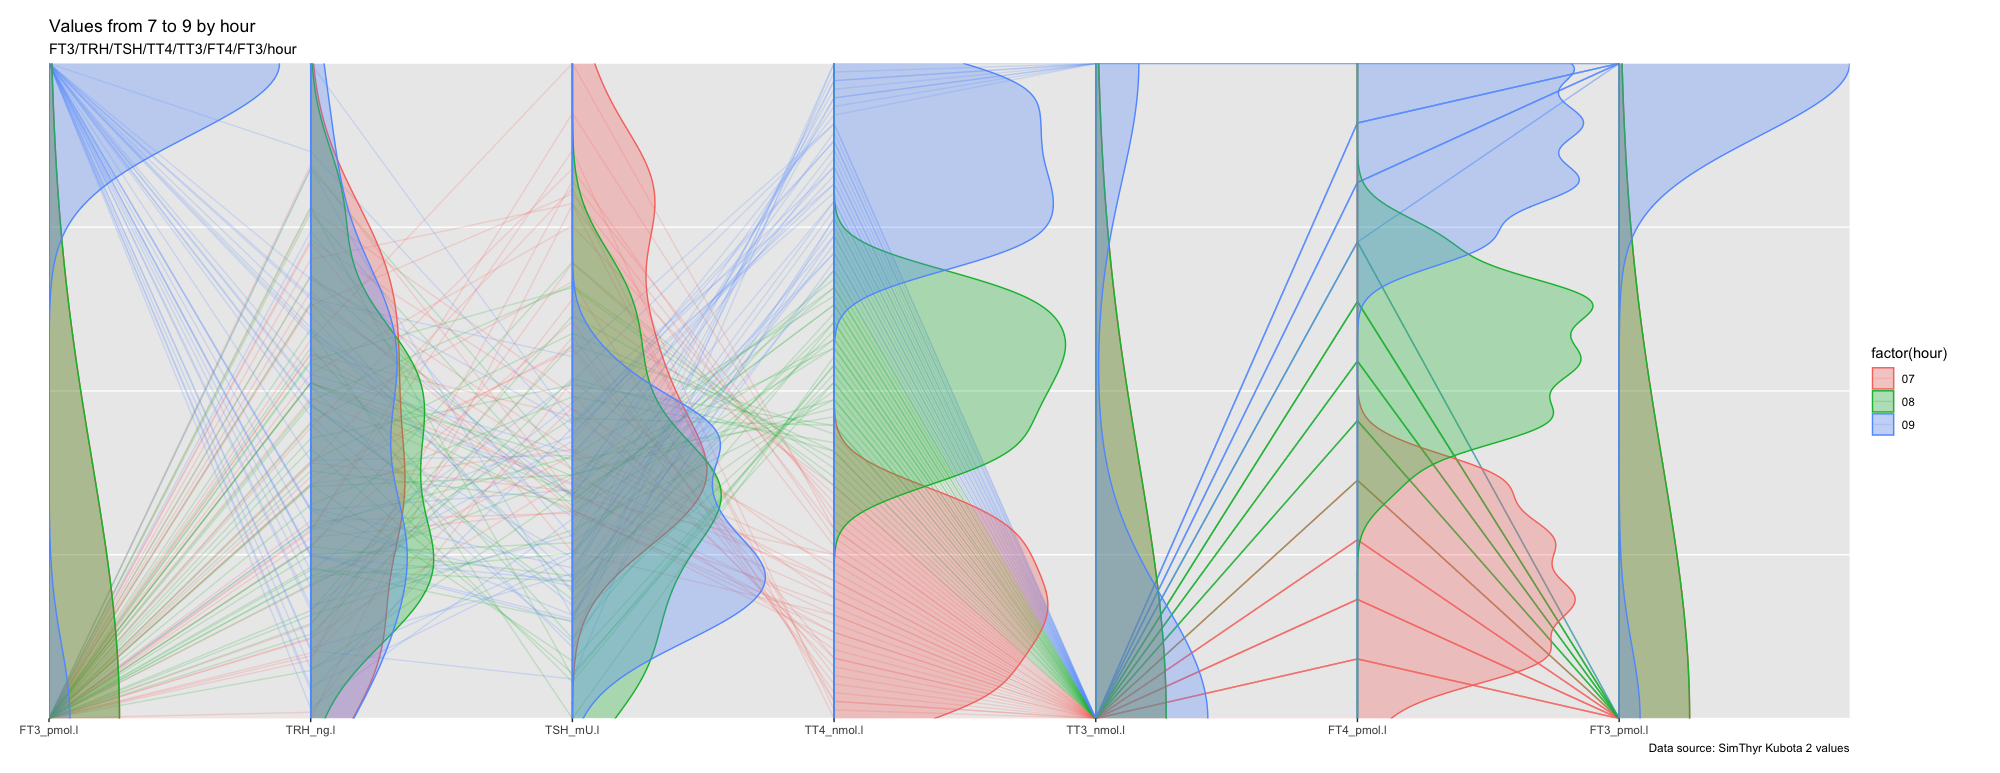
Looking at the density profiles for each of the hours 7 to 9 shows that there is only one value for TT3 and FT3 for the time 7 to 8 - which causes the algorithm to exclude the number. Apart from this we also see changes in the profiles for TSH compared to both Pilo 1 and the Standard figures.
TSH:
Min. 1st Qu. Median Mean 3rd Qu. Max.
37.64 54.56 70.43 69.41 81.98 124.07
TSH:
Min. 1st Qu. Median Mean 3rd Qu. Max.
0.000 1.013 1.360 1.329 1.621 2.299
TSH:
Min. 1st Qu. Median Mean 3rd Qu. Max.
1.048 1.568 2.074 2.030 2.454 3.451
FT3:
Min. 1st Qu. Median Mean 3rd Qu. Max.
3.121 3.121 3.122 3.122 3.124 3.124
FT3:
Min. 1st Qu. Median Mean 3rd Qu. Max.
6.942 6.945 6.962 6.962 6.980 6.983
FT3:
Min. 1st Qu. Median Mean 3rd Qu. Max.
5.601 5.601 5.604 5.604 5.607 5.607
FT4:
Min. 1st Qu. Median Mean 3rd Qu. Max.
6.441 6.442 6.445 6.445 6.447 6.448
FT4:
Min. 1st Qu. Median Mean 3rd Qu. Max.
13.63 13.67 13.71 13.71 13.74 13.79
FT4:
Min. 1st Qu. Median Mean 3rd Qu. Max.
18.47 18.49 18.52 18.53 18.57 18.59
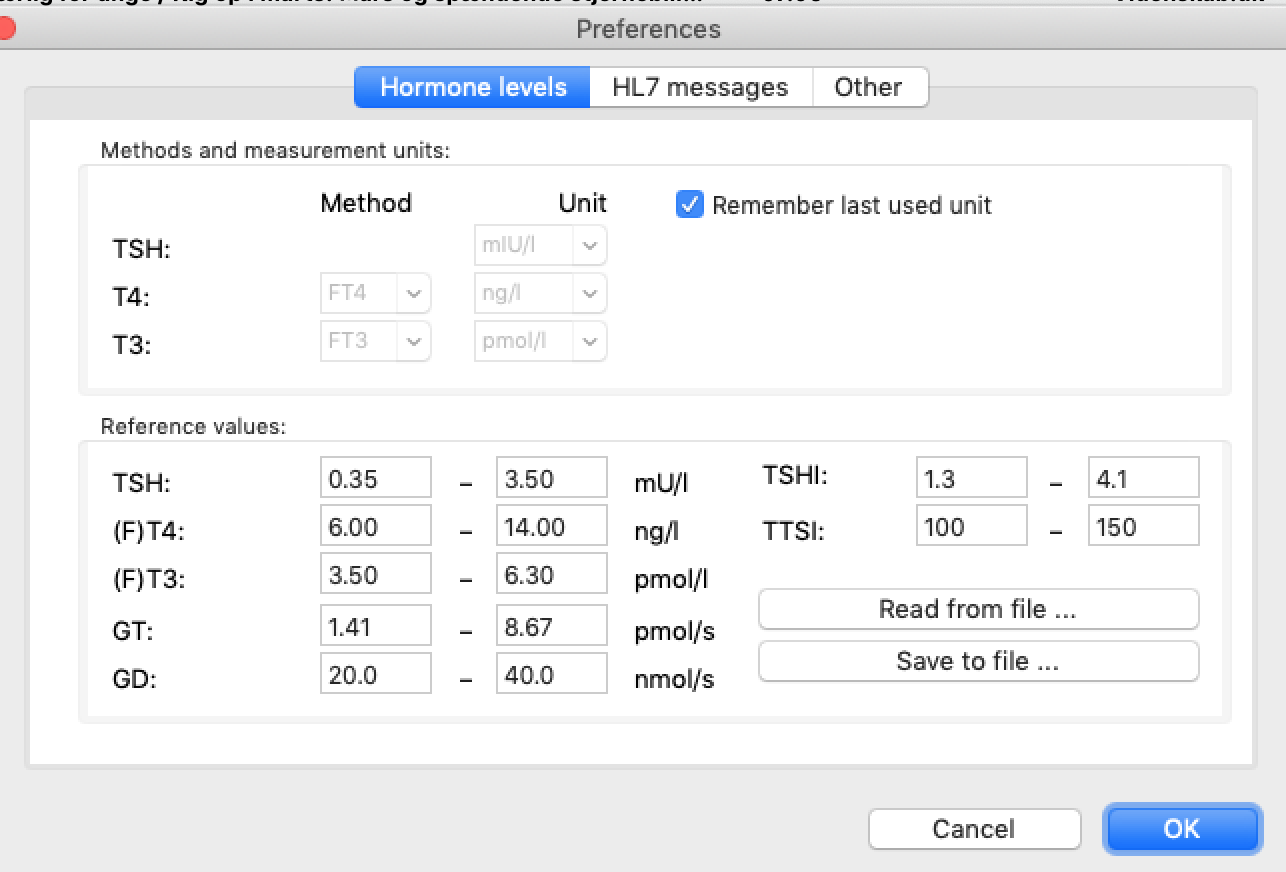
Proposed reference intervals from SPINA-THYR
Units for the different parameters.
What does the algorithm do?
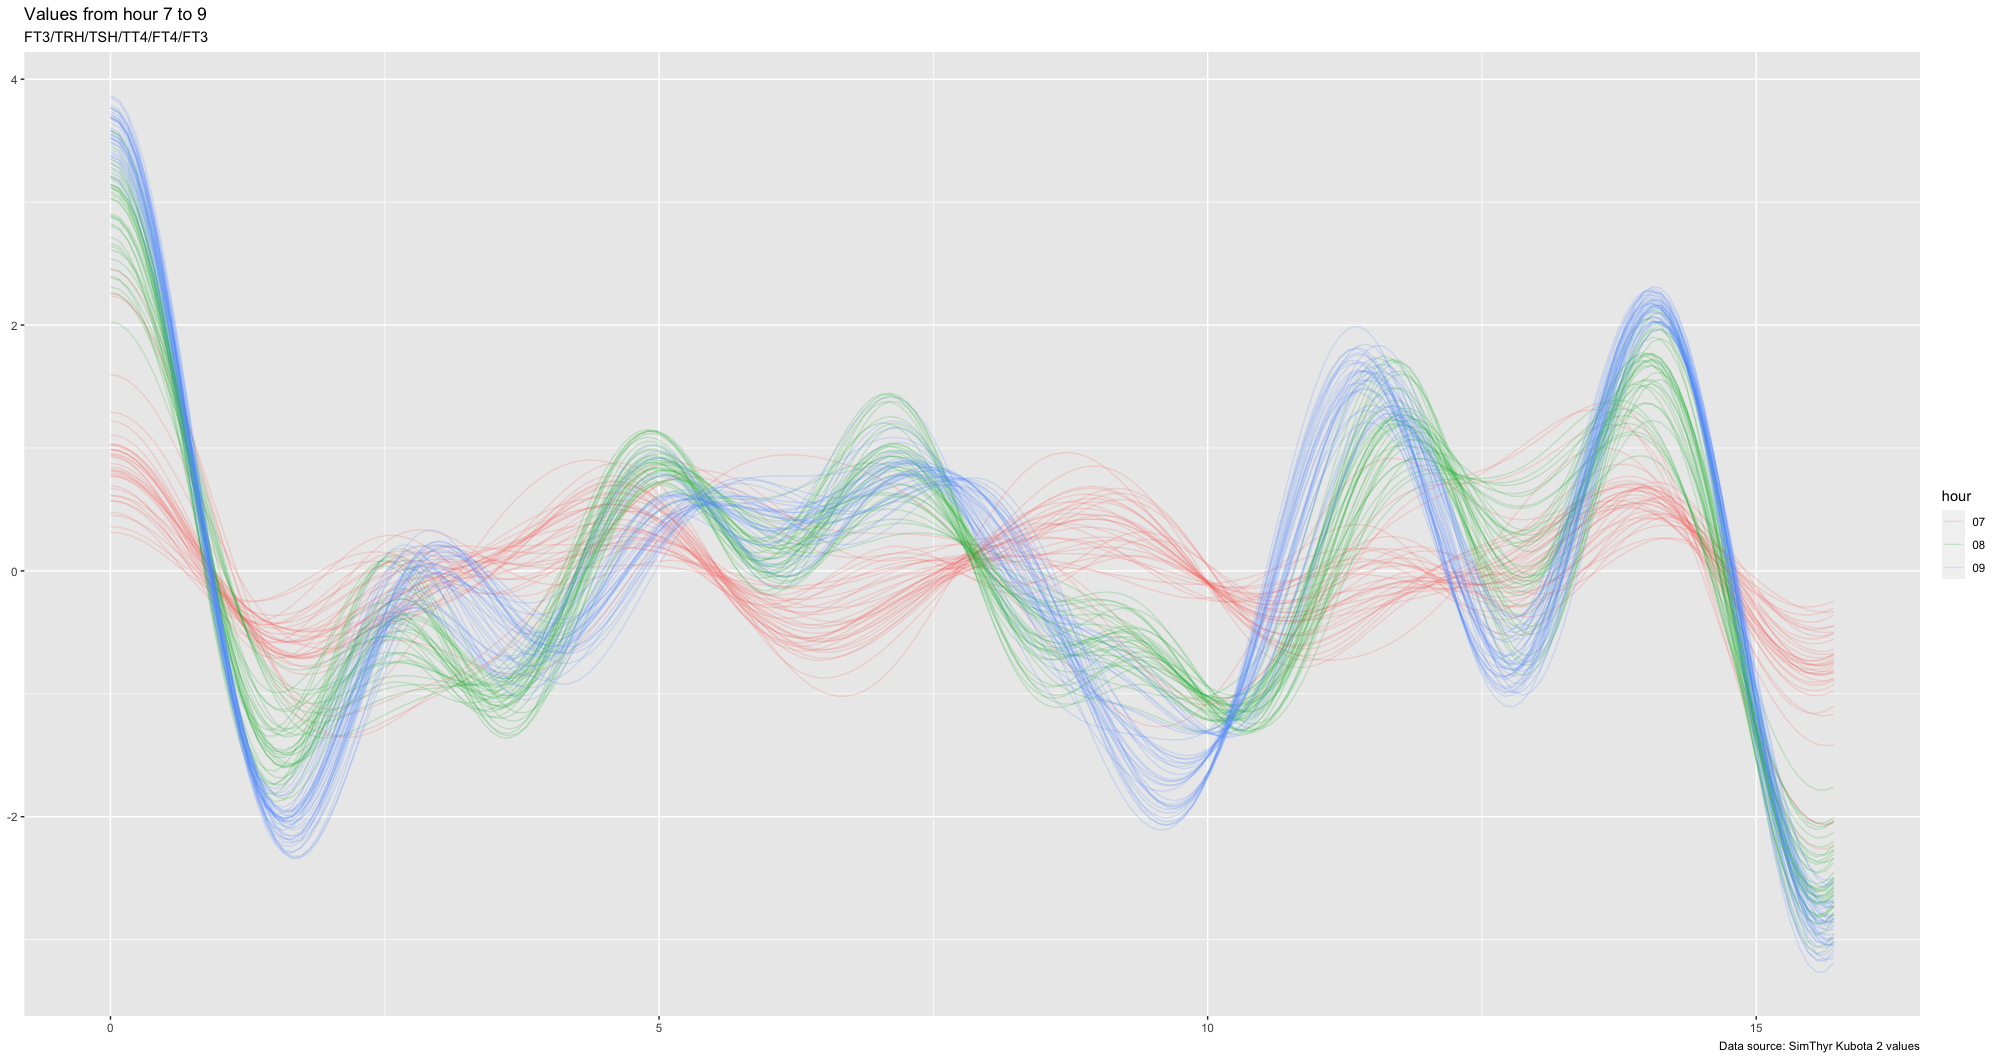
Parallel
coordinates use parallel axes instead of perpendicular to
represent dimensions of a multidimensional data set [25], [26]. A
vertical line is used for the projection of each dimension or
attribute, with the maximum and minimum values of each dimension
usually scaled to the upper and lower boundaries on those vertical
lines. A polyline made up of n-1 lines at the appropriate
dimensional values connects the axes to represent an n-dimensional
point.
Georges
Grinstein,
Marjan Trutschl, Urška
Cvek
(http://citeseerx.ist.psu.edu/viewdoc/download?doi=10.1.1.103.528&rep=rep1&type=pdf)
Referring
to https://link.springer.com/chapter/10.1007/978-4-431-68057-4_3
and https://link.springer.com/article/10.1007/BF01898350
See also this reference: http://www.agocg.ac.uk/reports/visual/casestud/brunsdon/parallel.htm
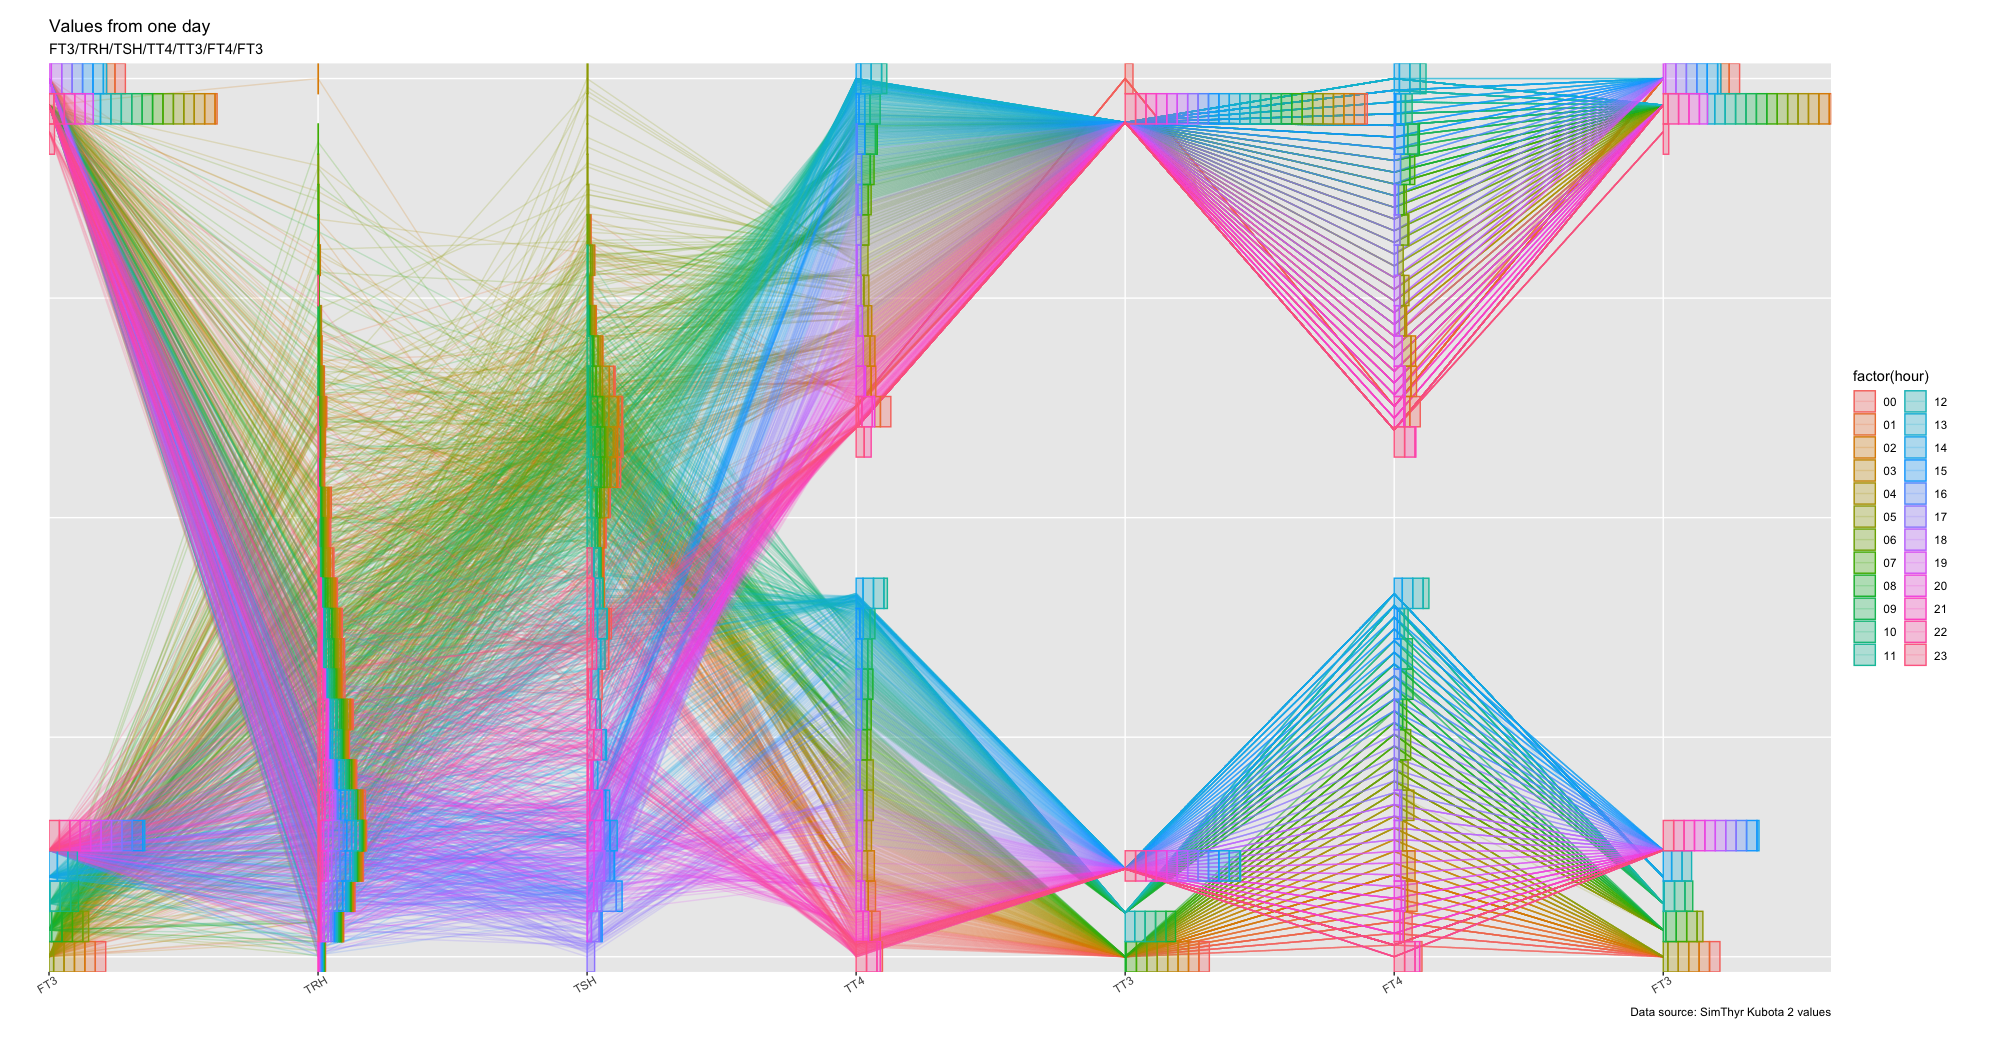
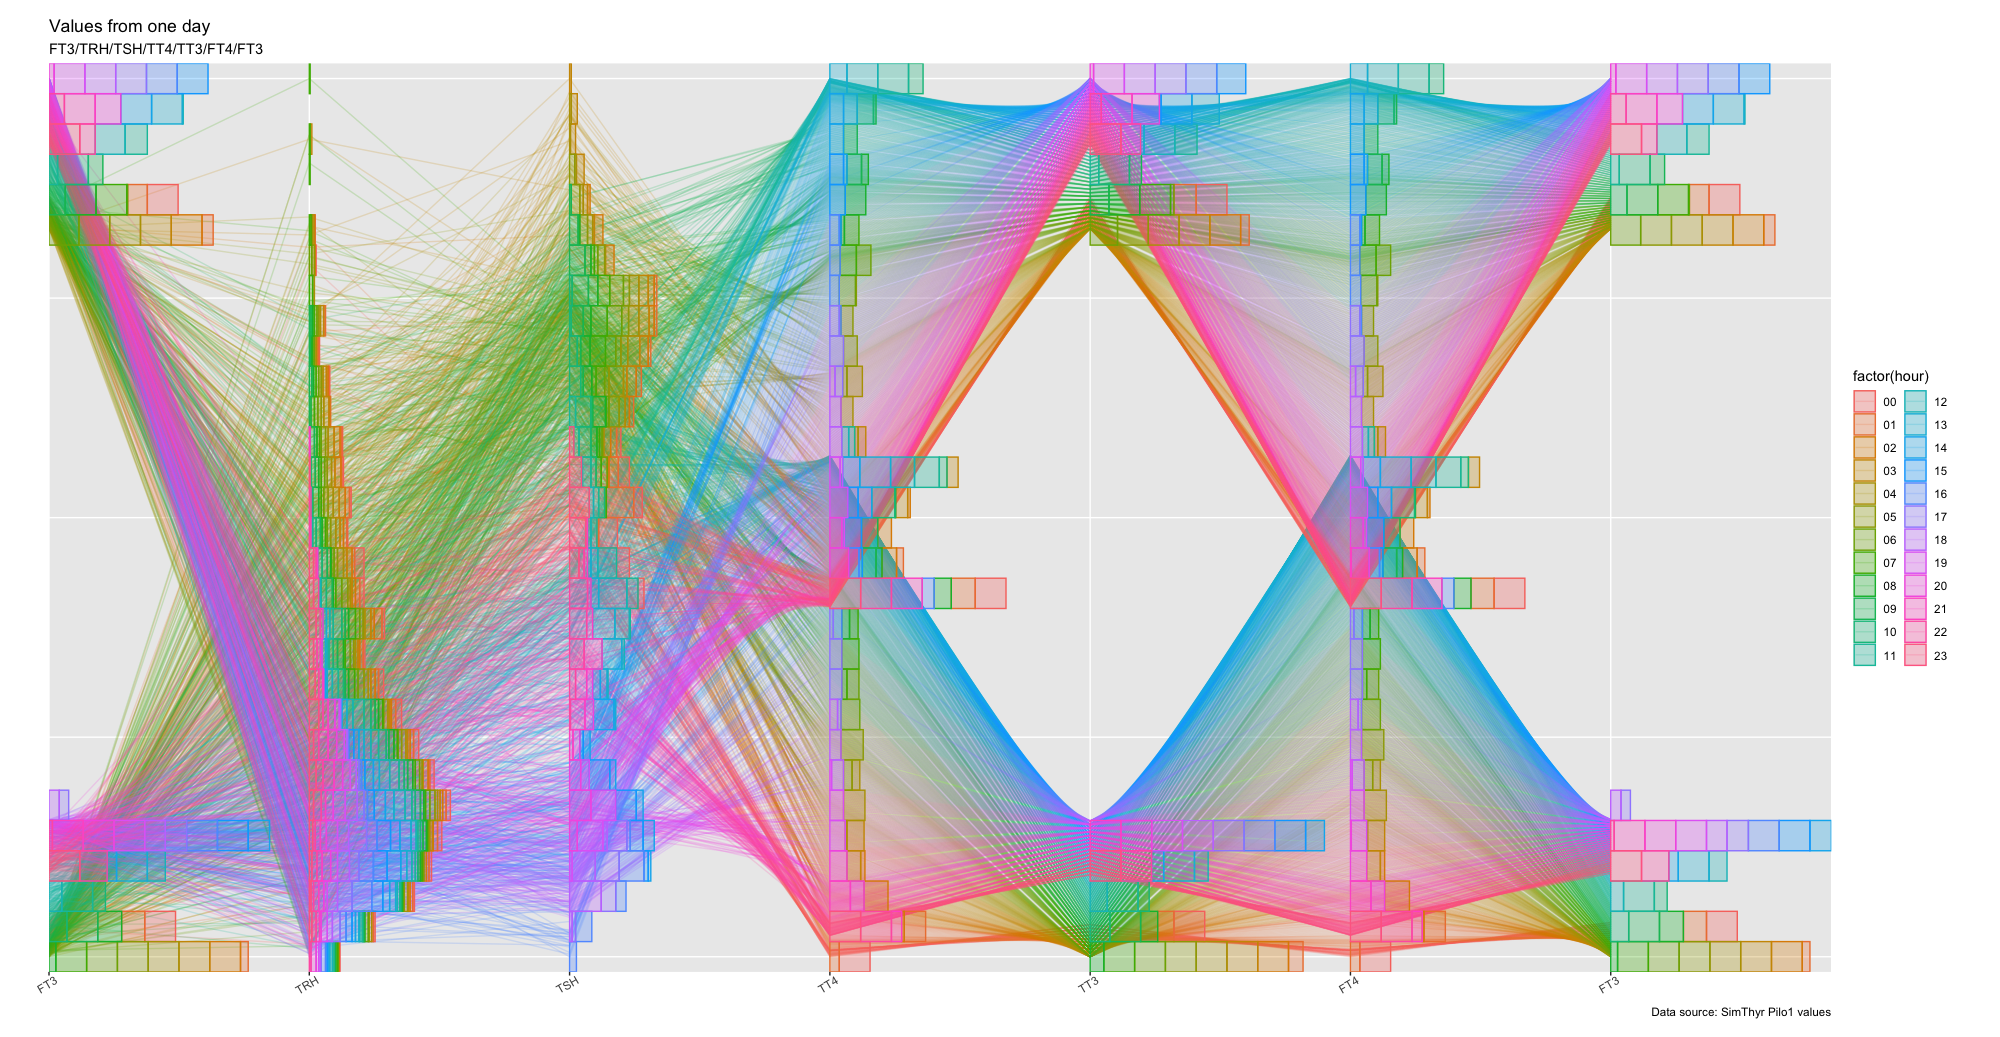
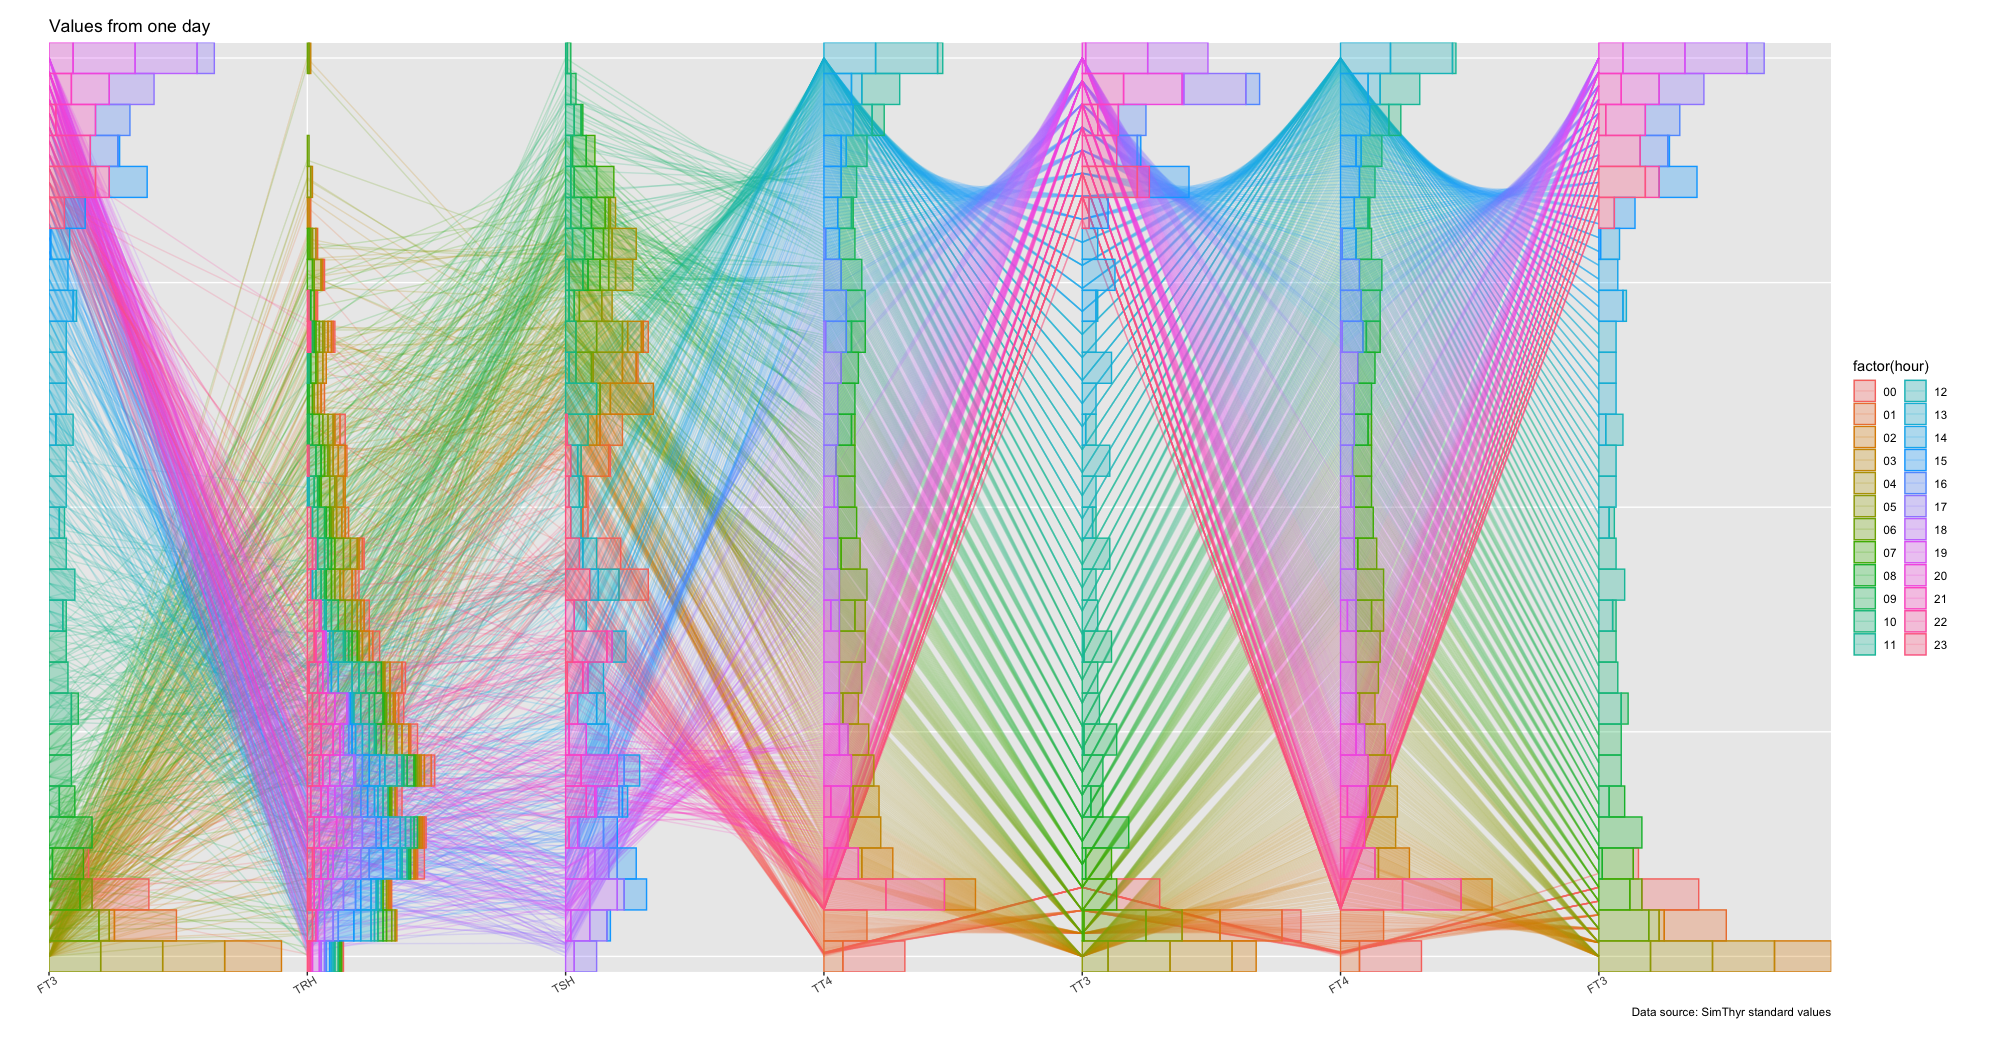
It is obvious that with disease the patterns changes, with the values for T3 and T4 are compressed or turned. The patterns for T3 are changed, less obvious are the changes in TRH and TSH.
infinite axis
DAYS
MINUTES
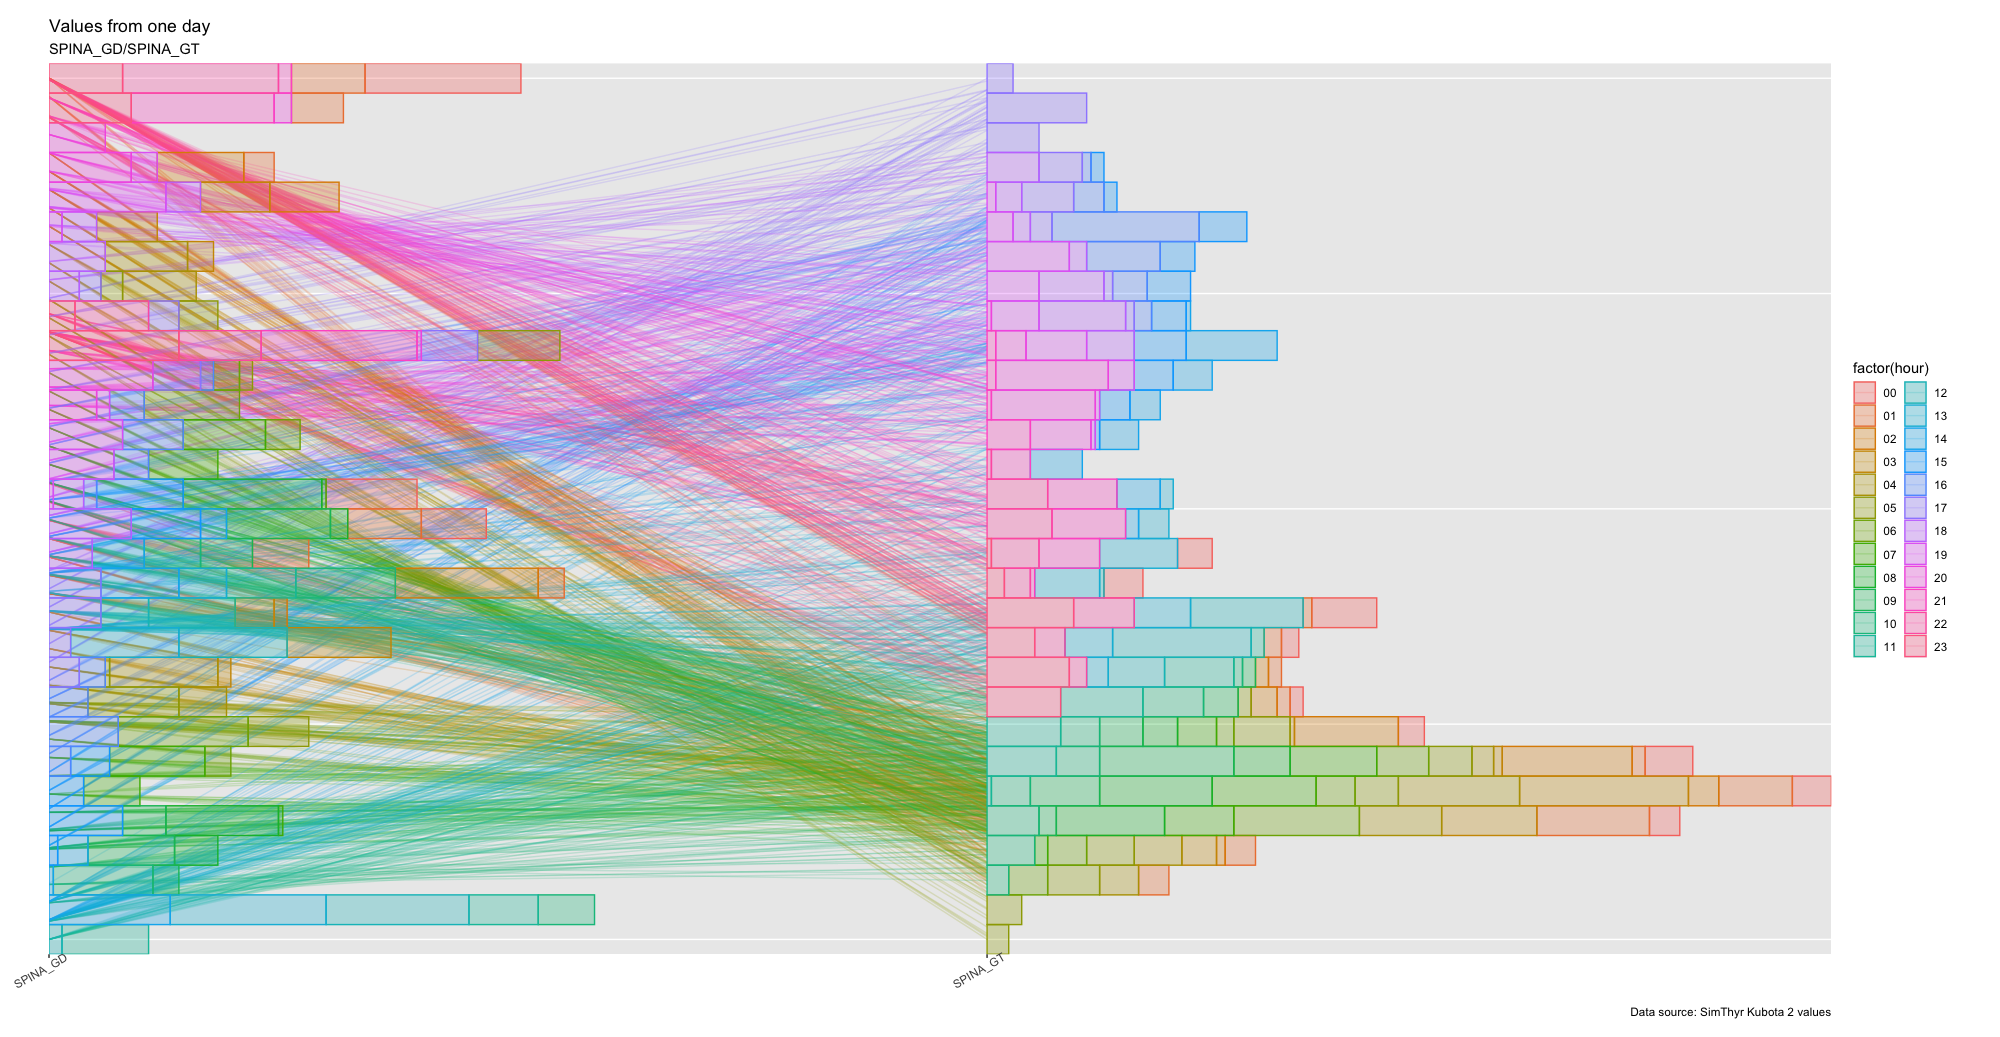
SPINA-GT:
Min. 1st Qu. Median Mean 3rd Qu. Max.
0.5010 0.5051 0.5083 0.5101 0.5154 0.5239
SPINA-GT:
Min. 1st Qu. Median Mean 3rd Qu. Max.
2.443 2.810 3.160 3.345 3.868 5.036
SPINA-GT:
Min. 1st Qu. Median Mean 3rd Qu. Max.
2.681 2.966 3.317 3.447 3.906 4.734
SPINA-GD:
Min. 1st Qu. Median Mean 3rd Qu. Max.
44.78 44.79 44.80 44.80 44.80 44.81
SPINA-GD:
Min. 1st Qu. Median Mean 3rd Qu. Max.
46.78 46.84 46.95 46.96 47.08 47.13
SPINA-GD:
Min. 1st Qu. Median Mean 3rd Qu. Max.
27.87 27.91 27.97 27.97 28.03 28.05
19 - 24 - TT3_nmol.l
Min. 1st Qu. Median Mean 3rd Qu. Max.
1.864 1.864 1.864 1.864 1.864 1.864
19-24 - TT3_nmol.l
Min. 1st Qu. Median Mean 3rd Qu. Max.
3.999 3.999 3.999 3.999 3.999 3.999
19-24 - TT3_nmol.l
Min. 1st Qu. Median Mean 3rd Qu. Max.
3.223 3.223 3.224 3.224 3.224 3.224
19 - 24 - FT3_pmol.l
Min. 1st Qu. Median Mean 3rd Qu. Max.
3.102 3.102 3.102 3.102 3.102 3.102
19 - 24 - FT3_pmol.l
Min. 1st Qu. Median Mean 3rd Qu. Max.
6.653 6.654 6.654 6.654 6.654 6.654
19 - 24 - FT3_pmol.l
Min. 1st Qu. Median Mean 3rd Qu. Max.
5.363 5.363 5.364 5.364 5.364 5.365
19 - 24 - FT4_pmol.l
Min. 1st Qu. Median Mean 3rd Qu. Max.
6.405 6.405 6.405 6.405 6.405 6.405
19 - 24 - FT4_pmol.l
Min. 1st Qu. Median Mean 3rd Qu. Max.
13.10 13.10 13.11 13.11 13.11 13.13
19 - 24 - FT4_pmol.l
Min. 1st Qu. Median Mean 3rd Qu. Max.
17.75 17.75 17.75 17.75 17.76 17.77
19 - 24 - TSH_mU.l
Min. 1st Qu. Median Mean 3rd Qu. Max.
45.24 55.01 62.45 63.84 73.62 81.80
19 - 24 - TSH_mU.l
Min. 1st Qu. Median Mean 3rd Qu. Max.
0.7432 0.9606 1.0764 1.0639 1.1548 1.3557
19 - 24 - TSH_mU.l
Min. 1st Qu. Median Mean 3rd Qu. Max.
1.344 1.567 1.722 1.685 1.788 2.030
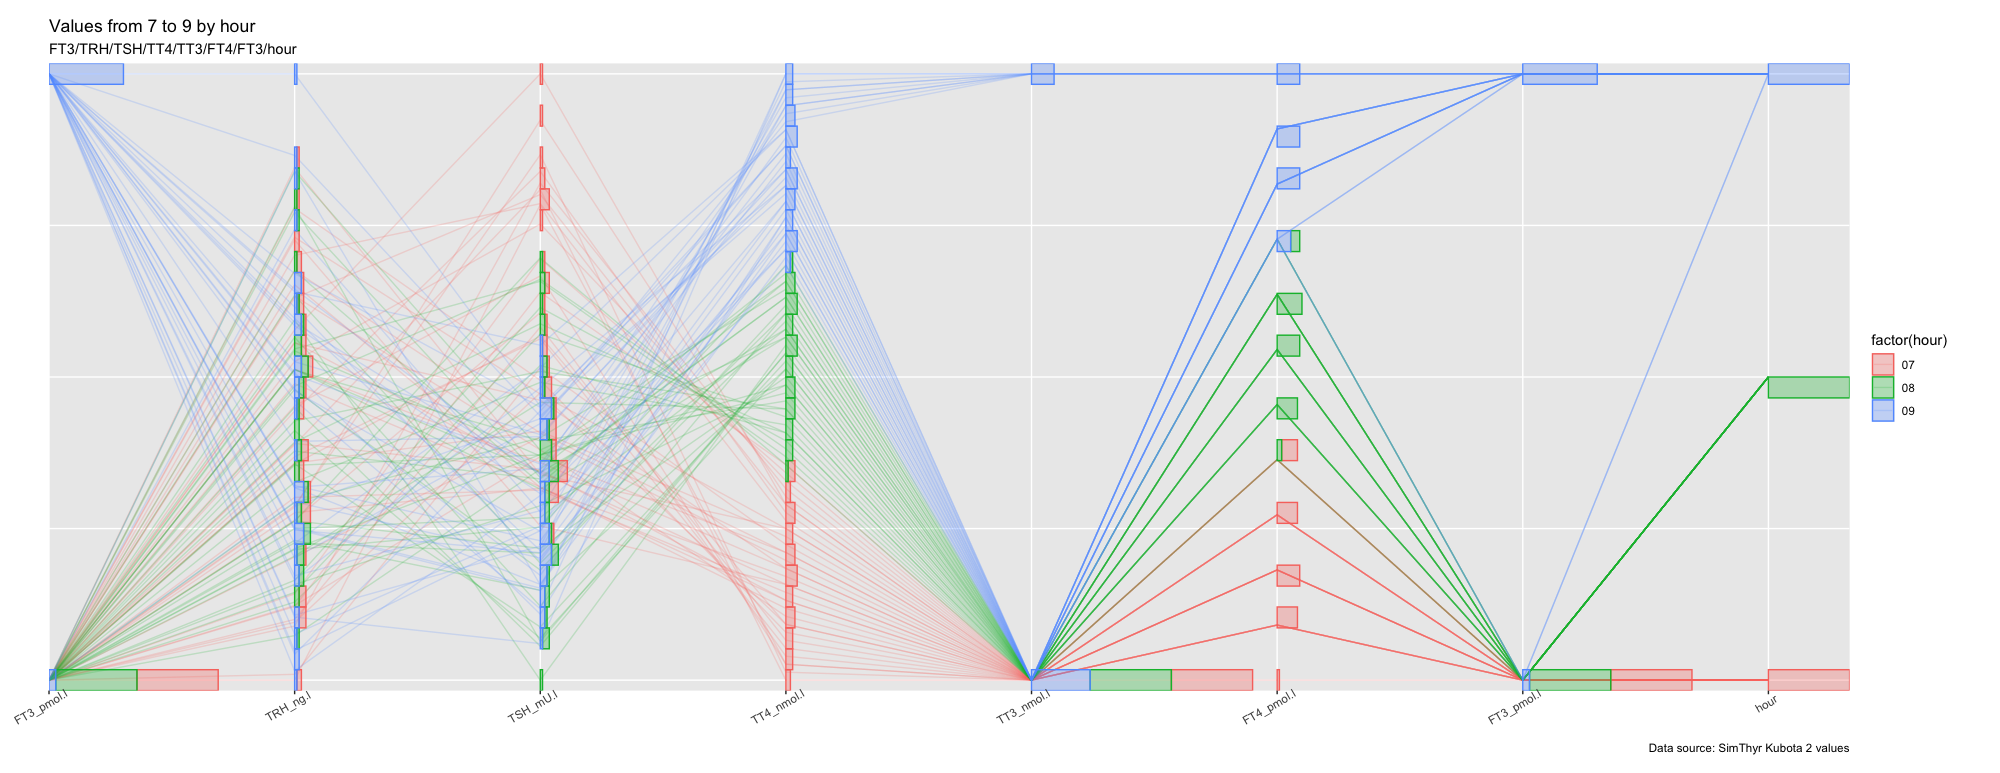
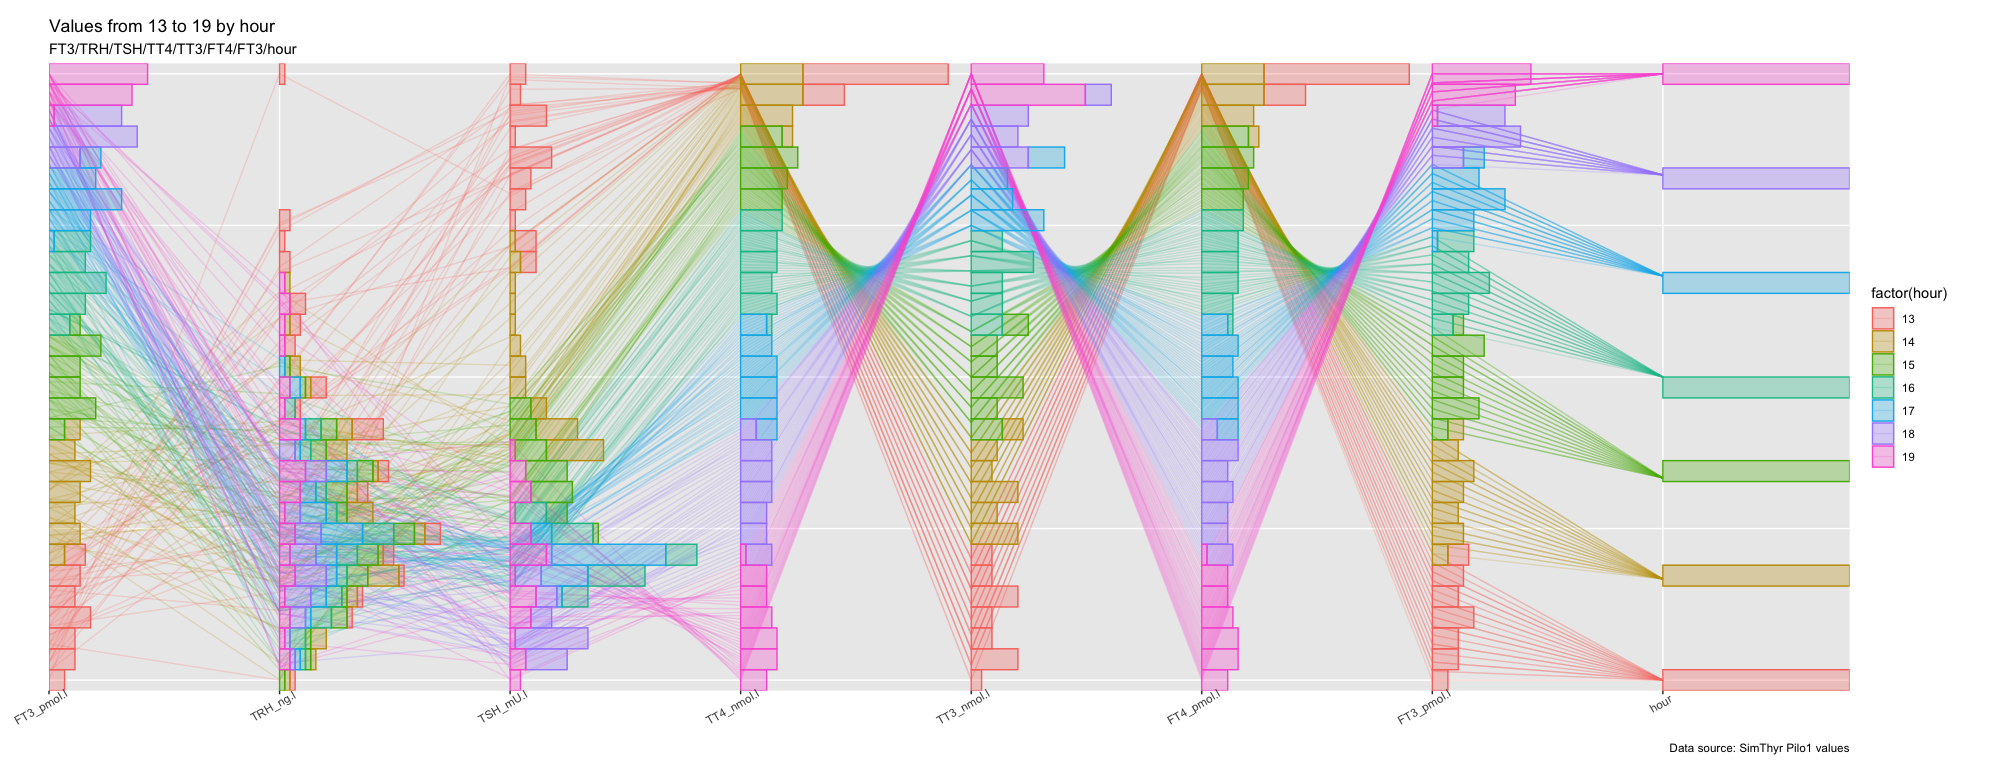
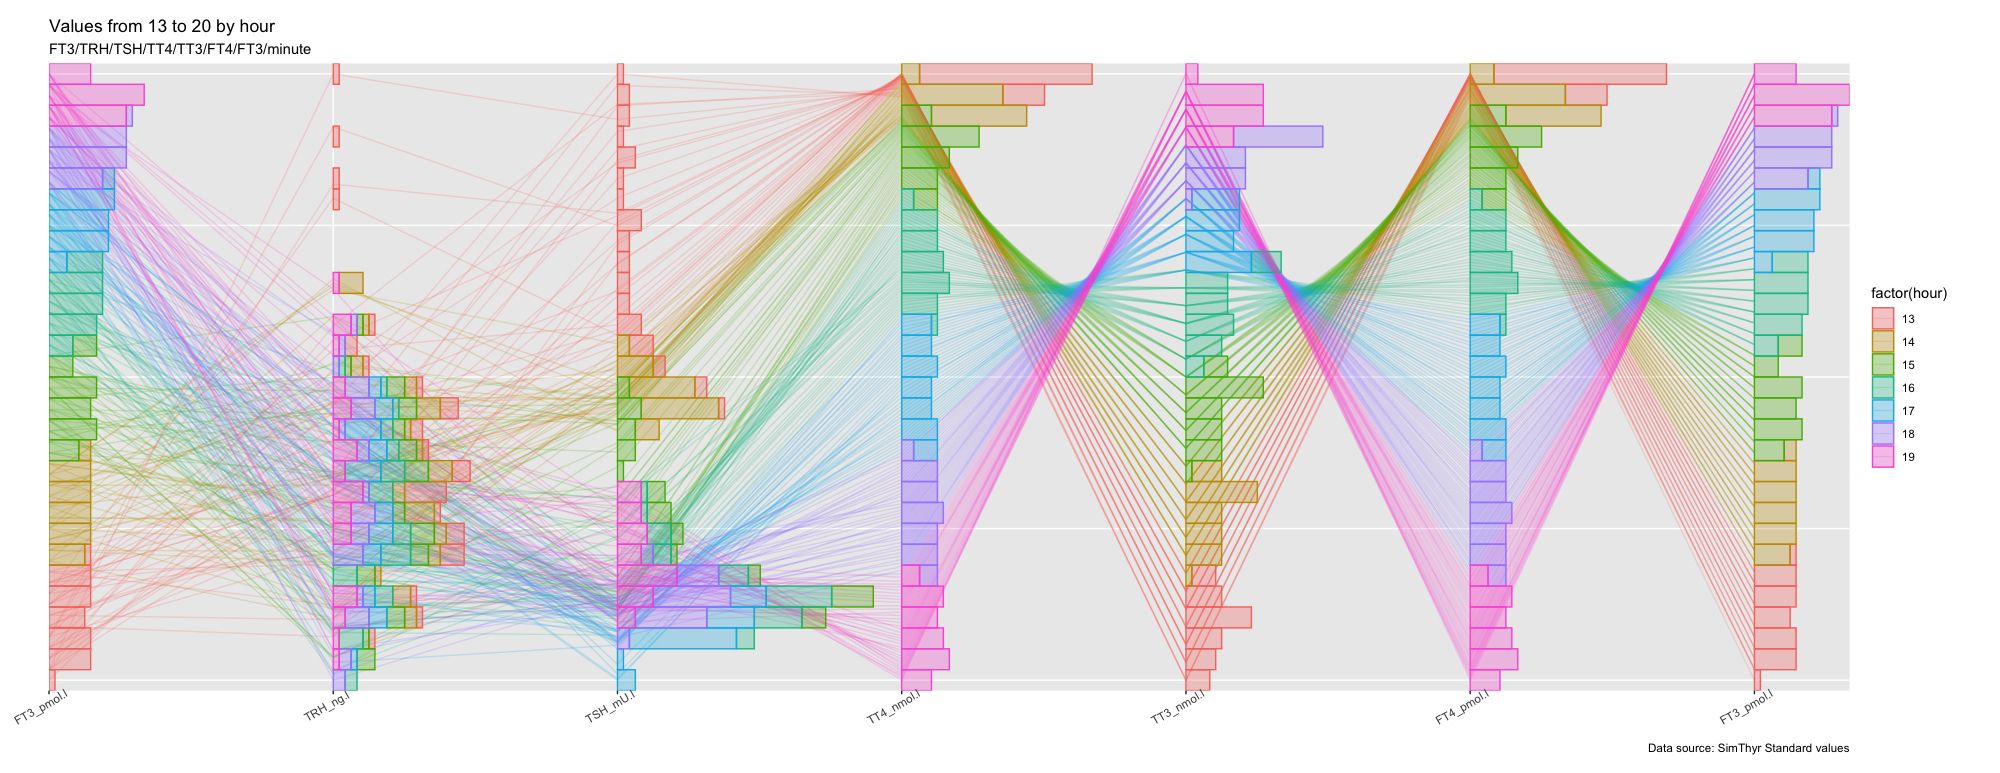
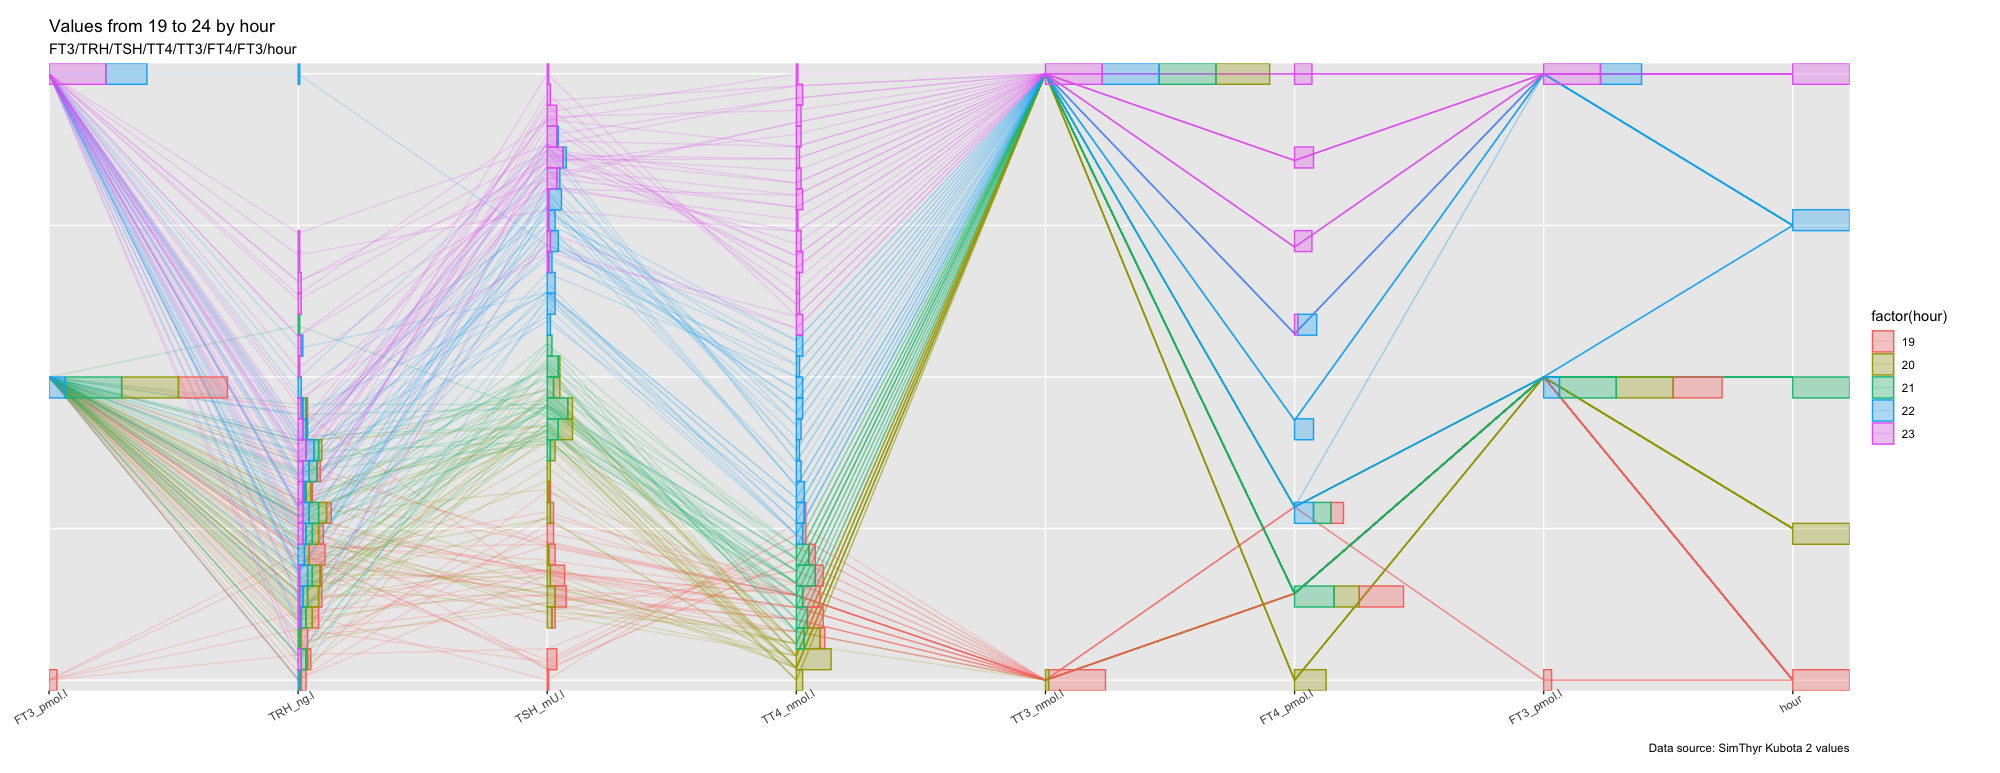
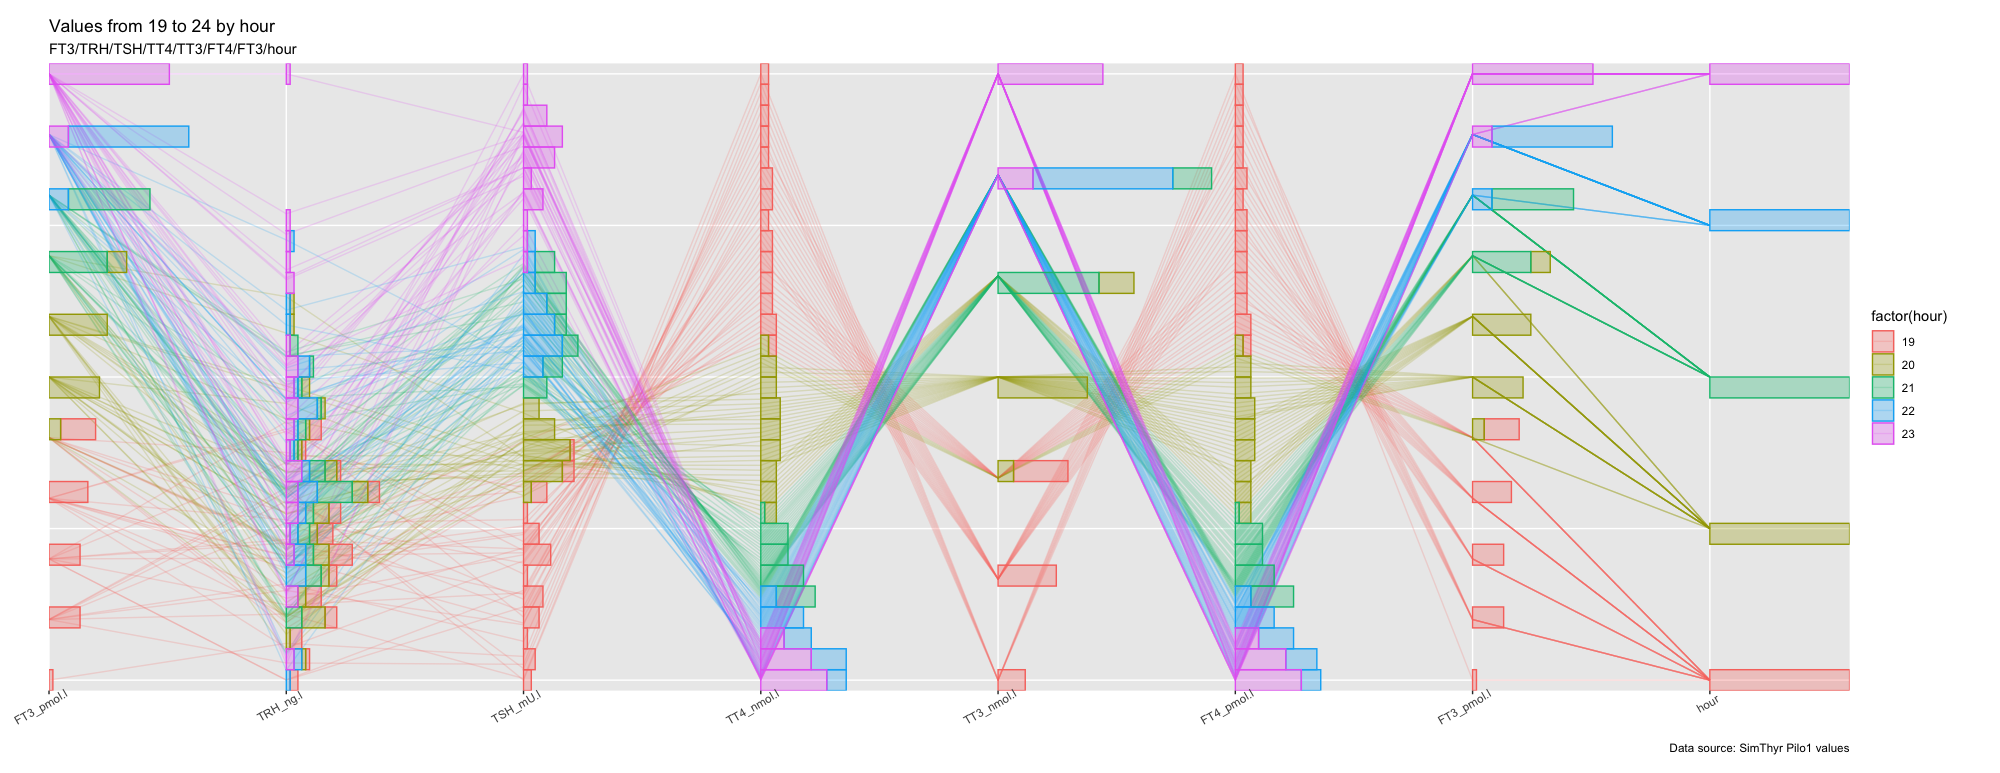
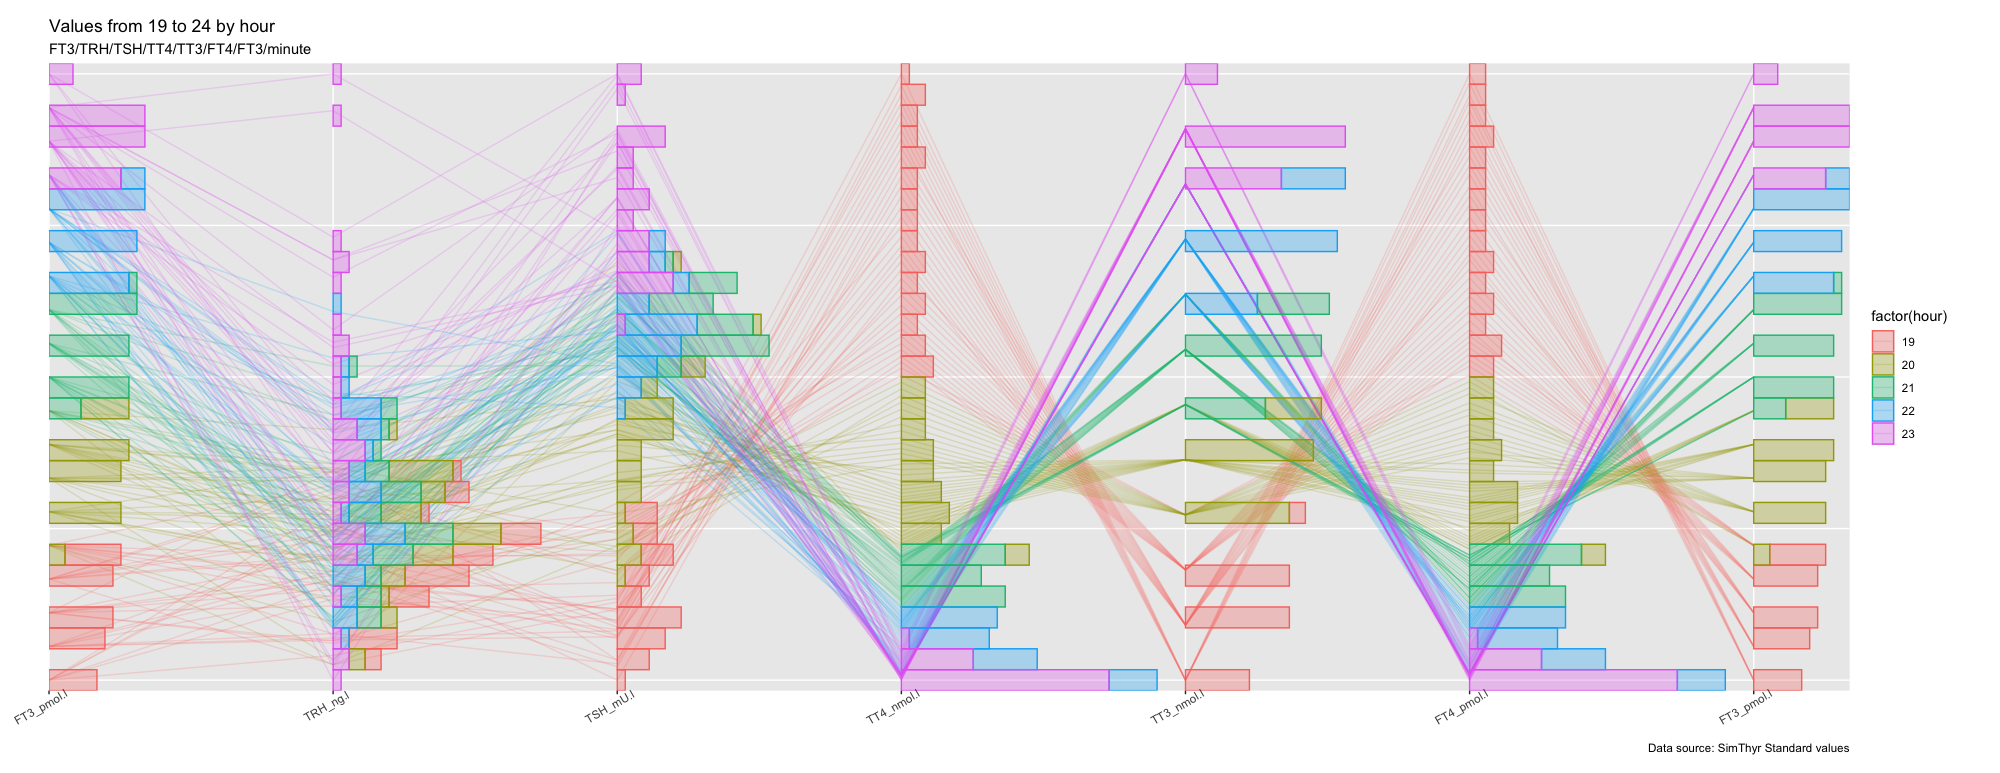
Significance - add to the obvious from these images that FT3/TT3 has a very narrow index compared to TSH. FT3 and TT3 are very stable within the different time periods compared to TSH and TRH.
Novelty - for me it is new how narrow the index for FT3 and TT3 are (In the model). Another pattern from some of the images points out that some advanced mathematics is needed for explaining the torsion seen. See Inselberg below.
This points at a carefull judgement of the free T3 values as the changes may occur in the third or fourth place after the comma.
An animated version of the data you may find here: https://www.glensbo.dk/Simthyr/ ( Google Chrome ok but Firefox/Safari may cause trouble?)
Inselbergs work: http://www.ifs.tuwien.ac.at/~mlanzenberger/teaching/ps/ws04/stuff/auth/00146402.pdf