GH
GH: the secretory capacity of the pituitary
GH
The pituitary receives information TRH from the hypothalamus and sends information TSH to the thyroid depending on the state of T4 and T3 in the body.
GH: the secretory capacity of the pituitary
| TABLE 2. | Decrease GH (/10) | STANDARD FIGURES | Increase GH (*10) |
| TRH | 2500 | 2500 | 2500 |
| TSH | 0,6877 | 1,8 | 5,0176 |
| TT4 | 61,3794 | 121,94 | 198,1946 |
| FT4 | 8,8943 | 17,67 | 28,7197 |
| TT3 | 1,6187 | 3,21 | 5,2267 |
| FT3 | 2,6934 | 5,35 | 8,6966 |
| cT3 | 5937,4311 |
| 18802,5327 |
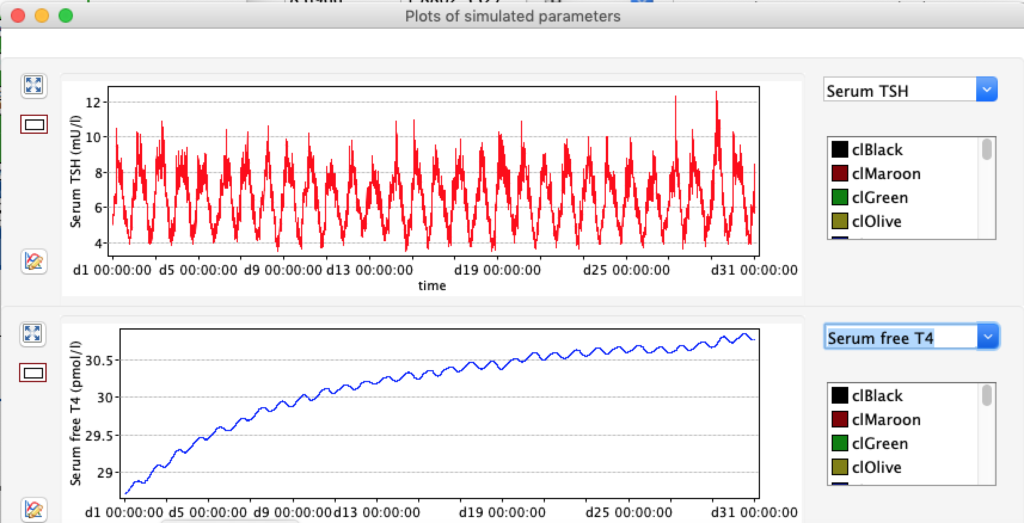
These are the standard curves:
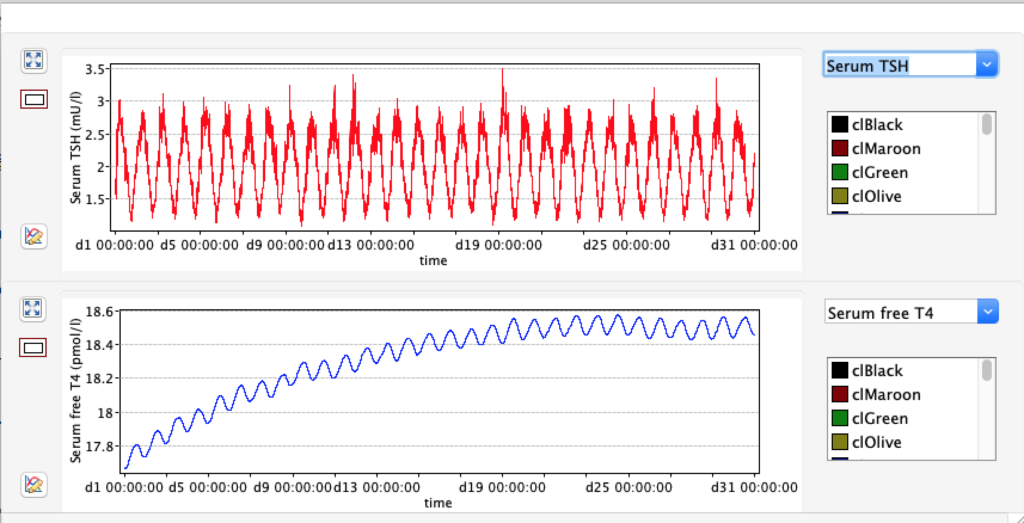

Increased GH increased TSH/T4 and the opposite with the decreased values. It seems as if fT4 despite fluctuations falls slightly over the 30-day simulation