R
Calculations in R
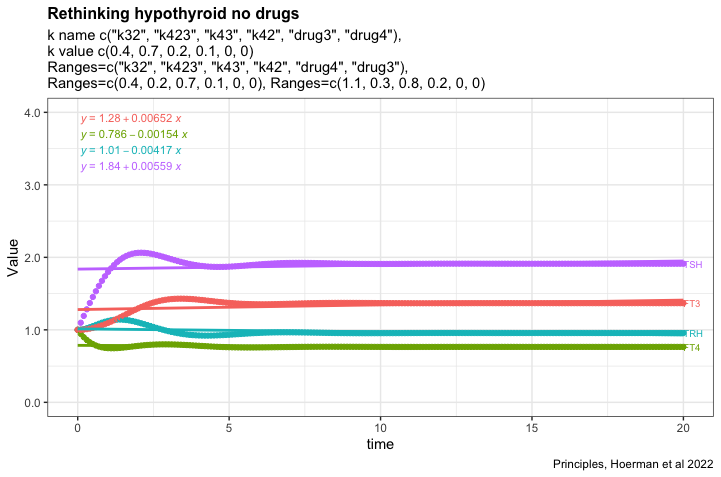
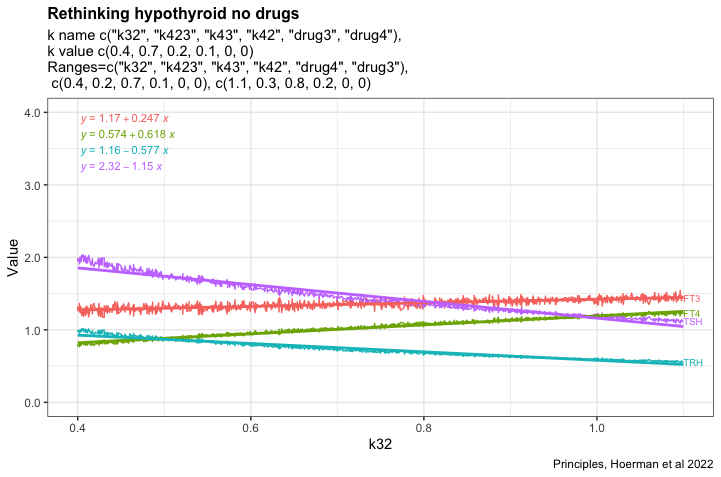
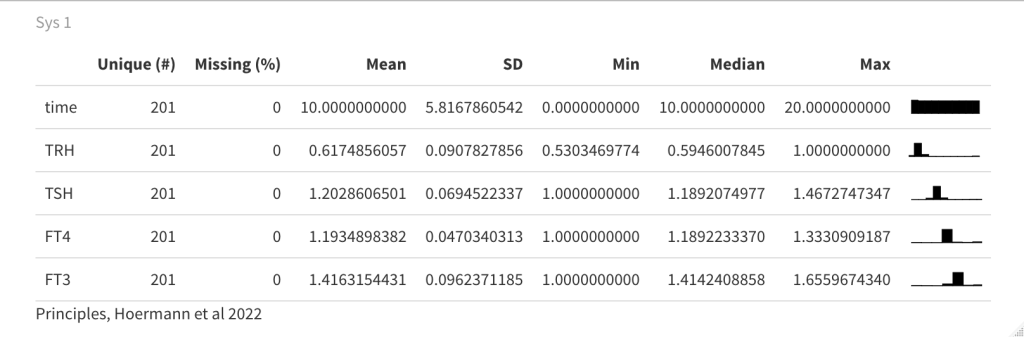
How hypothyroid can it be
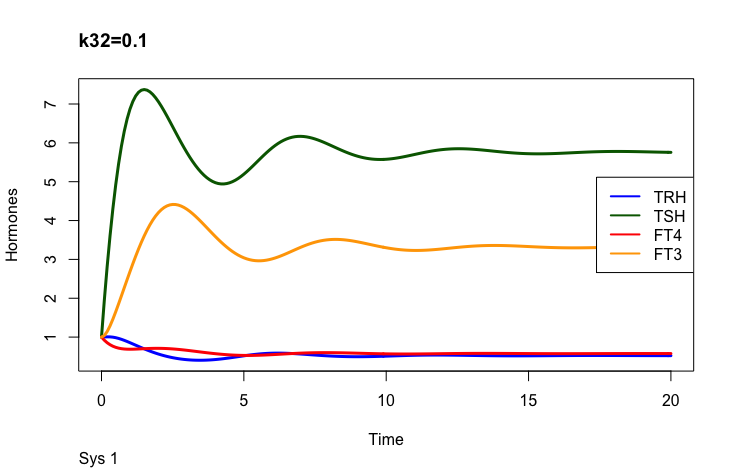
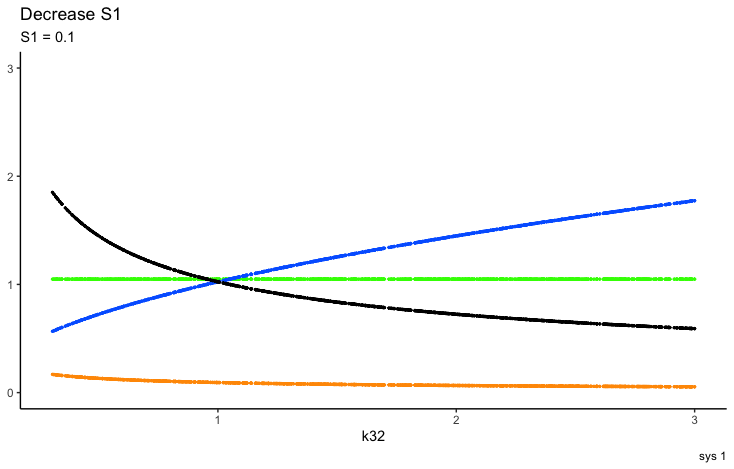
I would like to know how hypothyroid the model can get when the different parameters from fig. 6. A in Principles, Hoermann et al 2022.
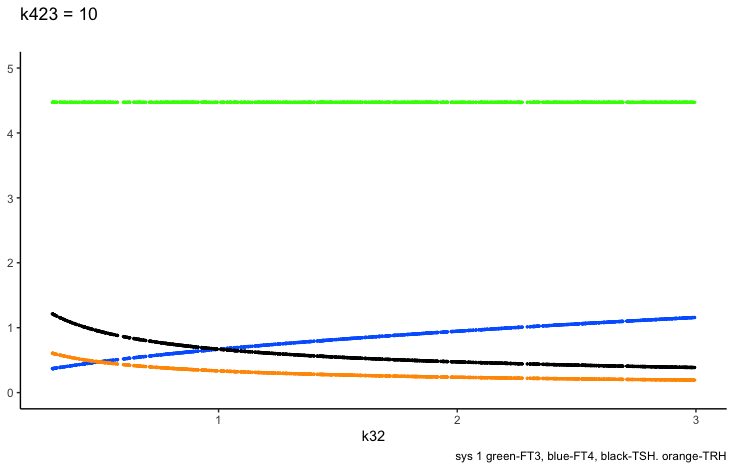
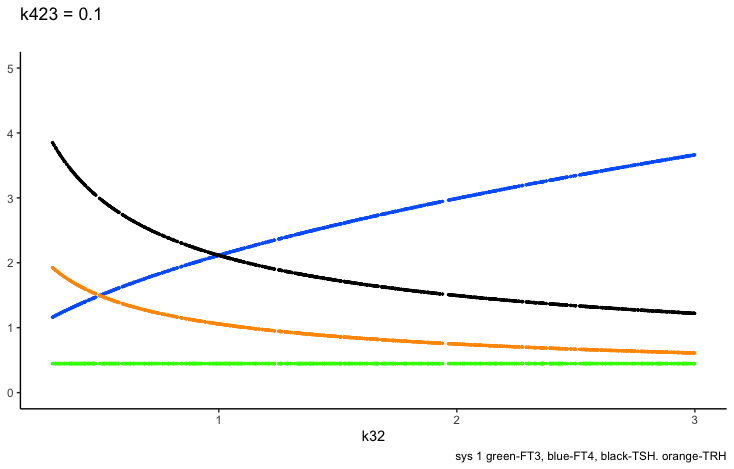
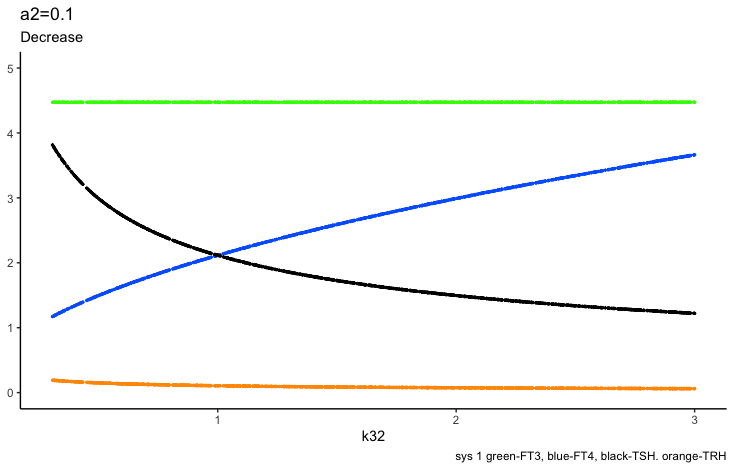
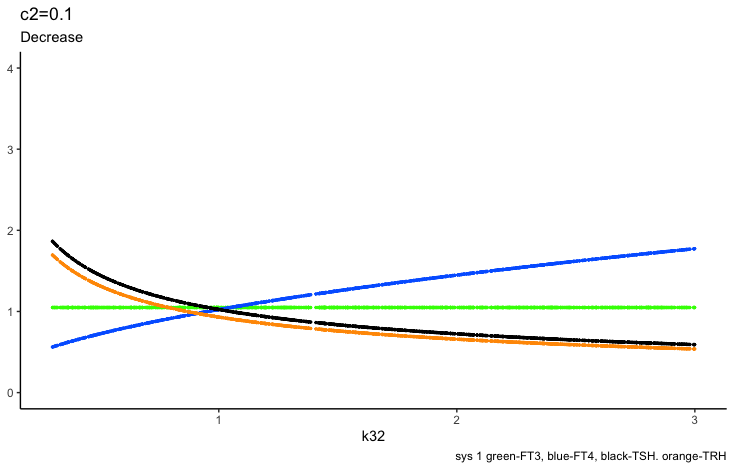
Recap text from fig. 6. A: FT4 levels (blue curve) decline, but the mechanisms in system (sys. 10) protect FT3 levels (green curve), keeping them in a range close to the original level, as the percentage of the estimate of FT4 production rate constant (k32 = 0.4 to 1.1) decreases – as typical at the onset of hypothyroidism in patients suffering from autoimmune thyroiditis and progressive thyroid destruction. Other parameters are chosen within ranges, k423 = 0.2-0.3, k43 = 0.7-0.8 and k42 = 0.1-0.2, to approximate the relative contributions to FT3 production according to (32).
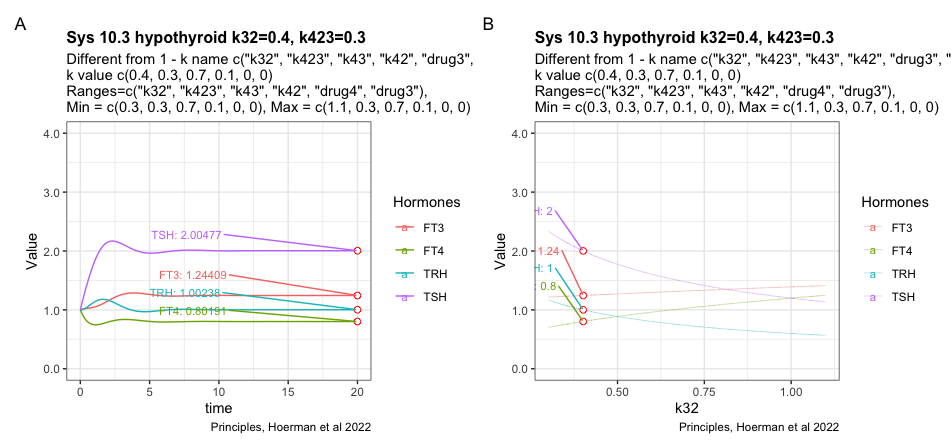
The figures shows the most hypothyroid state the model can achieve under the given conditions.
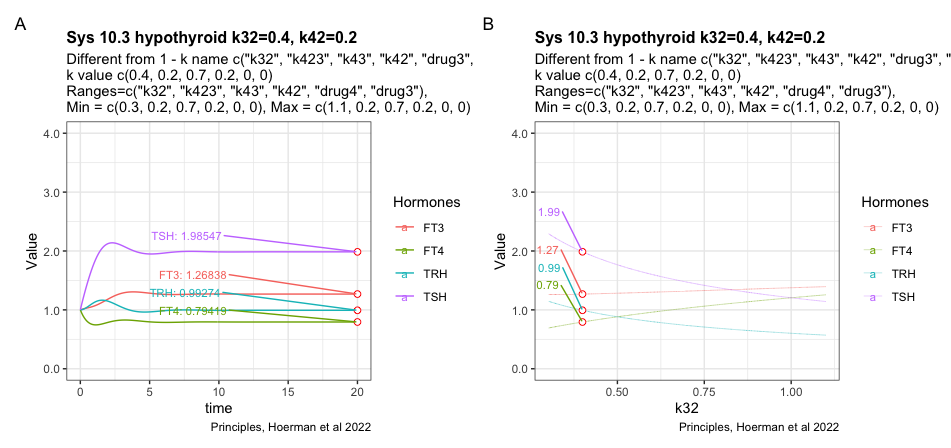
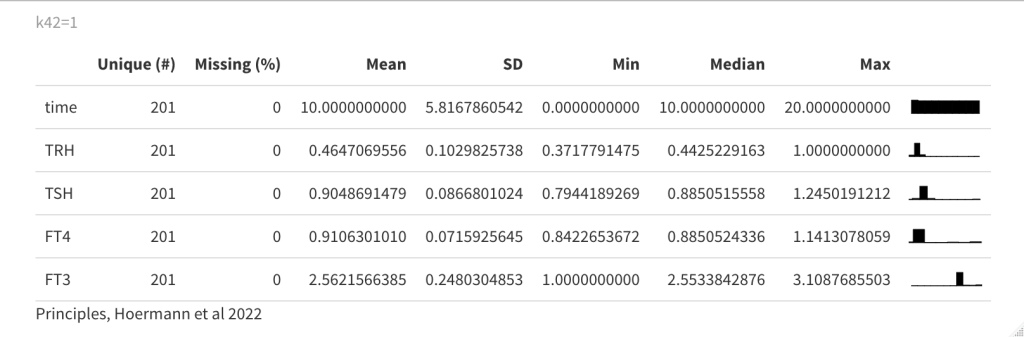
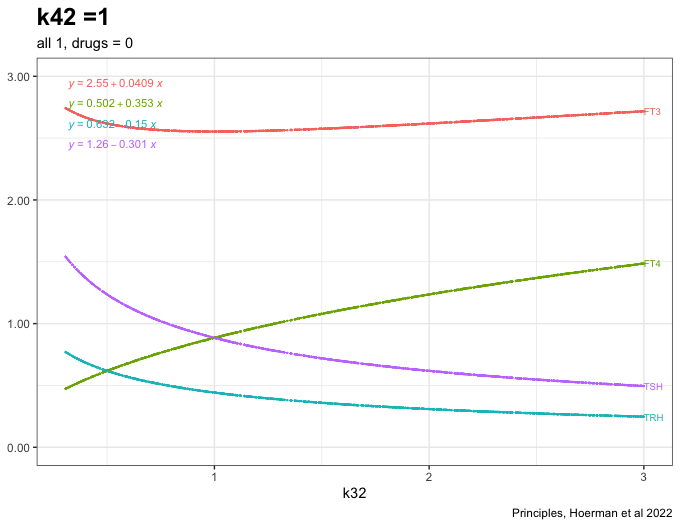
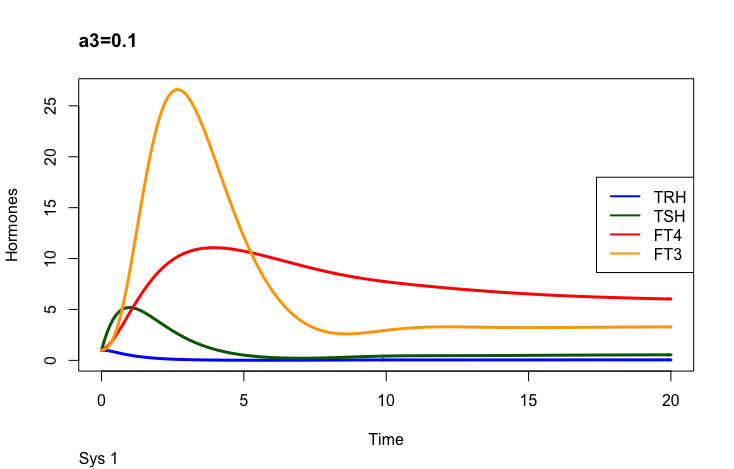
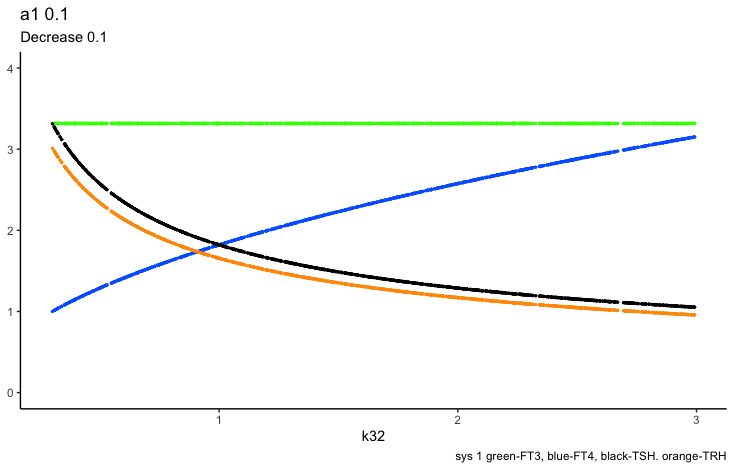
Trying to change the k42 parameter which results in a slight decrease of TSH
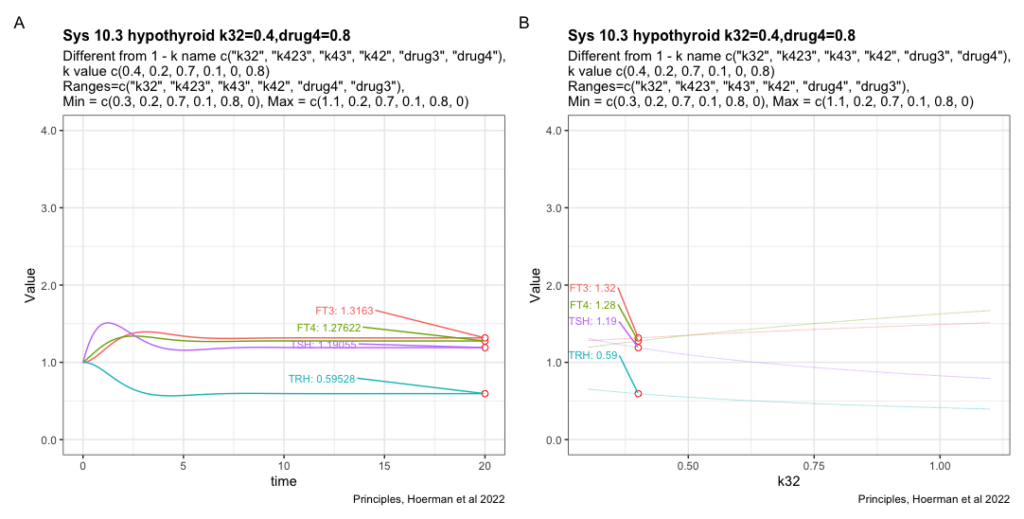
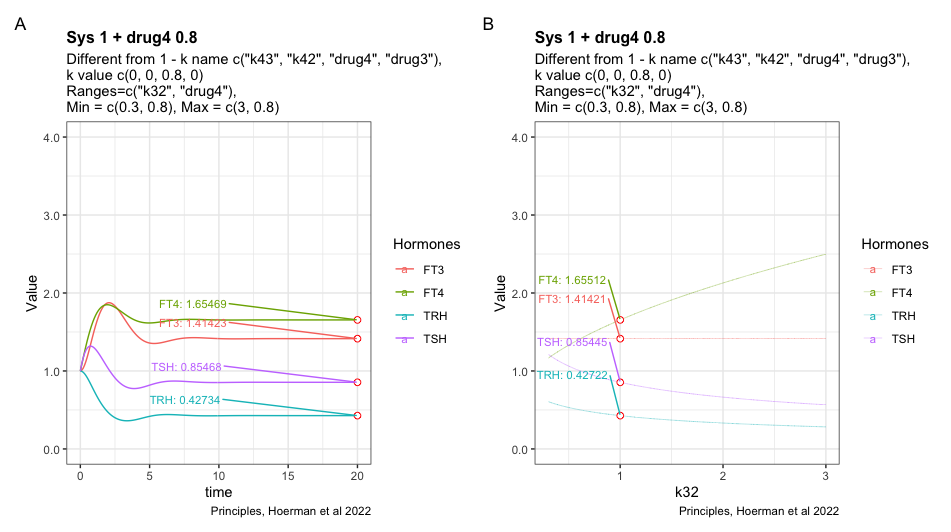
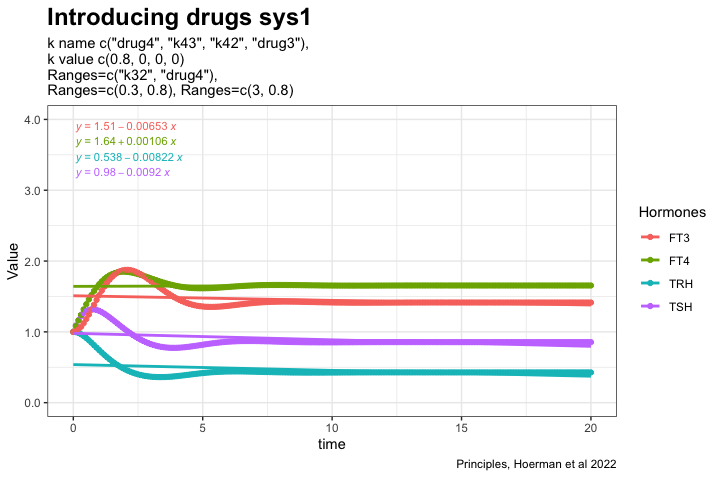
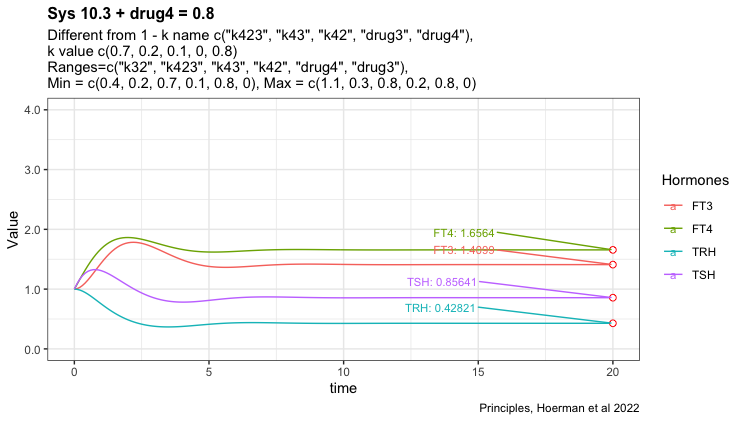
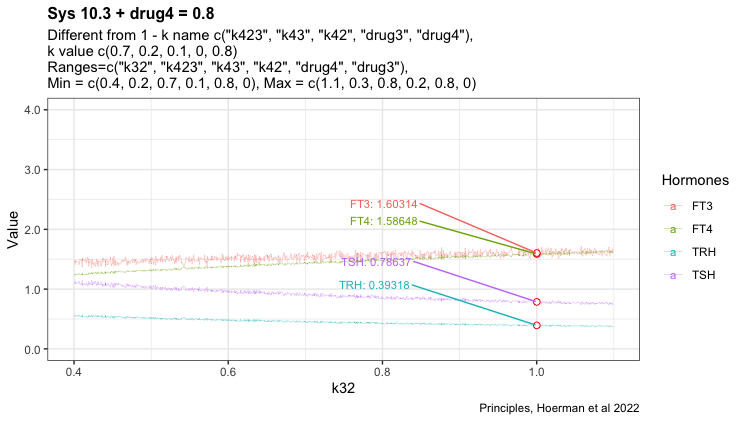
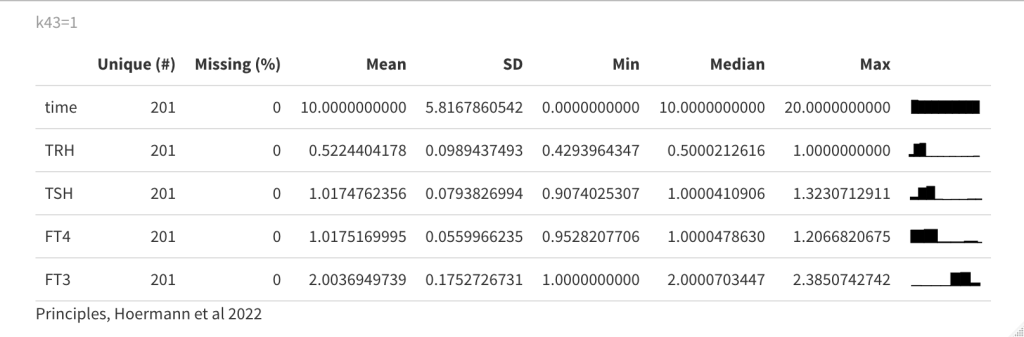
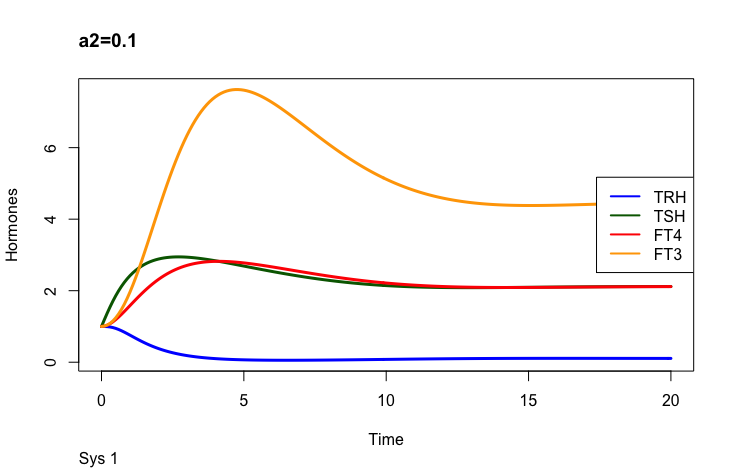
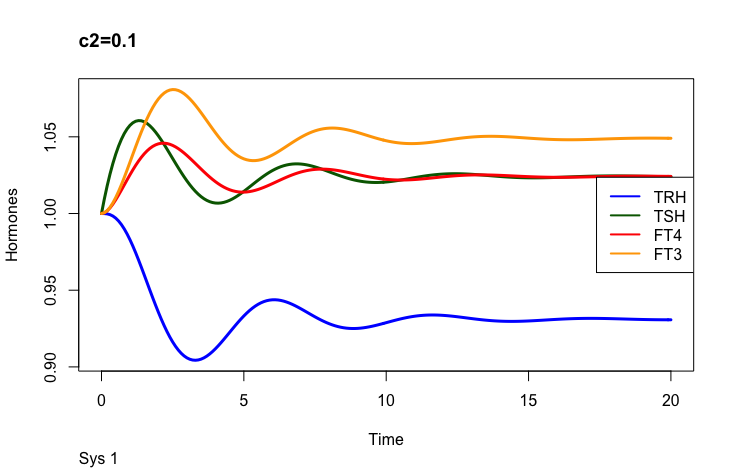
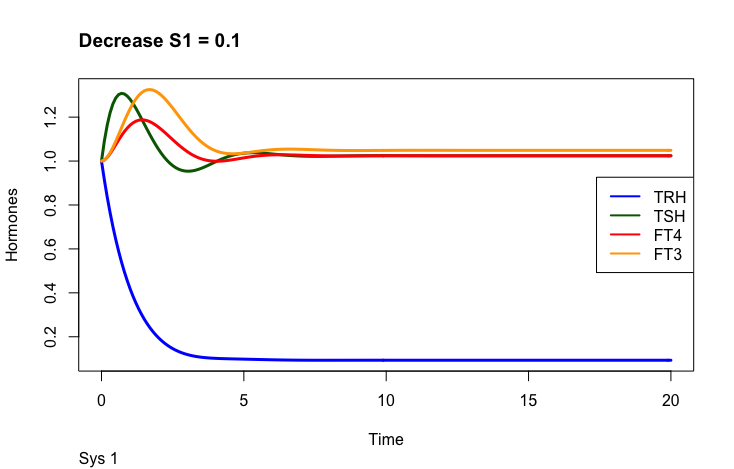
Adding drug4 = 0.8 to the most hypothyroid state. We see FT3 is not returning to the level in the perfect homeostasis. See sys1 below. Apart from that FT3 drops with lower k32.
Here I have tried to show the pattern following perfect homeostasis plus drug4. Mimicing the situation where a patient gets unnecessary LT-4 treatment. Will it be possible to identify the pattern and use it to get the patient off LT-4? Is the pattern disguised by the transformation to real hormone values?
Rethinking Hypothyroidism + Principles of Endocrine Regulation
These plots are based on a theoretical model developed by Hoerman et al 2022. The changes in the figures are mine and not discussed with the creators – so I and not the authors are to blame for any error. I would like to show two citations from Rethinking Hypothyroidism, written by A. Bianco.
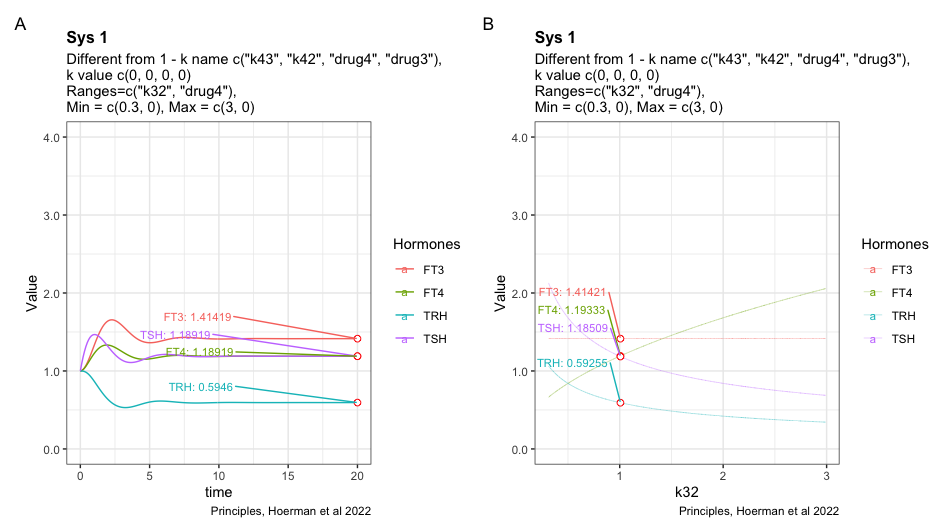
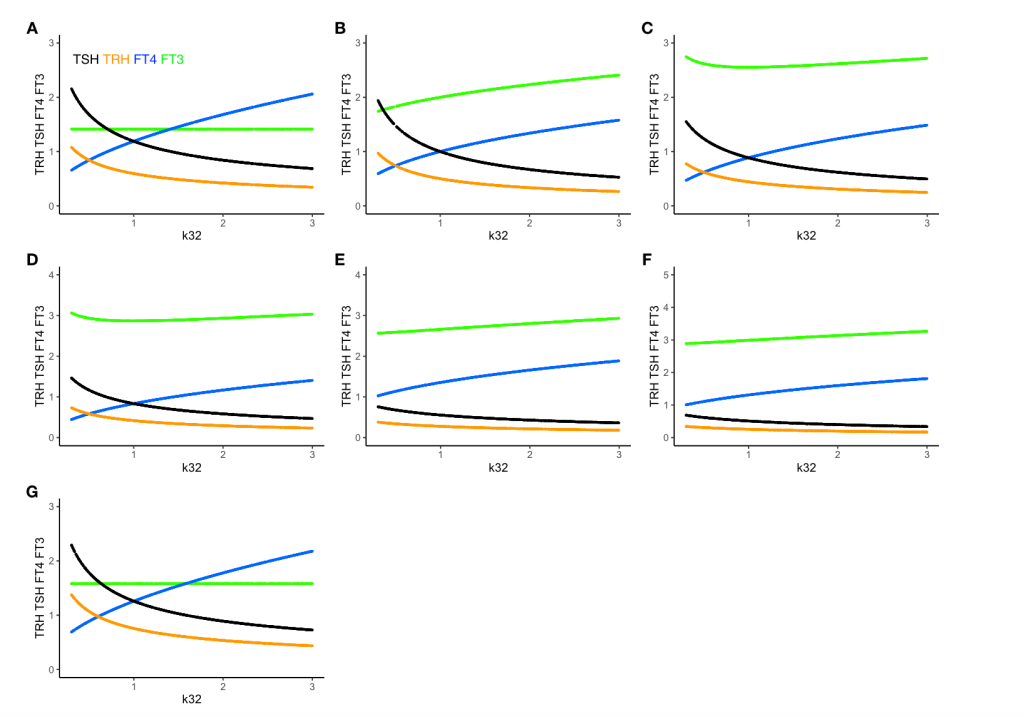
These two plots illustrate perfect homeostasis
Here I have added L-T4 to the perfect homeostasis illustrating the hormone pattern in a situation where there is no need for L-T4. The gap between TSH/FT4 widens. (~1/3 is getting unnecessary L-T4 treatment. From Rethinking Hypothyroidism, A. Bianco 2022)
- TSH decreases
- FT4 increases
- FT3 increases
Introducing a hypothyroid pattern – TSH increases
L-T4 is added to the hypothyroid pattern and we see that L-T4 treatment is not restoring FT3 although TSH is normalized. ( “Once TSH had normalized, the metabolic rate had not,” from Rethinking Hypothyroidism, A. Bianco 2022)
Is it possible to identify those patients who are not hypothyroid but is treated with L-T4 by the changed hormone pattern? In the perfect homeostasis scenario, the ratio FT4/TSH is close to one whereas in the perfect homeostasis with added LT4 the ratio looks close to 1.5. In the L-T4-treated hypothyroid pattern, the ratio is a little above one.
Will converting the hormone figures to standard values obscure the pattern?
Perfect homeostasis
In the article: “Principles of Endocrine Regulation: Reconciling Tensions Between Robustness in Performance and Adaptation to Change.” (Ref.1) the authors describe how their mathematical model can describe perfect homeostasis. The patterns of TRH, TSH, FT3 and FT4 are plotted. The FT3 value is preserved whatever changes in the other hormones.
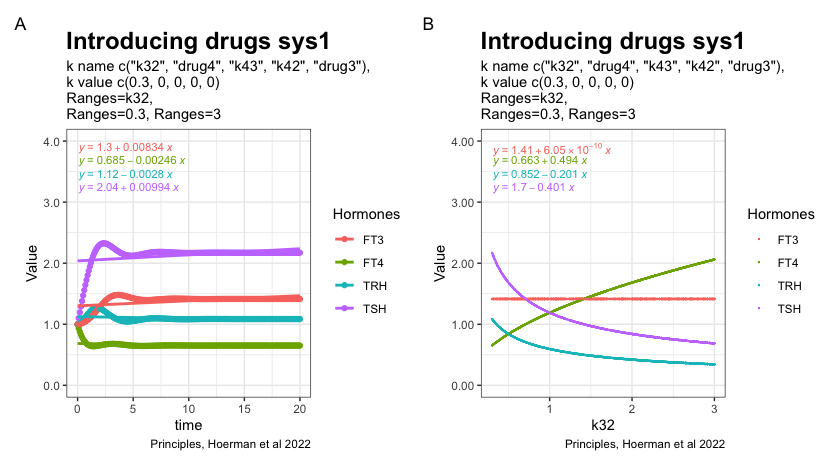
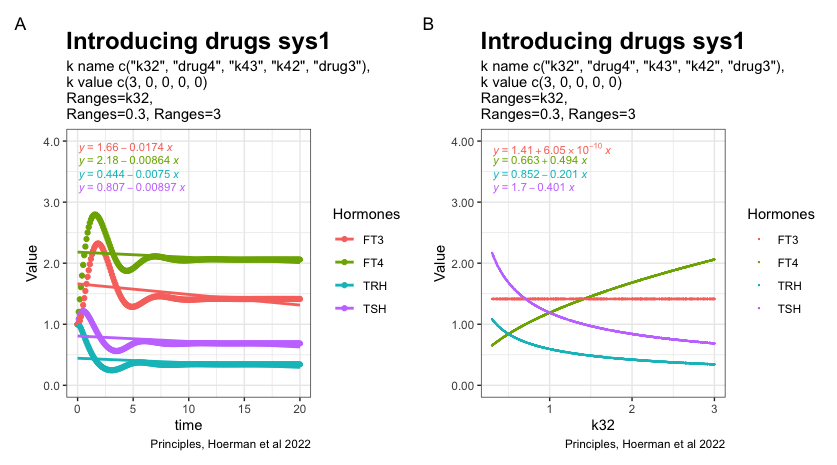
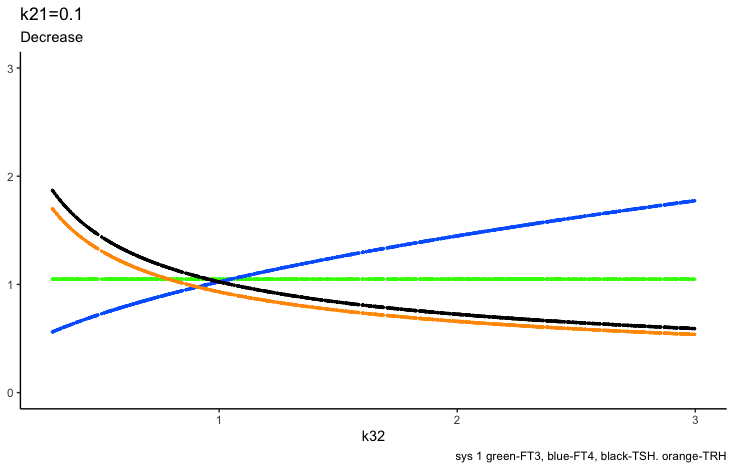
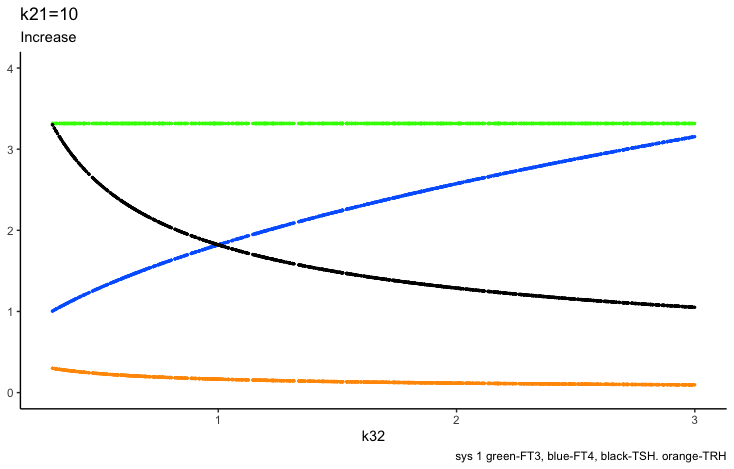
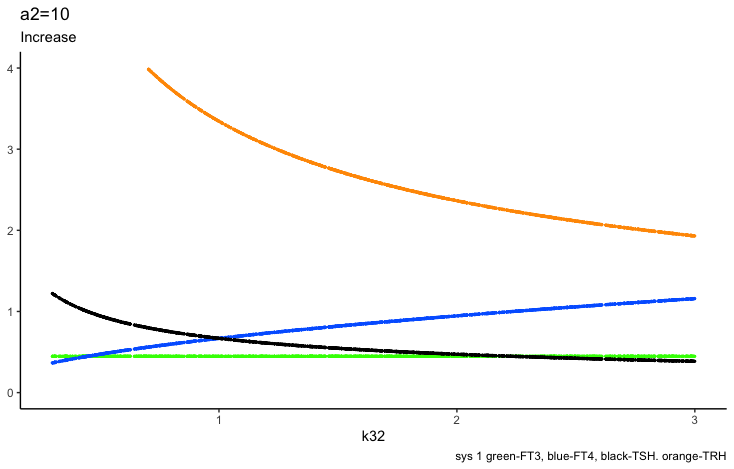
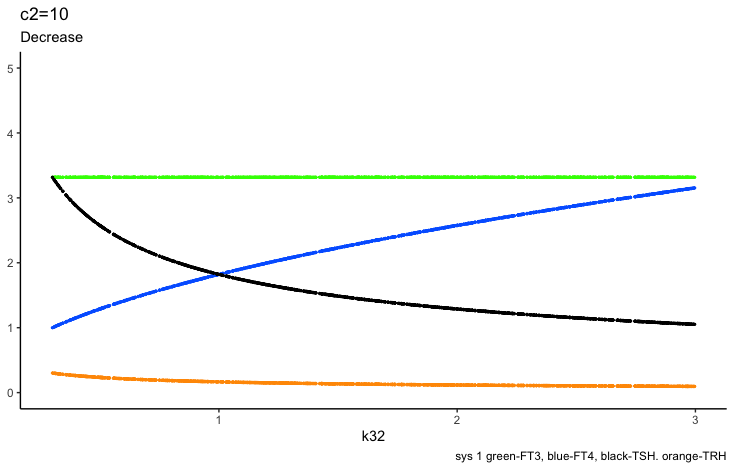
In the next two plots, the K32* is changed to 0.3 and 3. Changes in the patterns between the three hormones TSH, FT4 and TRH.
Redefinition of FT3 reference ranges?
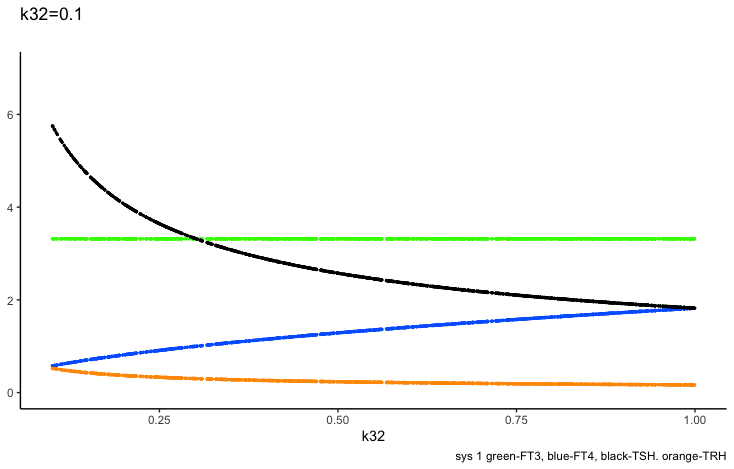
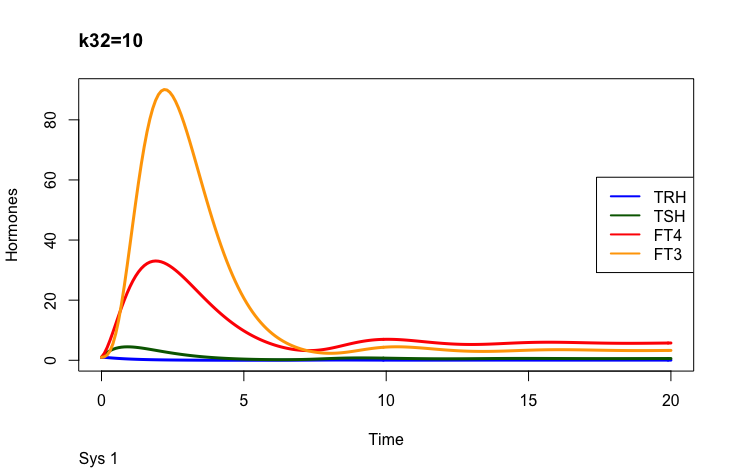
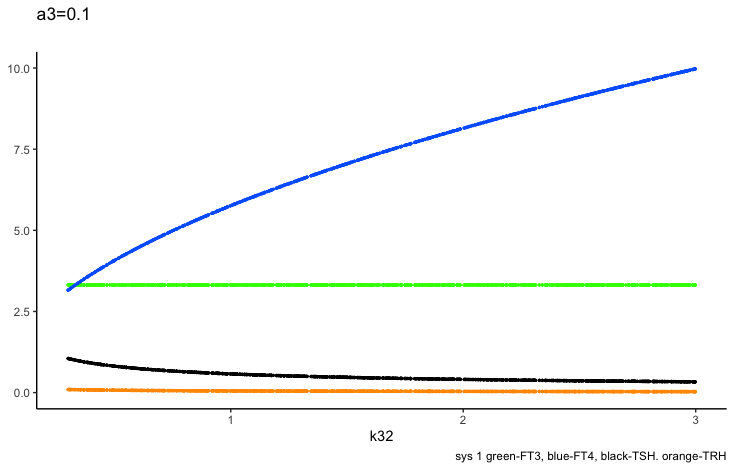
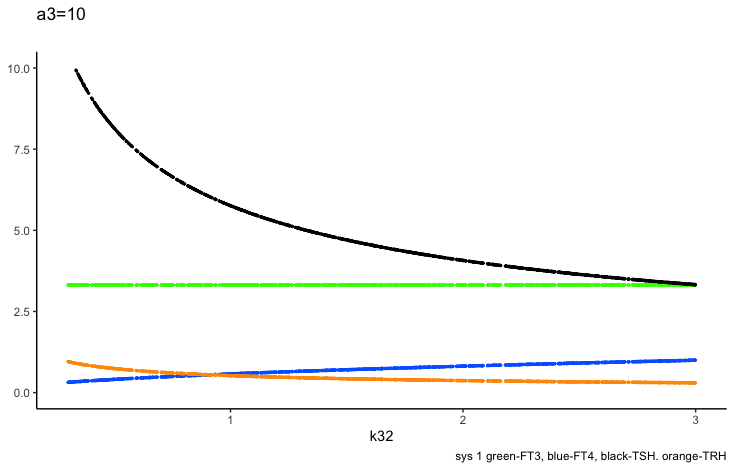
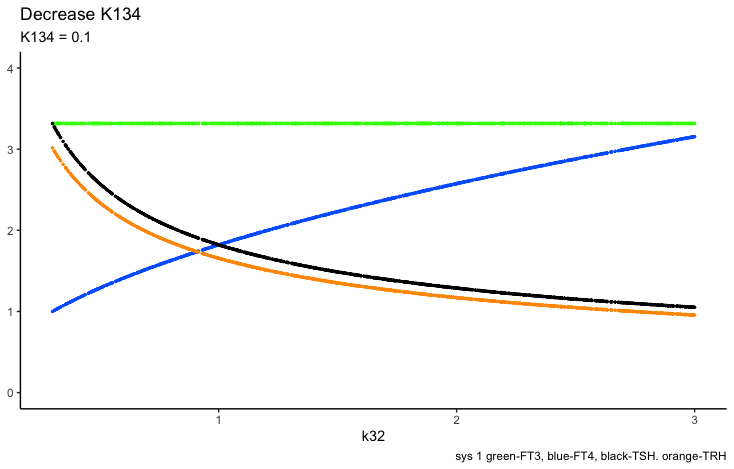
k32
The FT4 production rate parameter k32 is the proportionality constant,
positive feedforward of TSH onto FT4 (downstream, activating (short red arrow)).
FT4 increases as k32 increases and TRH-TSH decreases (due to the negative feedback k134 and k234 (green and blue bars)
- Hoermann R, Pekker MJ, Midgley JEM, Larisch R and Dietrich JW (2022) Principles of Endocrine Regulation: Reconciling Tensions Between Robustness in Performance and Adaptation to Change. Front. Endocrinol. 13:825107. doi: 10.3389/fendo.2022.825107 https://www.frontiersin.org/articles/10.3389/fendo.2022.825107/full
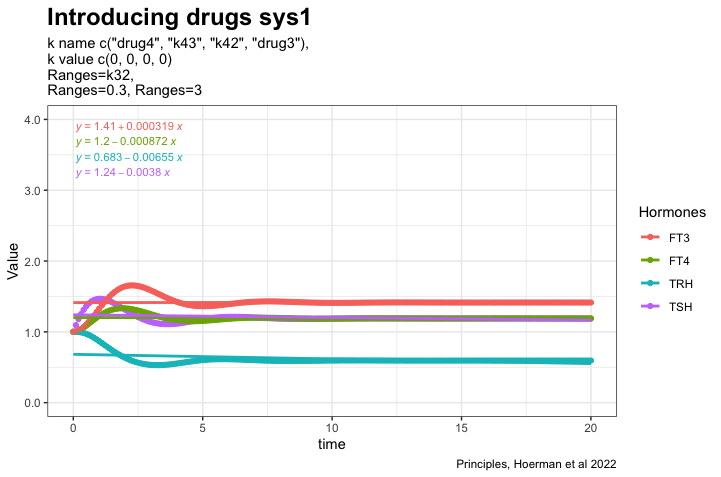
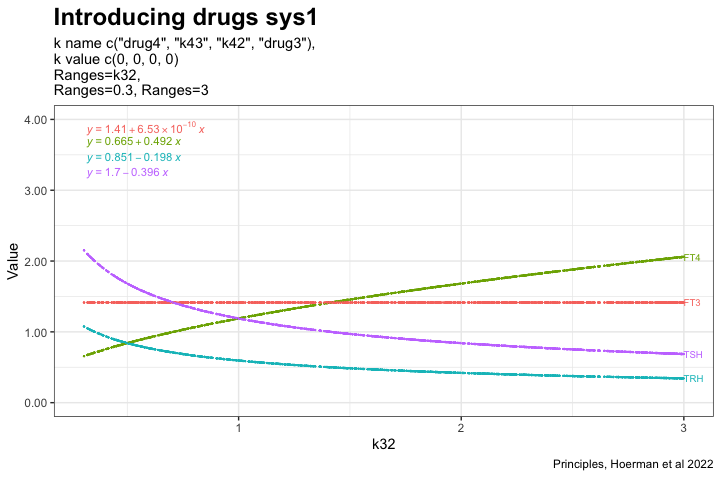
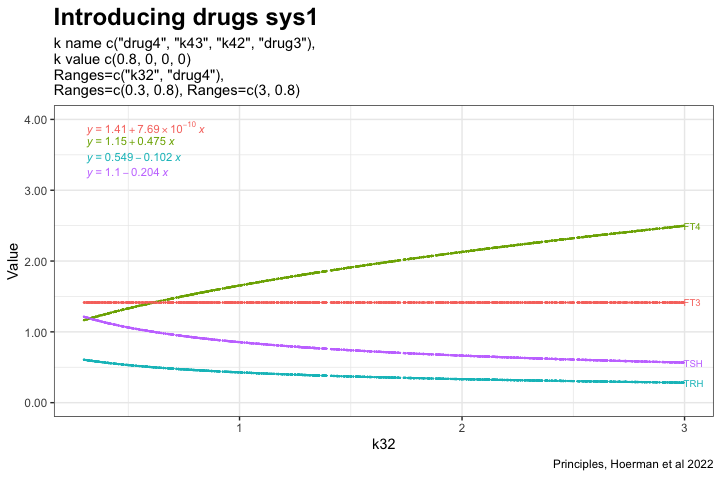
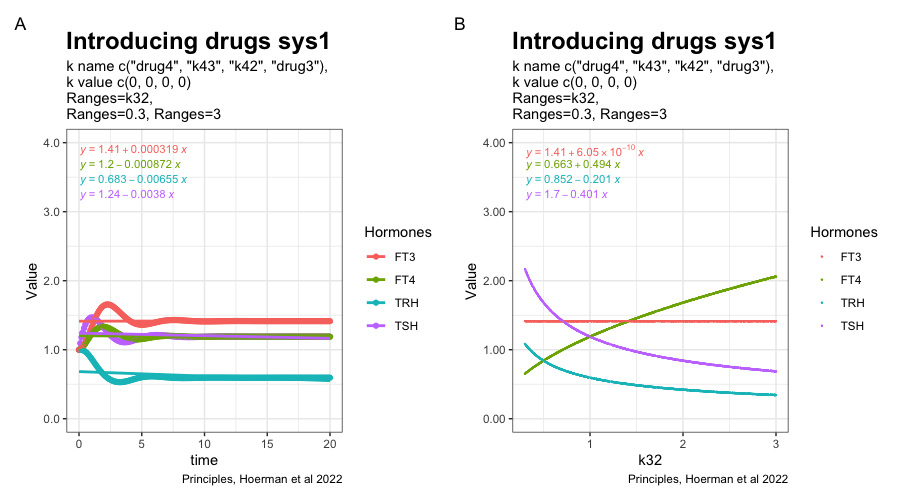
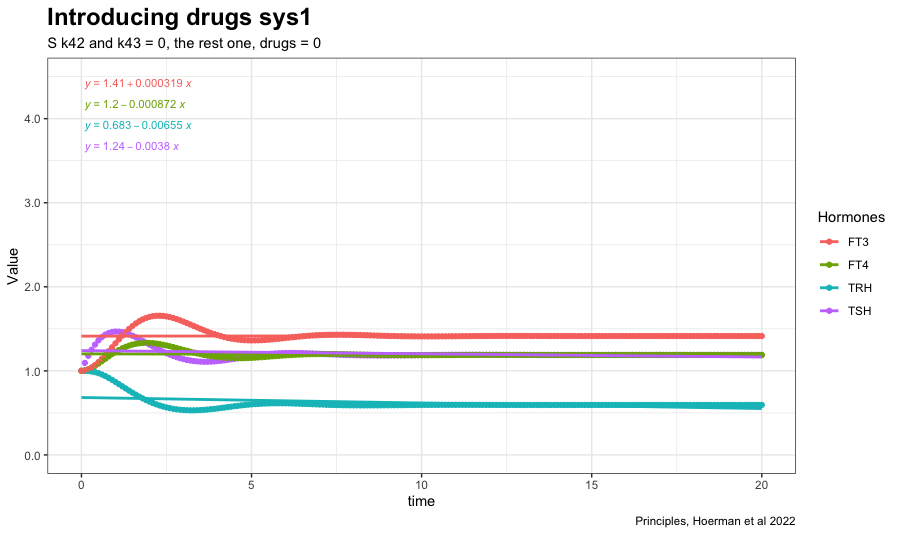
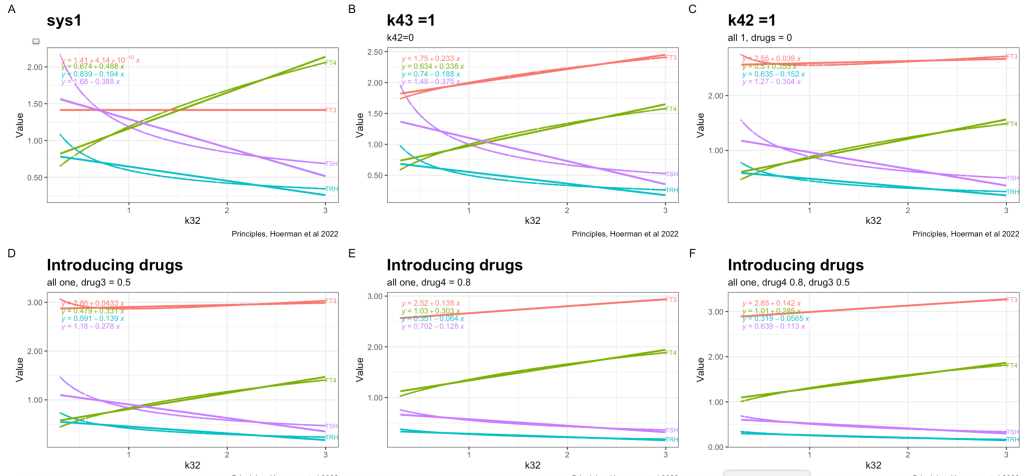
Introducing drugs – 1
All comments here are all theoretical and based on a complicated mathematical model.
Proceeding from page 10 in the supplementary material for:
Hoermann R, Pekker MJ, Midgley JEM, Larisch R and Dietrich JW (2022)
Principles of Endocrine Regulation: Reconciling Tensions Between Robustness in Performance and Adaptation to Change.
Front. Endocrinol. 13:825107. doi: 10.3389/fendo.2022.825107 – I look at the two equations for sys1 and multiple systems.
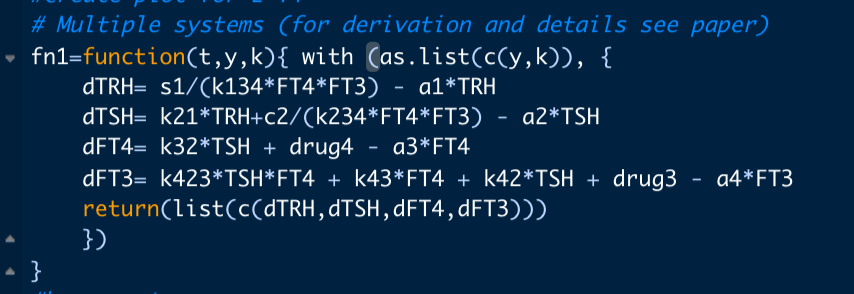
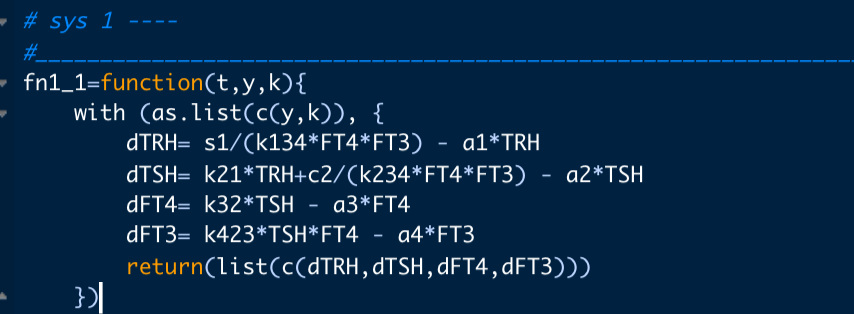
The two parameters k43, k42, drug4 and drug3 are set to zero in the multiple systems equation. Making the result of the two equations the same. This equals fig. 4a in the article.
In sys. 9 k43 is changed to 1. (k43 increases the FT3 production rate // the FT3 production rate constant of peripheral organs account for non-thyroidal peripheral FT3 production (by adding the term k43*[FT4]) which physiologically depends on FT4, but not on TSH). See fig. 4b in the article.
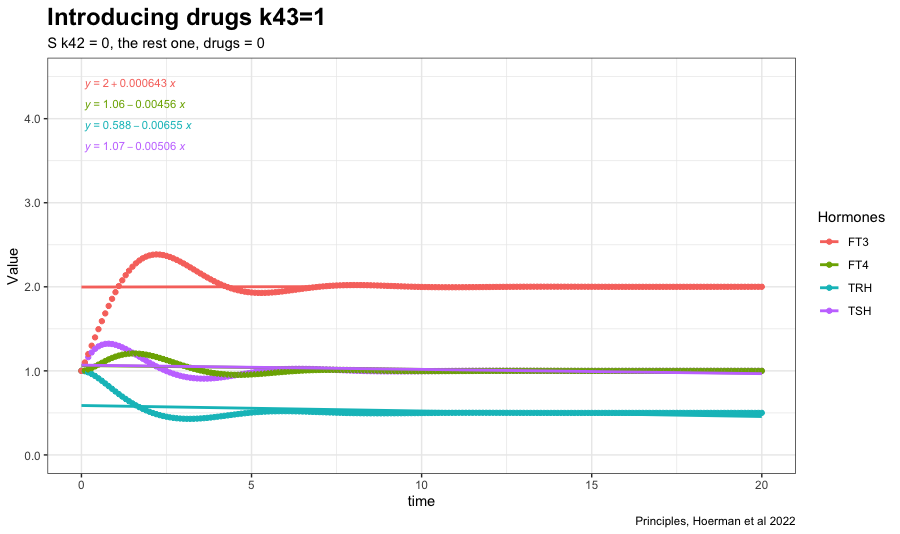
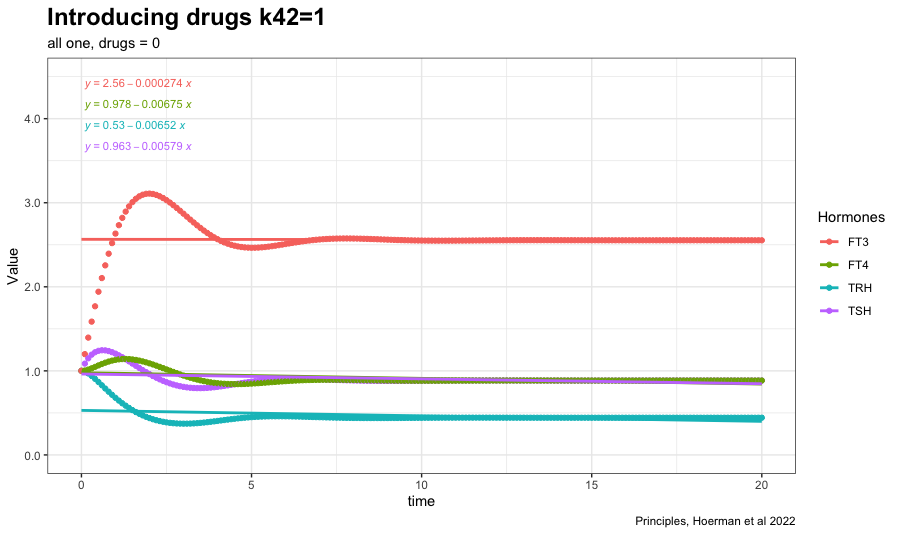
Changing k42 to one increases FT3 further. (The TSH feedforward on FT3 is switched on (k42 = 1)). The other hormones decreases. The TSH FT4 values follow each other closely. See fig. 4c in the article.
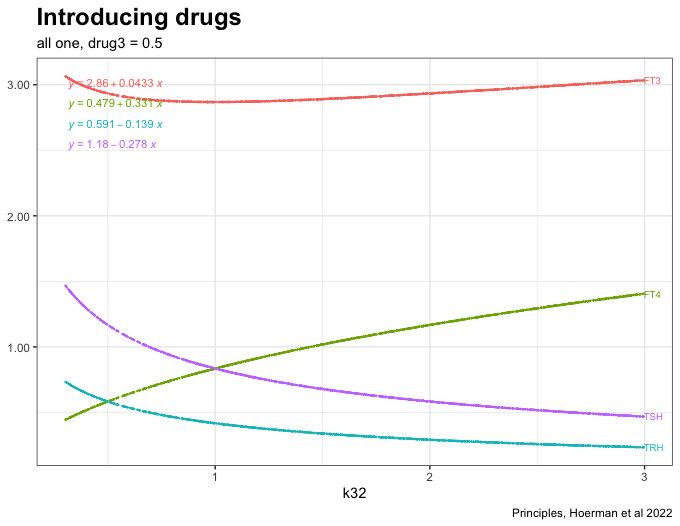
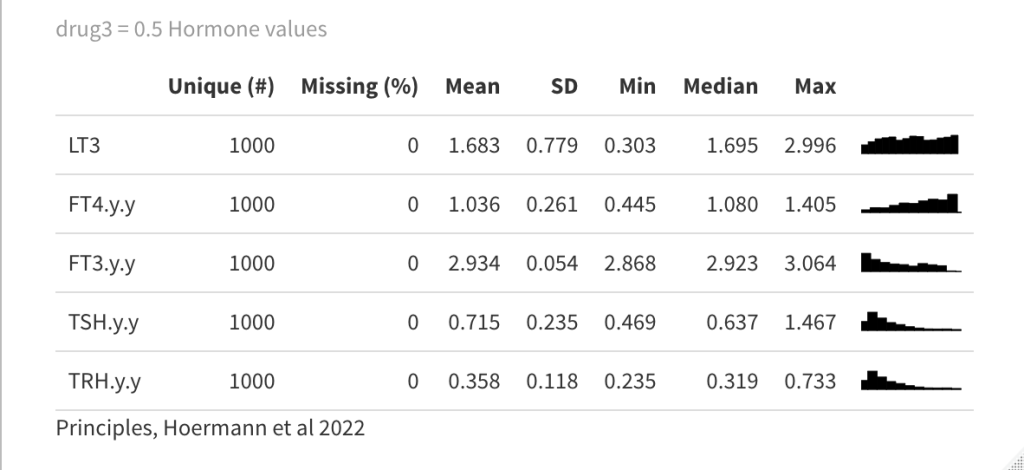
Now a drug is introduced (drug3=0.5) in the equation which gives the following result:
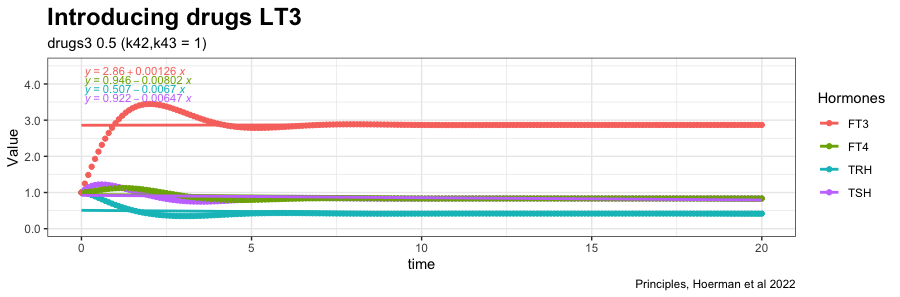
See fig. 4d in the article and the comments.
In the next plot drug3=0.5 (LT3) is replaced by drug4=0.8 (LT4) in the equation, which affects the TSH and FT4 values:
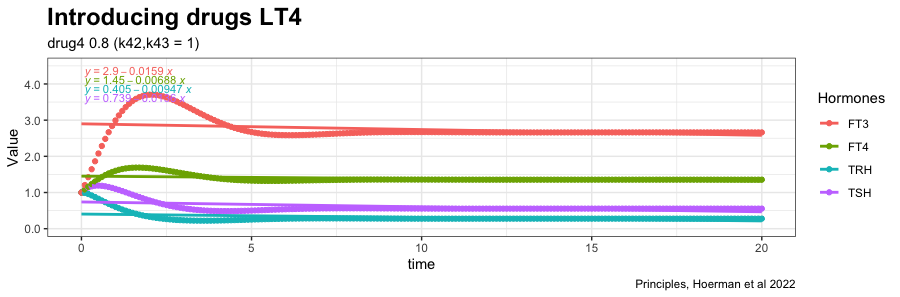
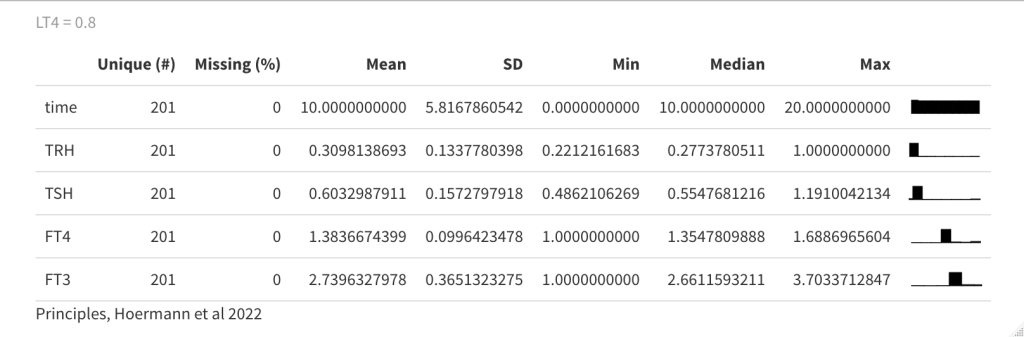
The distance between FT4 and TSH is increased. In the earlier plots, FT4 and TSH were almost in the same line with no spread.
Next, I will reproduce fig. 4 from the article as a test of the R-script:
The FT4 production rate parameter k32, is the proportionality constant positive feedforward of TSH onto FT4 (downstream, activating)
FT4 – 0.50
TSH – 1.28
TRH – 0.62
FT4 – 0.48
TSH -1.18
TRH – 0.59
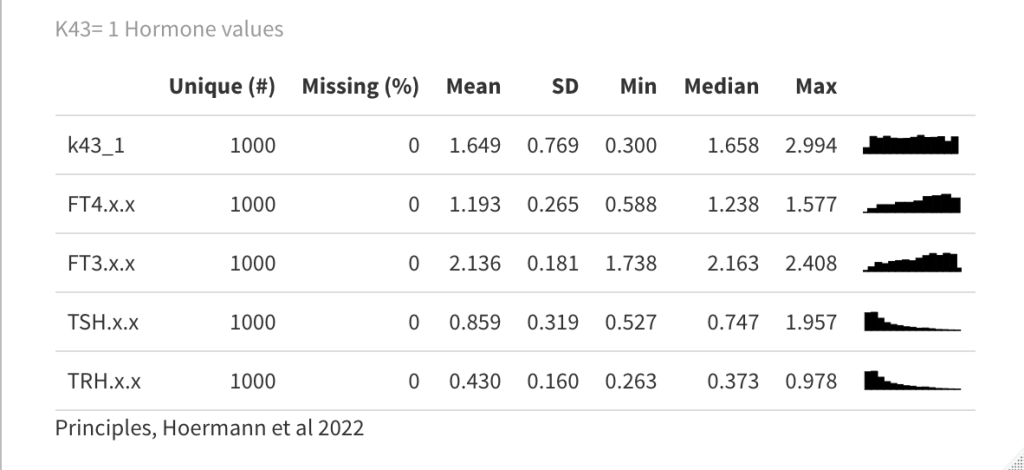
Principles: FT3
Two parameters may change the value of FT3 in the mathematical model (Ref.1);
k423 – positive feedforward of TSH and FT4 onto FT3 (downstream, activating)
a4 – the FT3 elimination rate constant.
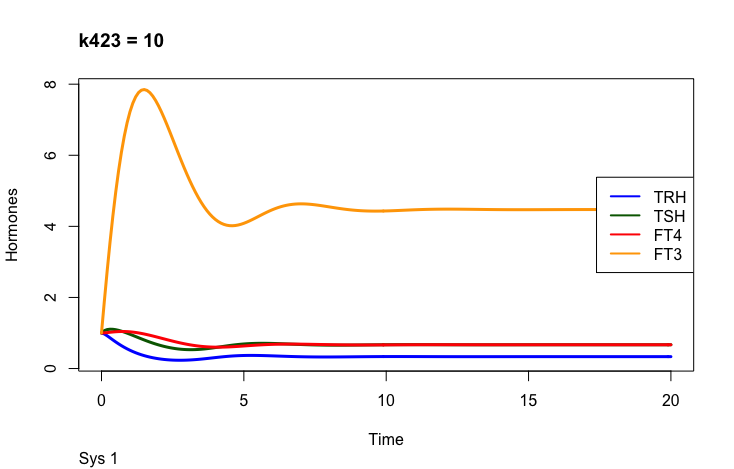
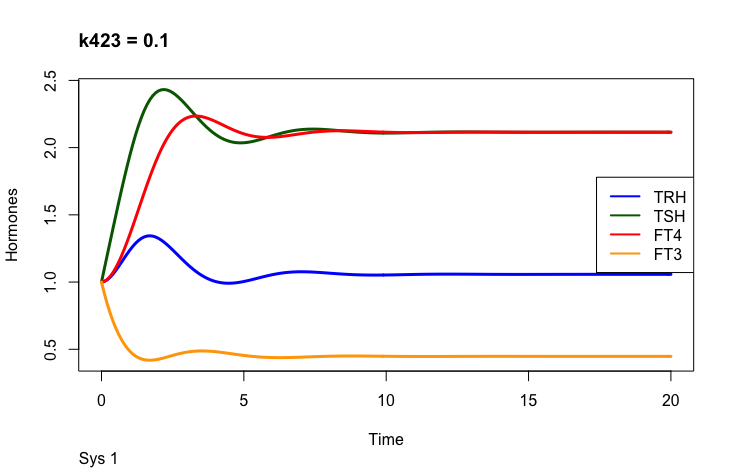
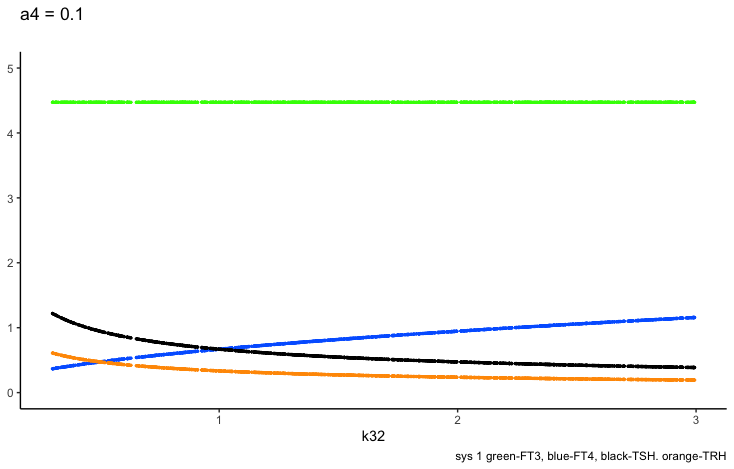
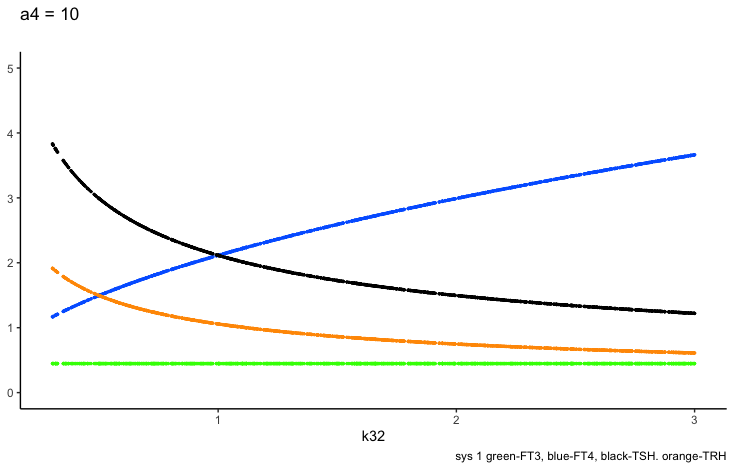
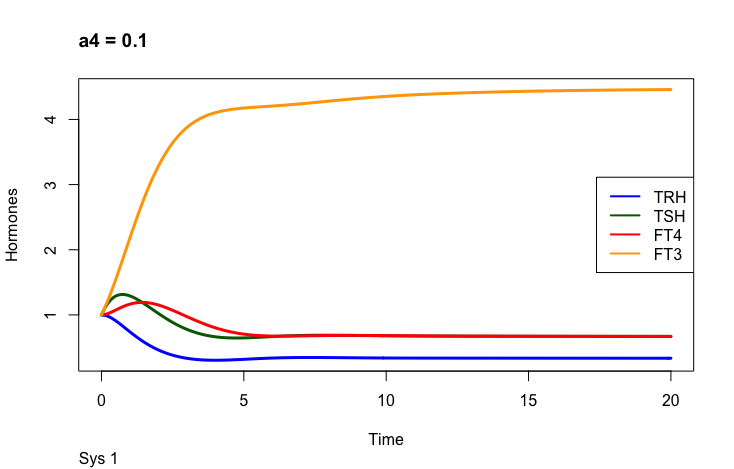
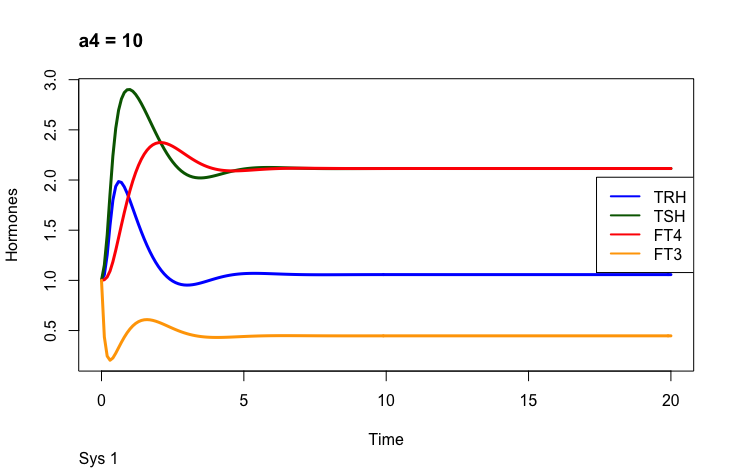
Only examples of the effect of the parameter –
- Hoermann R, Pekker MJ, Midgley JEM, Larisch R and Dietrich JW (2022) Principles of Endocrine Regulation: Reconciling Tensions Between Robustness in Performance and Adaptation to Change. Front. Endocrinol. 13:825107. doi: 10.3389/fendo.2022.825107 https://www.frontiersin.org/articles/10.3389/fendo.2022.825107/full
Principles: FT4
In the mathematical model (Ref. 1) two parameters may change the outcome of FT4:
k32 – positive feedforward of TSH onto FT4 (downstream, activating) and
a 3 – the FT4 elimination rate constant.

Only examples of the effect of the parameter –
- Hoermann R, Pekker MJ, Midgley JEM, Larisch R and Dietrich JW (2022) Principles of Endocrine Regulation: Reconciling Tensions Between Robustness in Performance and Adaptation to Change. Front. Endocrinol. 13:825107. doi: 10.3389/fendo.2022.825107 https://www.frontiersin.org/articles/10.3389/fendo.2022.825107/full
Principles: TSH
Four parameters regulate TSH (in the mathematical model (ref.1)):
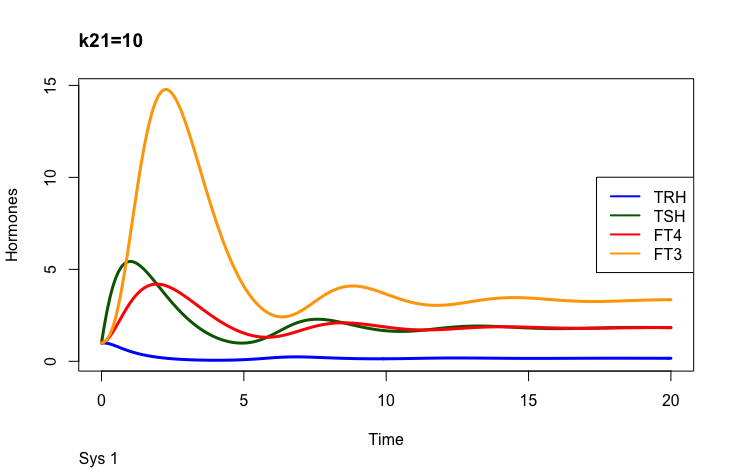
k21 – (positive feedforward of TRH onto TSH (downstream, activating)),
c2 – (the secretory capacity constant),
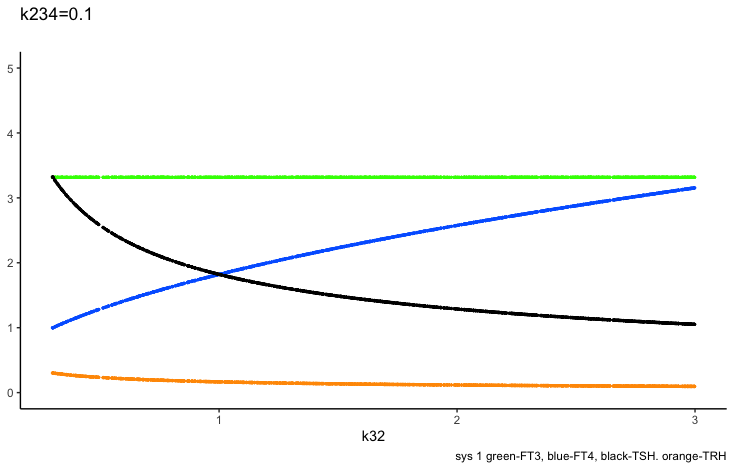
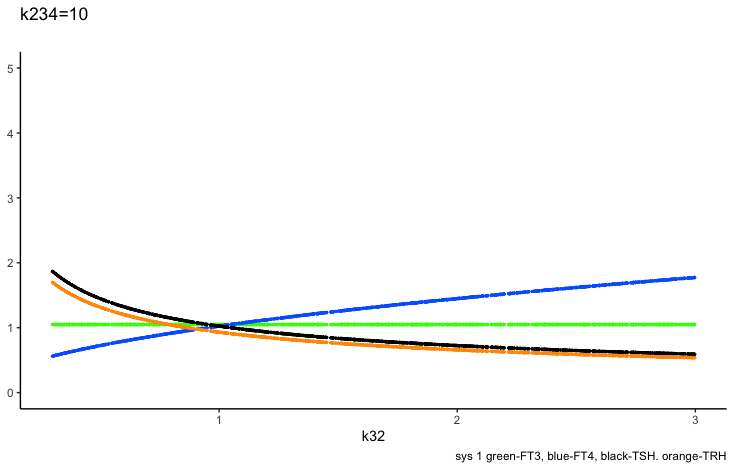
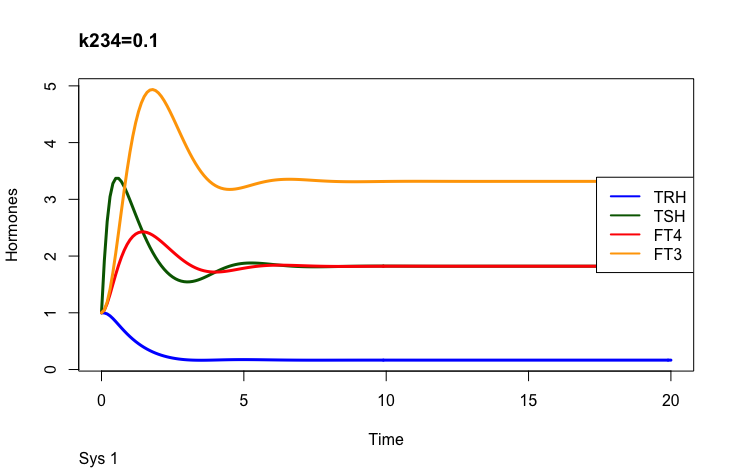
k234 -negative feedback of FT4 and FT3 onto TSH (upstream, repressing) and
a2 – (the TSH elimination rate constant.).
Be aware that the colours for the hormones are different in the rows below.
Positive feedforward of TRH onto TSH (downstream, activating)):
Negative feedback of FT4 and FT3 onto TSH (upstream, repressing)
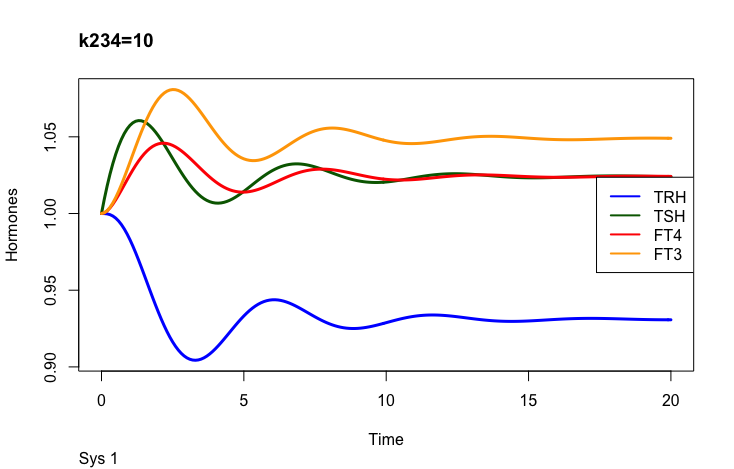
The TSH elimination rate constant.
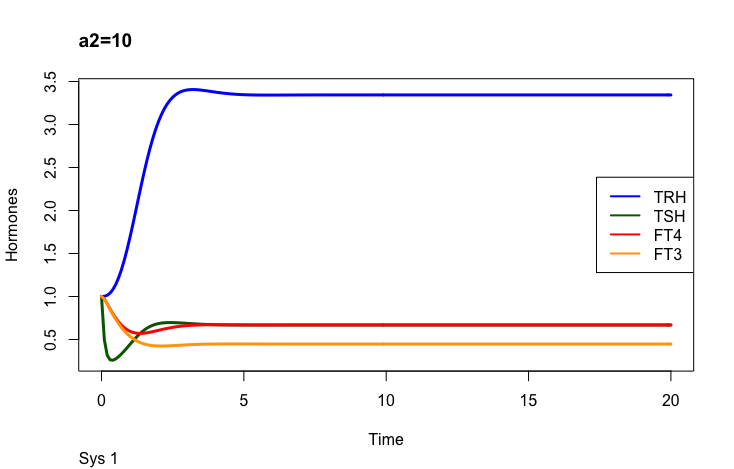
The secretory capacity constant
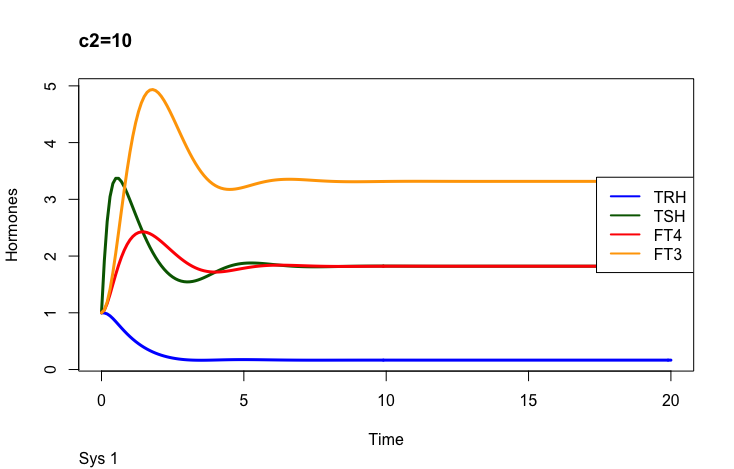
Only examples of the effect of the parameter –
- Hoermann R, Pekker MJ, Midgley JEM, Larisch R and Dietrich JW (2022) Principles of Endocrine Regulation: Reconciling Tensions Between Robustness in Performance and Adaptation to Change. Front. Endocrinol. 13:825107. doi: 10.3389/fendo.2022.825107 https://www.frontiersin.org/articles/10.3389/fendo.2022.825107/full
Principles: TRH
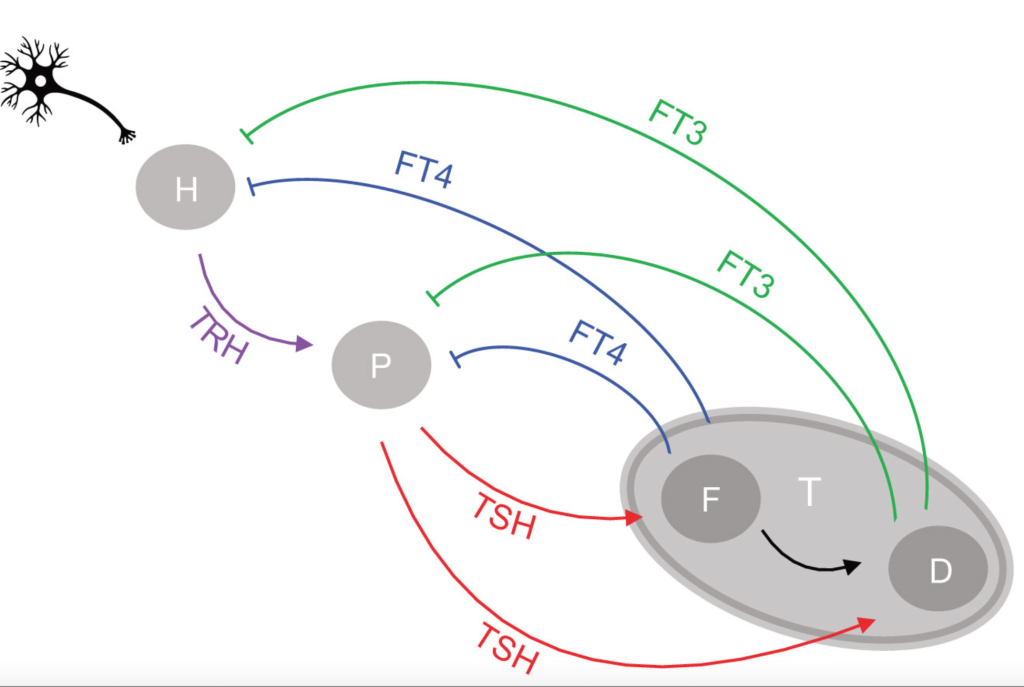
Hoerman et al (Ref.1) have developed a mathematical model with 14 different parameters that influence the HPT axis (hypothalamus – pituitary – thyroid axis). I will describe the effects in the following.
There are different parameters which can change the hormones in this mathematical model.
S1 is an input signal with an effect on TRH. As seen in the description above, changes in S1 affect the other hormones as well. The article describes how this knowledge can be used in combination with different parameters.
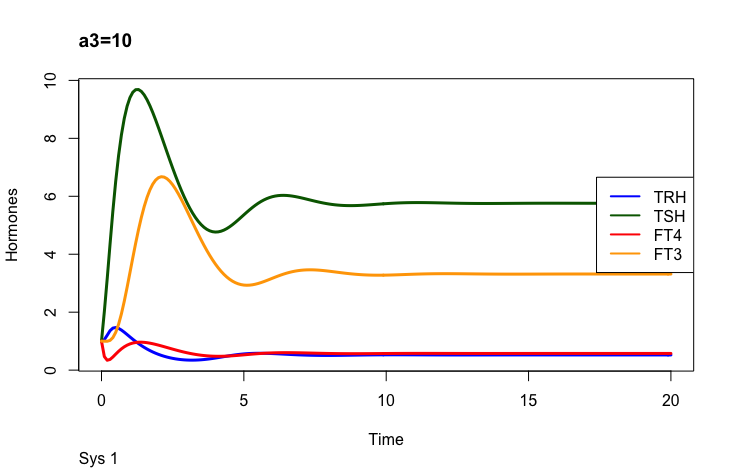
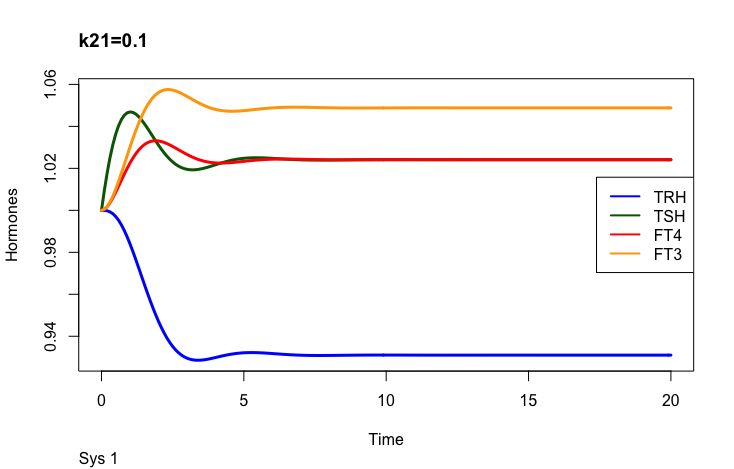
The first part of the above presentation describes the three different equilibrium solutions for s1=1, 0.1 and 10 and the second part describes the time-dependent solution.
You need not be good at mathematics to see the connection between the used equations and the conceptual drawing of the HPT axis (Ref.1). What is important is the complexity – and flexibility compared to a fixed TSH value as the understanding of the HPT axis.
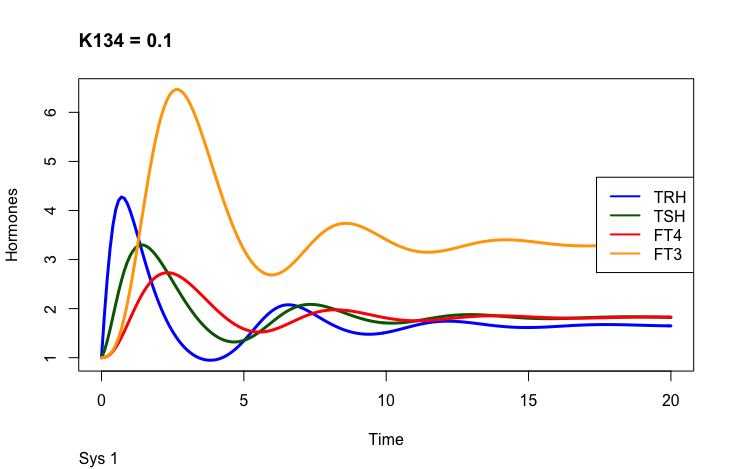
The first part of the second presentation describes the three different equilibrium solutions for k134 =1, 0.1 and 10 and the second part describes the time-dependent solution.
This is theoretical and only serves as an example of how the hormones are changed by the parameter. K134 is the negative feedback of FT4 and FT3 onto TRH (upstream, repressing).
Finally the a1 parameter ( a1 is the TRH elimination rate constant):
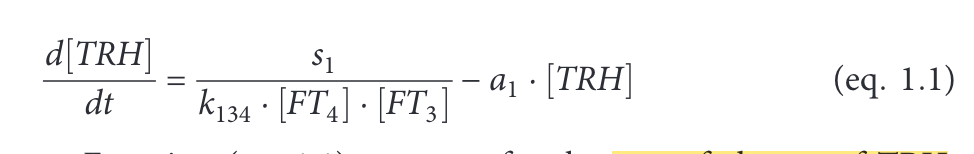
Look at equation 1.1:
We have looked at the effects of s1, k134 and a1 on TRH and the other hormones.
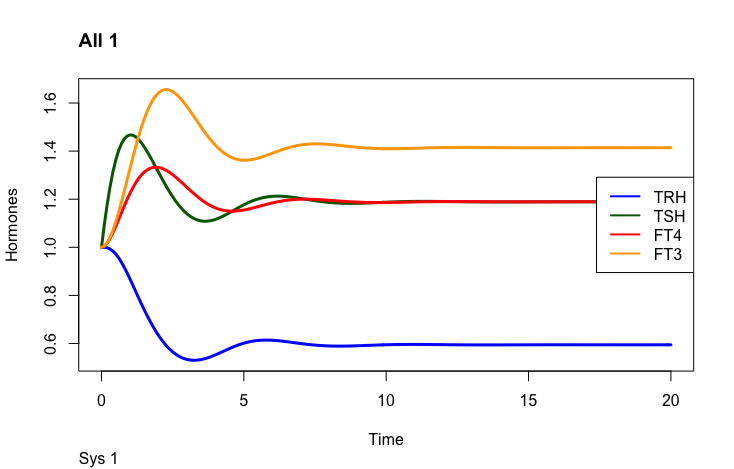
One thing to observe is the FT3 and FT4 curves. In the plot left is shown what the authors call “The perfect homeostasis”. Here the two curves follow each other with a certain distance. In the plots above this pattern is disrupted. We will get back to these observations later.
 Hoermann R, Pekker MJ, Midgley JEM, Larisch R and Dietrich JW (2022) Principles of Endocrine Regulation: Reconciling Tensions Between Robustness in Performance and Adaptation to Change. Front. Endocrinol. 13:825107. doi: 10.3389/fendo.2022.825107 https://www.frontiersin.org/articles/10.3389/fendo.2022.825107/full
Index of individuality and Simthyr
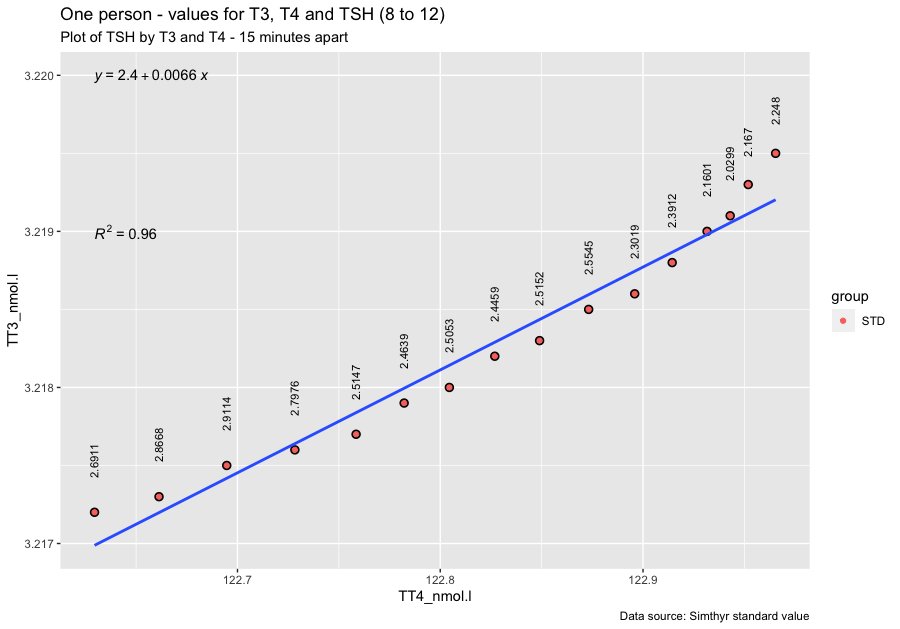
Stig Andersen et al. (1.) 2002 has a table with figures for TSH, TT3, and TT4. With Simthyr I have generated 16 values in intervals of 15 minutes from 8 to 12 o’clock. Of notice is the values for the 16 men and the simulated person from SimThyr the levels in the study are lower than that of the simulated person.
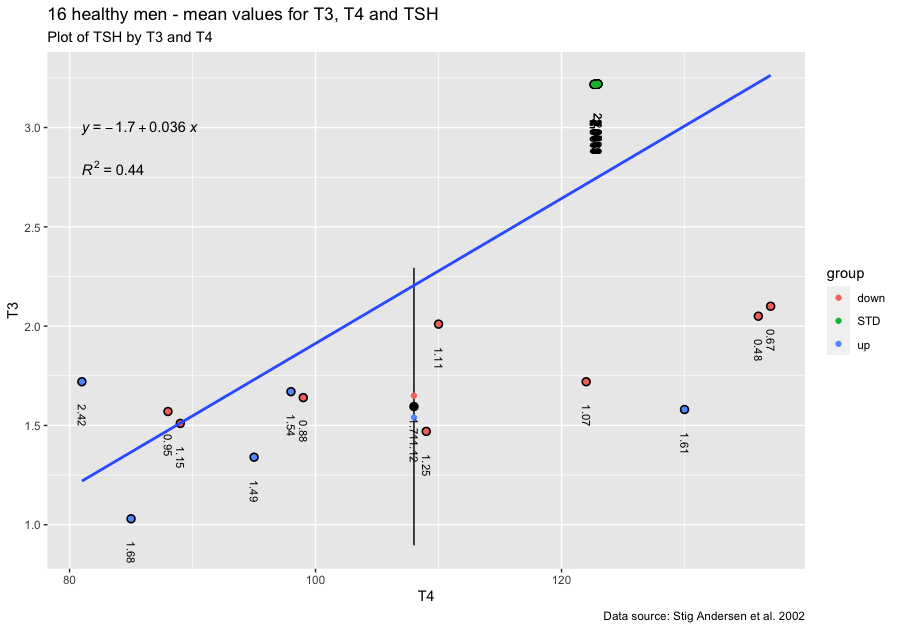
Notice the difference in mean T3 and TSH values between the 16 healthy men (down and up) and the simulated person from SimThyr (STD). The 16 figures from SimThyr are hard to read I have extracted the figures here:
None of these 16 pairs of values are alike. They change slightly over the period of time where most people are having drawn their laboratory tests.
The interactive graph below (opens slowly in a new window) shows the same picture. It is possible easily to identify how different the values are for each individual visualizing the index of individuality. Let the curser hit the dots and view the different patterns.
https://www.glensbo.dk/Files/sa1.html
References:
- Stig Andersen, Klaus Michael Pedersen, Niels Henrik Bruun, Peter Laurberg, Narrow Individual Variations in Serum T4 and T3 in Normal Subjects: A Clue to the Understanding of Subclinical Thyroid Disease, The Journal of Clinical Endocrinology & Metabolism, Volume 87, Issue 3, 1 March 2002, Pages 1068–1072, https://doi.org/10.1210/jcem.87.3.8165
- Simthyr – or here on these pages