A study by Zheng 2022, in Frontiers (Ref. 1) looks at how you are able to characterize patients with subclinical hypothyroidism.
Comparison of Five Different Criteria for Diagnosis of Subclinical Hypothyroidism in a Large-Scale Chinese Population:
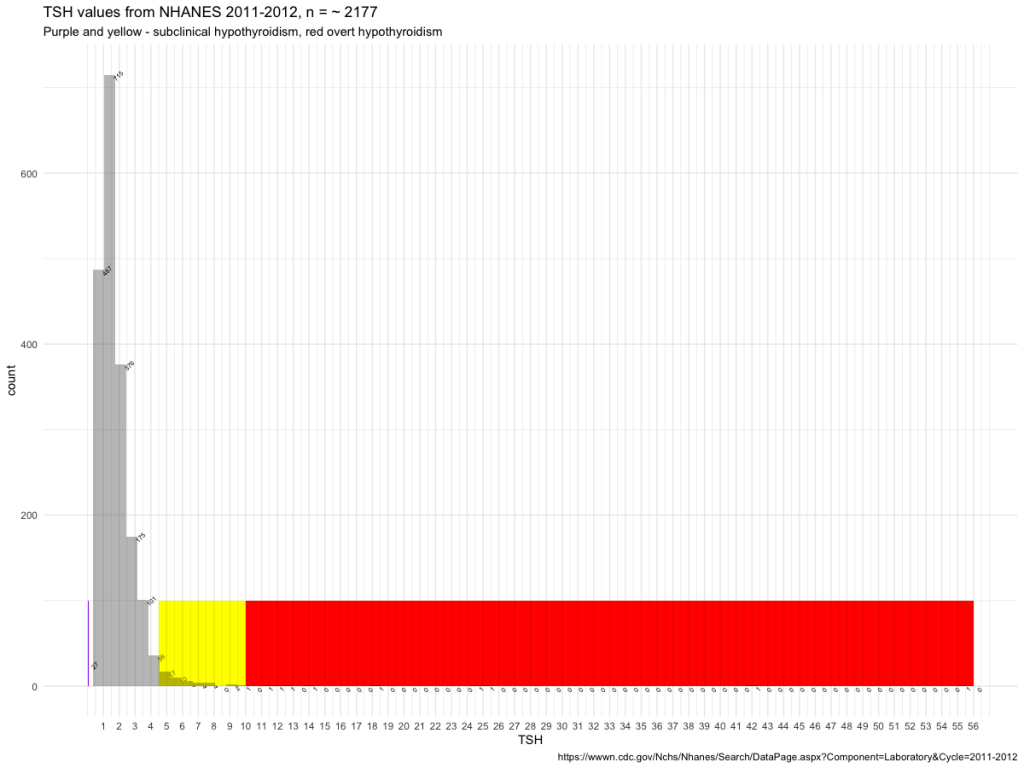
When an elevated TSH concentration was defined as ≥4.50 mIU/ L,
- (1) – an elevated TSH concentration with a normal FT4 concentration,
- (2) – an elevated TSH concentration with normal concentrations of FT3 and FT4,
- (3) – an elevated TSH concentration with normal concentrations of TT3 and TT4, 35 obs. not shown
- (4) – an elevated TSH concentration with normal concentrations of FT4 and TT4
- (5) – an elevated TSH concentration with normal concentrations of TT3, TT4, FT3, and FT4.
| 5 | Crit 5 | 62971 | 65885 | 68250 | 70161 | 70865 | ||
| 6 | Crit 2 | 62971 | 65885 | 66877 | 68250 | 70161 | 70865 | |
| 7 | crit 1 | 62971 | 65885 | 66877 | 68250 | 69704 | 70161 | 70865 |
| 7 | Crit 4 | 62971 | 65885 | 66877 | 68250 | 69704 | 70161 | 70865 |
The results shown in table 1 indicate that criteria 5 is the most precise.
| ID | AGE | FT3x | FT4 | TSH | TT3 | TT4x | |
| 1 | 66877 | 80 | 4.158 | 17.7 | 4.7 | 1 | 147.1041 |
| 2 | 69704 | 30 | 6.93 | 13.7 | 4.66 | 3 | 112.3551 |
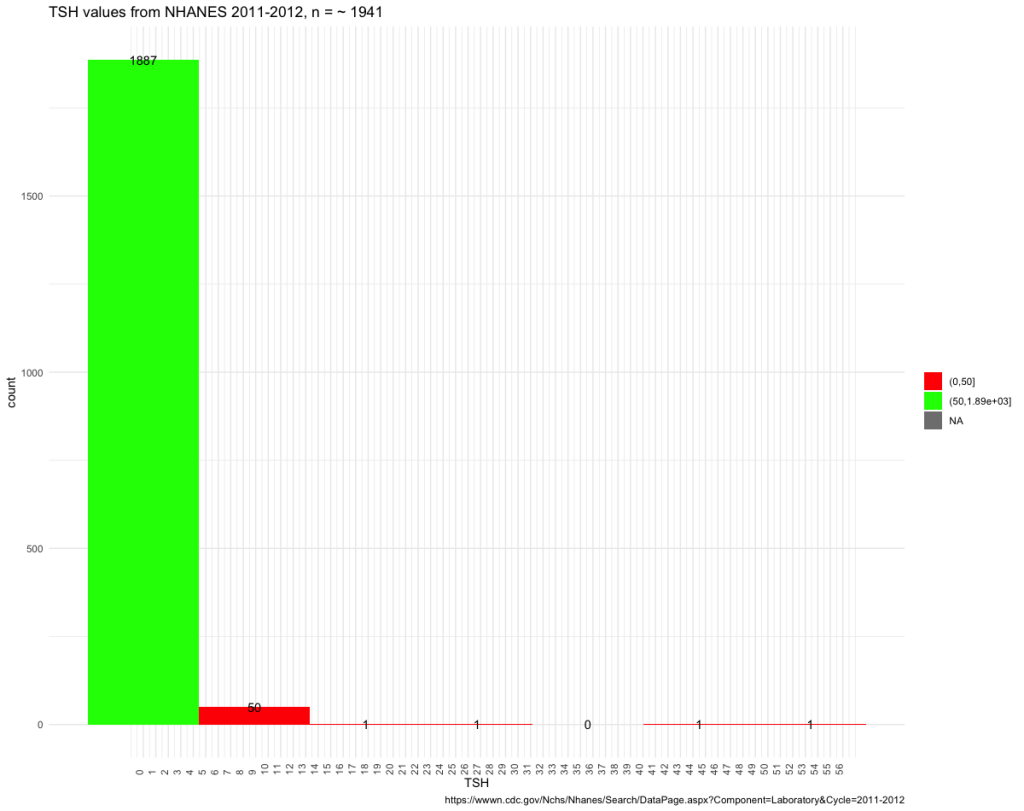
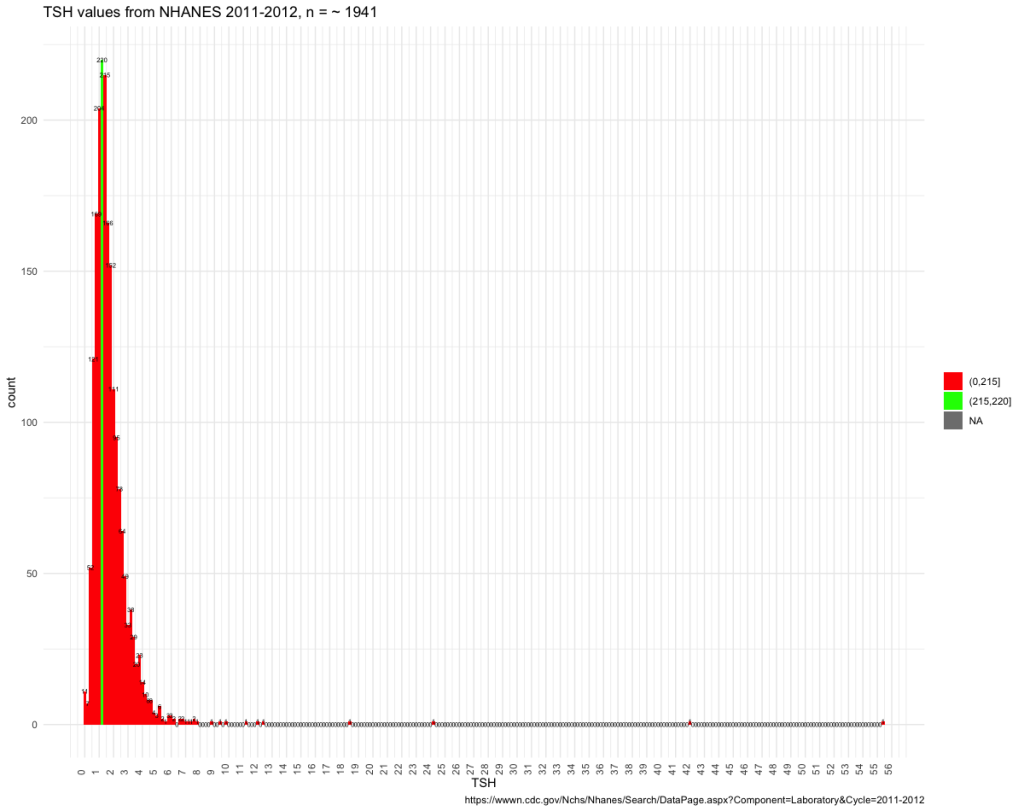
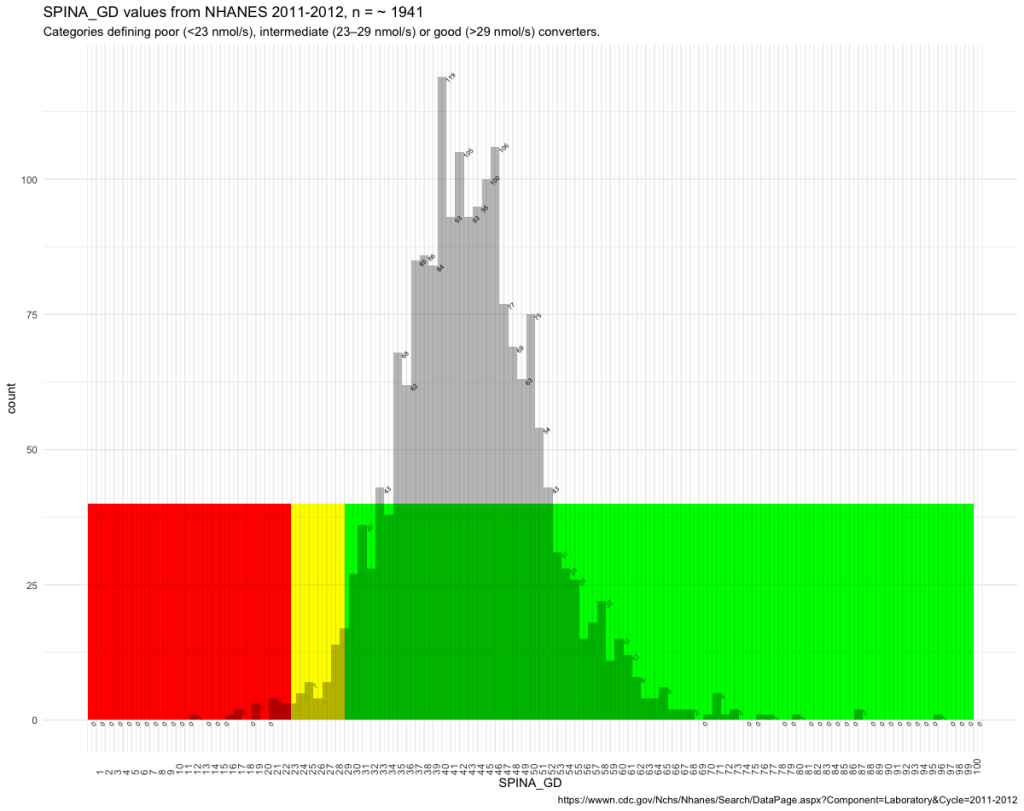
That I have applied these criteria to the NHANES figures (Ref. 2) is of course not reasonable nor science but an attempt to illustrate what they are capable of. To me, it revealed that the reference interval is floating.
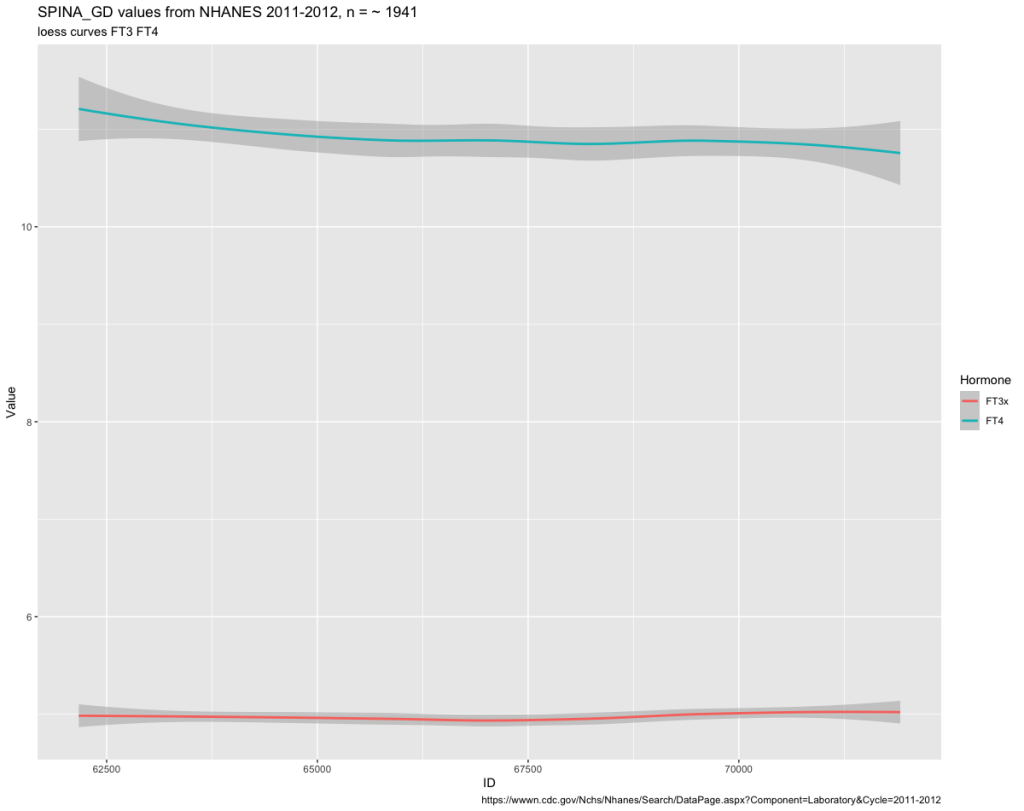
Next, I applied the reference intervals from NHANES to the 5 criteria.
The NHANES reference values as a basis – the difference between criteria 1 (28 obs) and criteria 5 (21 obs). The T3 values are important for judging subclinical values better than just for TSH/FT4 values. In table 3 are the 7 persons that differ between criteria 1 and 5.
| ID | FT3 | FT4 | TSH | TT3 | TT4 |
| 70119 | 4.01 | 0.73 | 7.55 | 117 | 6.83 |
| 70045 | 2.67 | 0.61 | 12.49 | 92 | 5.44 |
| 67460 | 1.73 | 0.79 | 11.28 | 69 | 8.24 |
| 66056 | 2.21 | 0.8 | 5.93 | 66 | 7.9 |
| 65145 | 2.29 | 0.88 | 42.09 | 64 | 7.93 |
| 63150 | 3.31 | 0.85 | 6.15 | 123 | 5.63 |
| 62919 | 2.98 | 0.77 | 7.24 | 100 | 5.98 |
Ref. val | 2,5 – 3,9 | 0.6 – 1.6 | 80 – 200 | 6.09 – 12.23 |
Four of the 7 not excluded would have been found by the FT3 value and only – three of the values would have been found by TT4. This follows the results seen in the Zheng et al article.
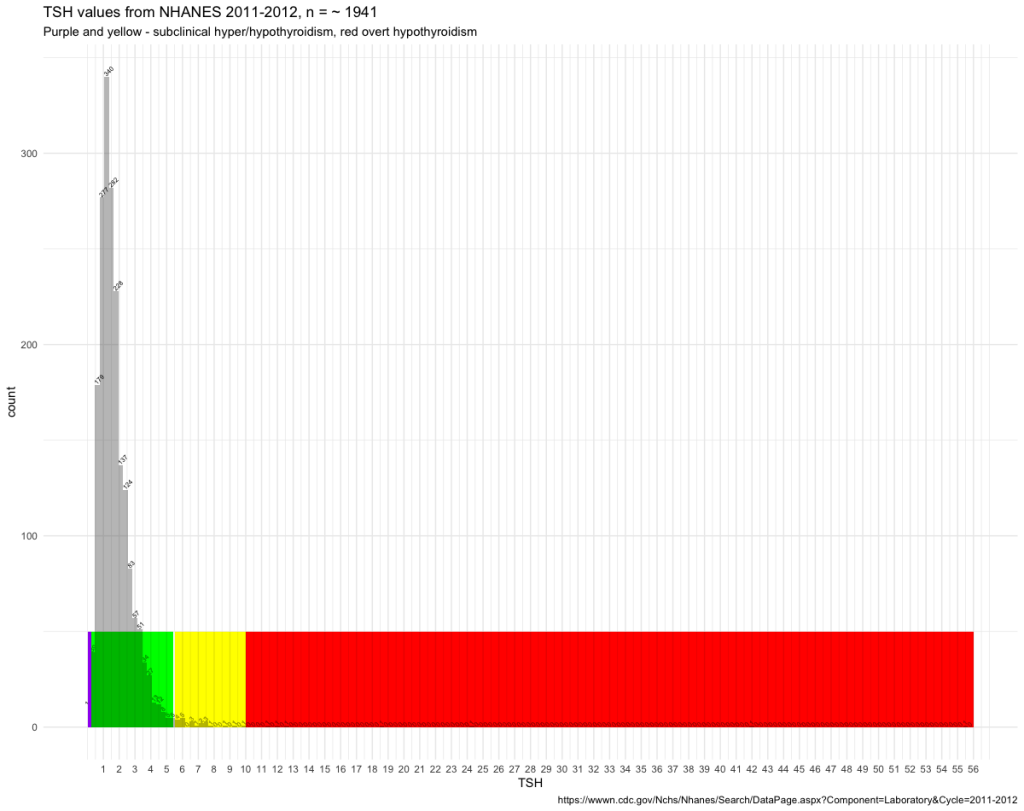
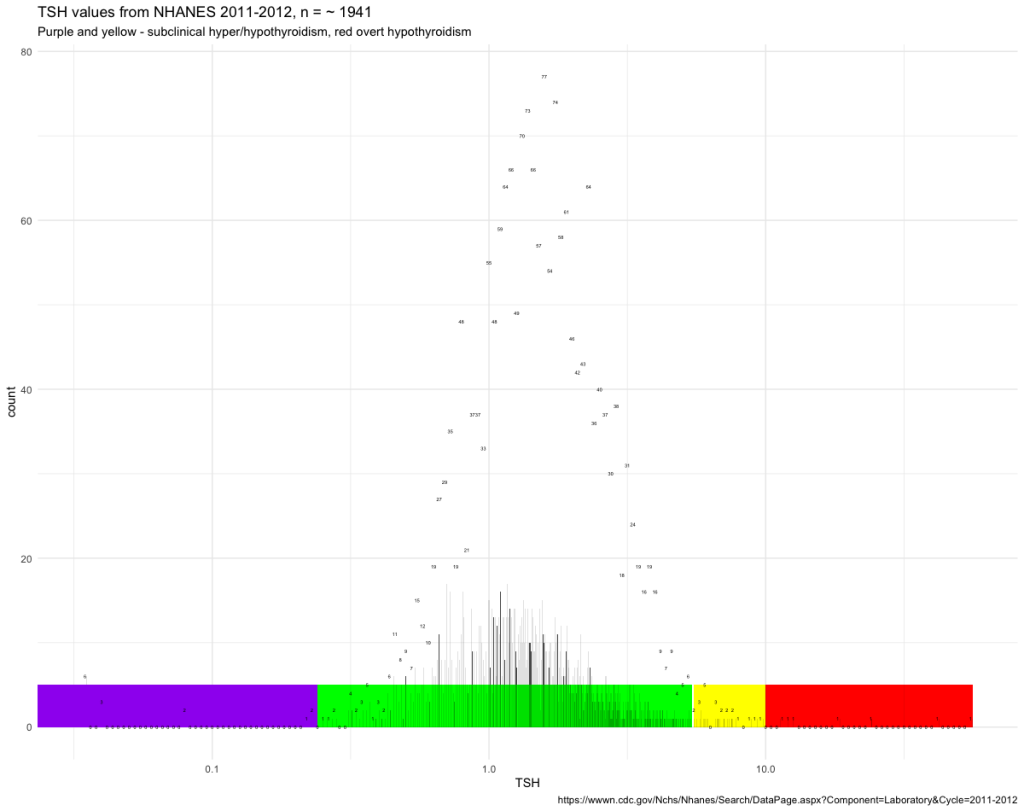
5 criteria plus TSH above the upper reference level gives the best result.
There has been a focus on the TSH levels as the indicator of subclinical hypothyroidism if FT4 at the same time in the reference interval. The summary of the FT4 values in criteria 5 is not sufficient in identifying the last seven persons. Only applying the FT3 reference interval identifies the last persons with subclinical hypothyroidism.