CIRCLE
Home
Create And Use Scenarios in SimThyr
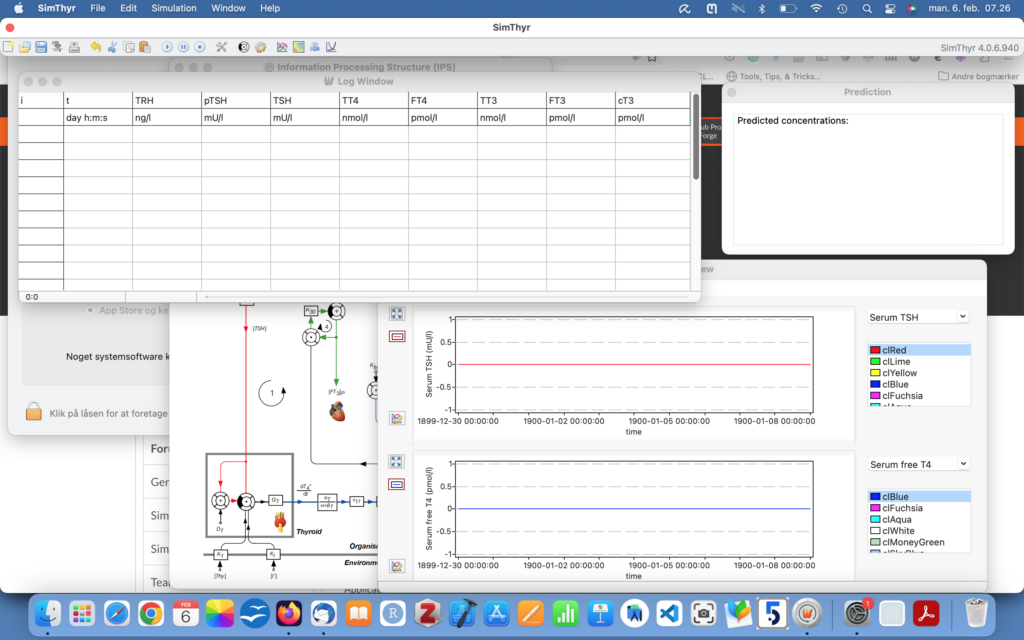
We start by opening SimTHyr v. 4.0.6
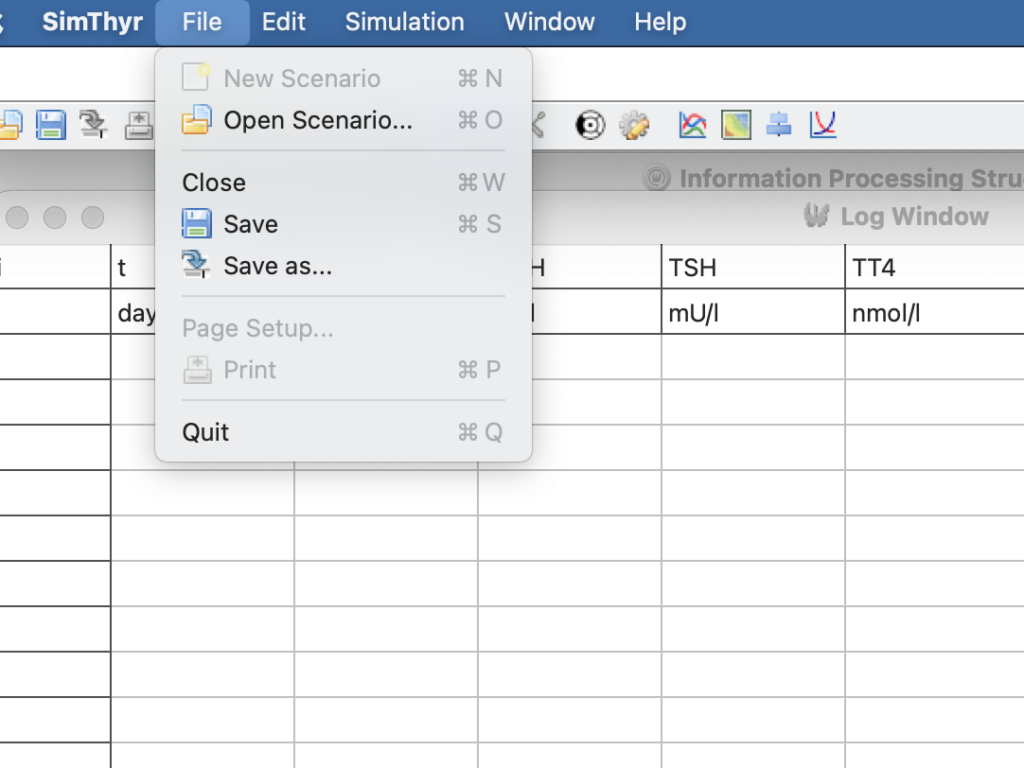
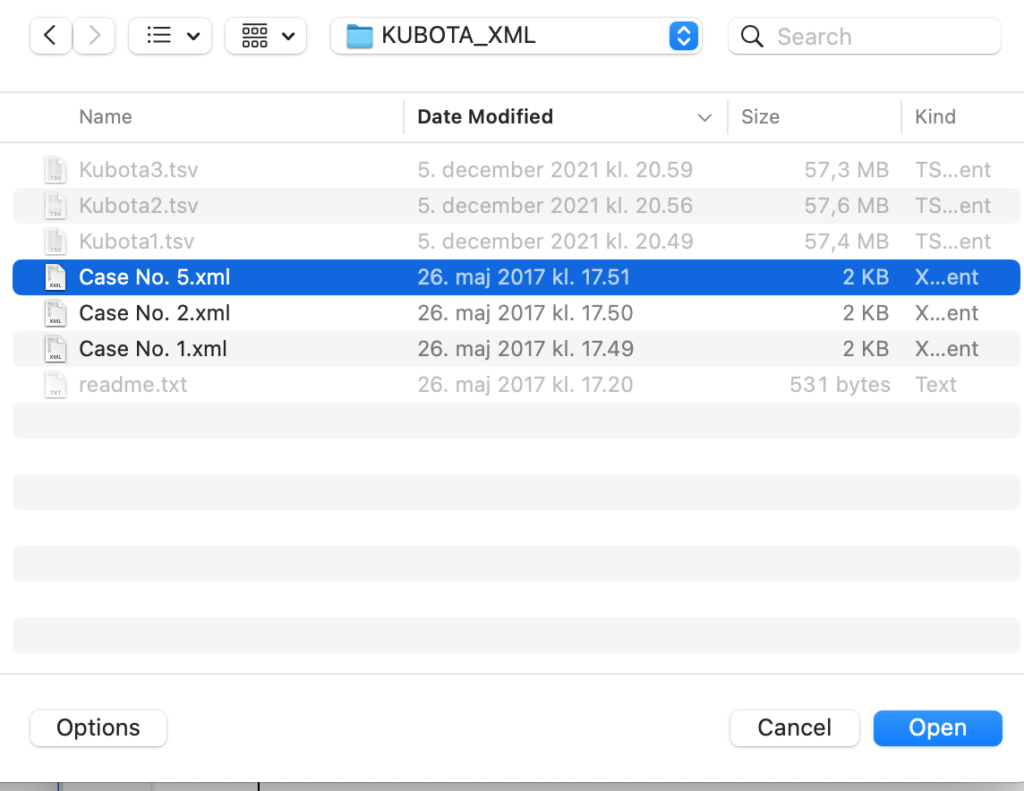
I have downloaded the scenarios as xml files and choose Kubota nr 5
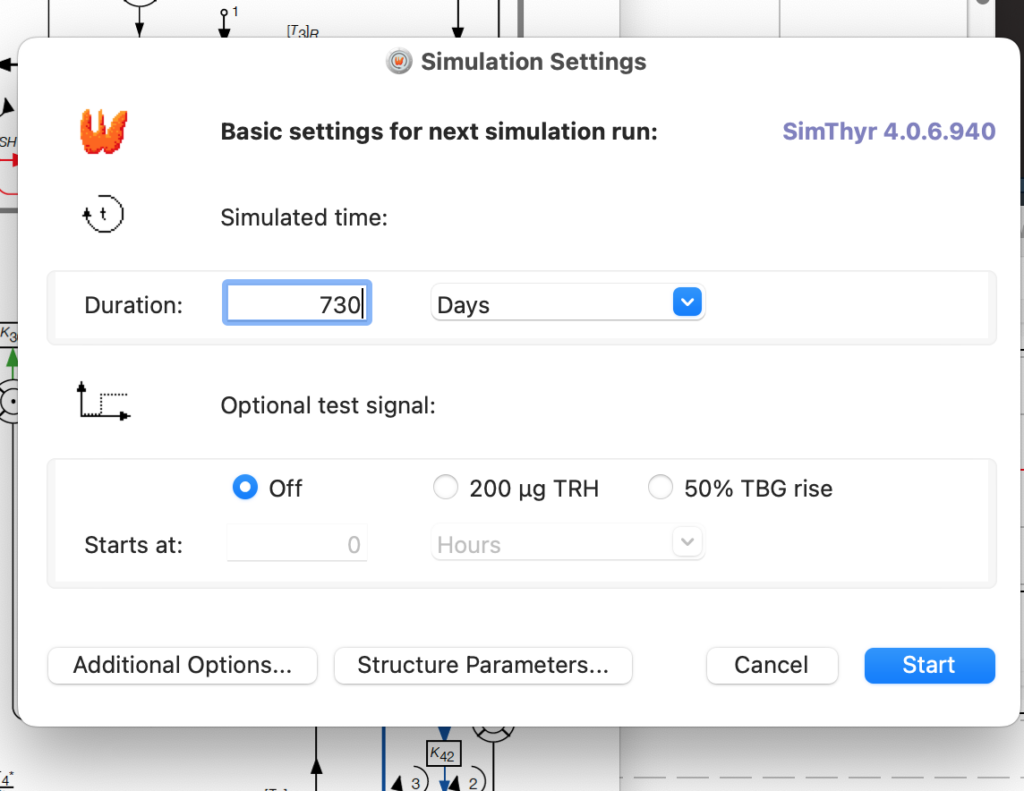
Now the relevant parameters are changed in the model and we can run the scenario
After doing so we can save the results – but before that – a little detour to the Preferences settings.
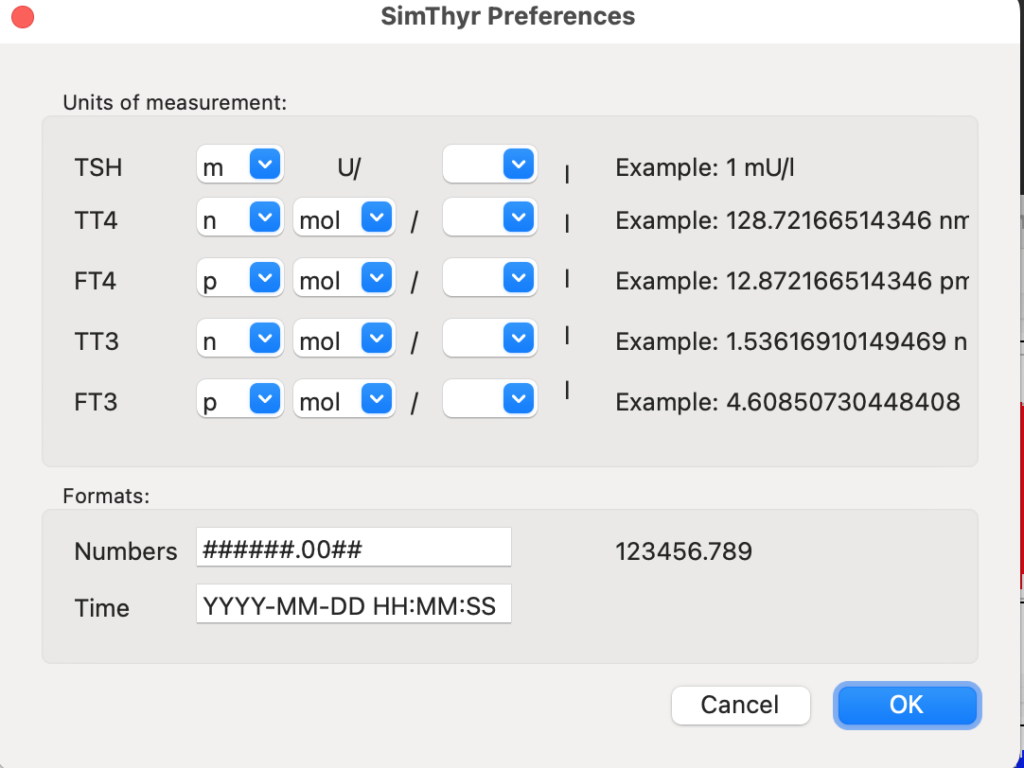
Running the Scenario for 730 days gives this opening image

Then I save it as .tsv and prepare for importing the file into R.
Continues in a Markdown file to be found here: LINK
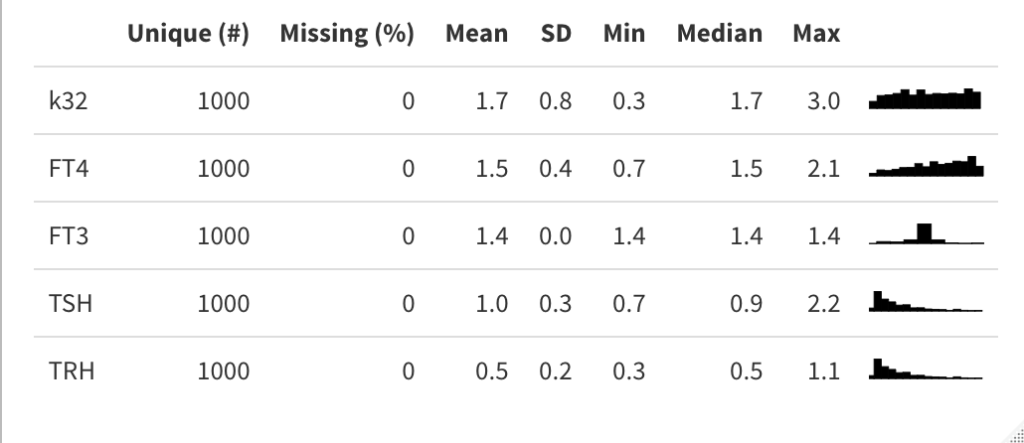
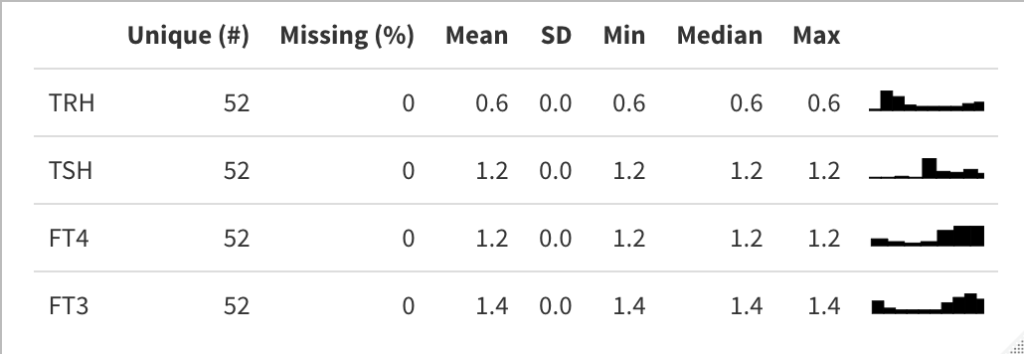
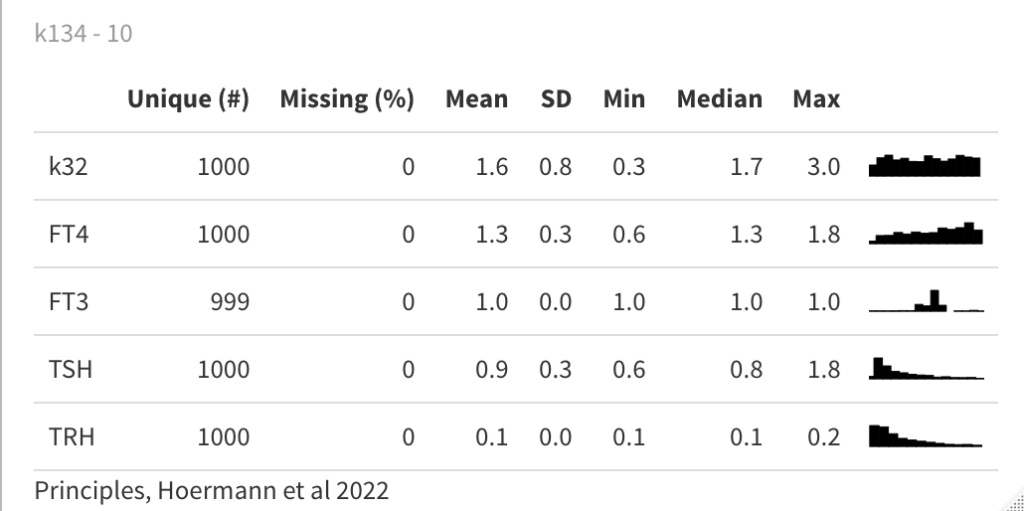
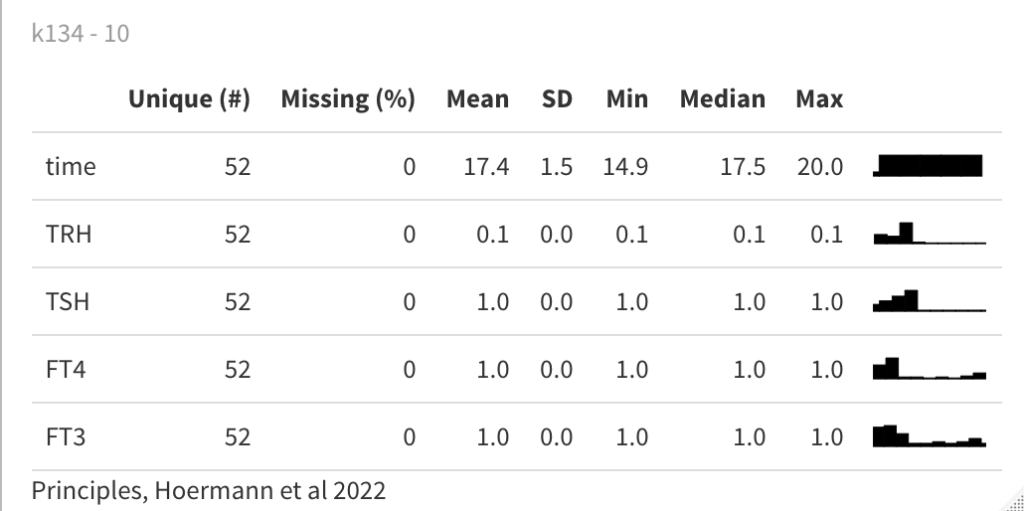
Summaries 1.1 to 1.4 – 1
While working on this page, I came across a saving opportunity in R – save.image. It was a fantastic possibility till it was not anymore. After opening R and pressing save.image left me with an empty workspace and hours of lost work. Hence this page is not complete yet.
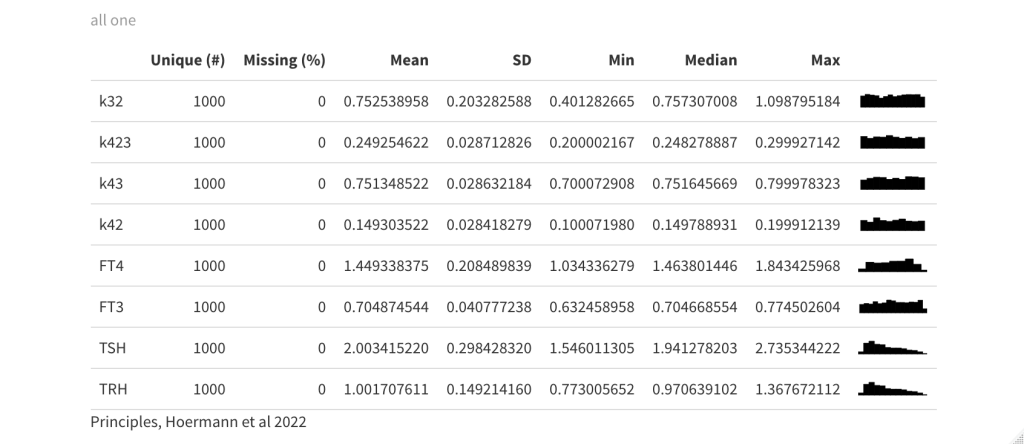
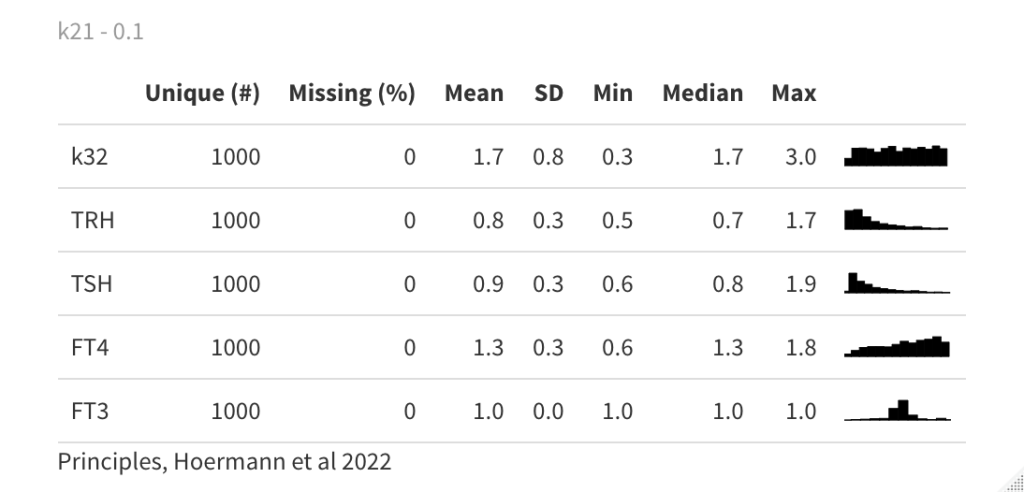
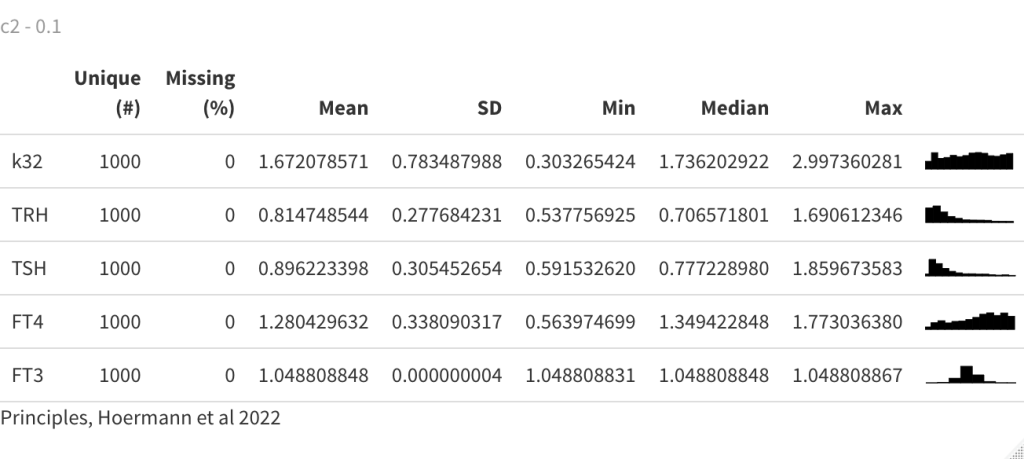
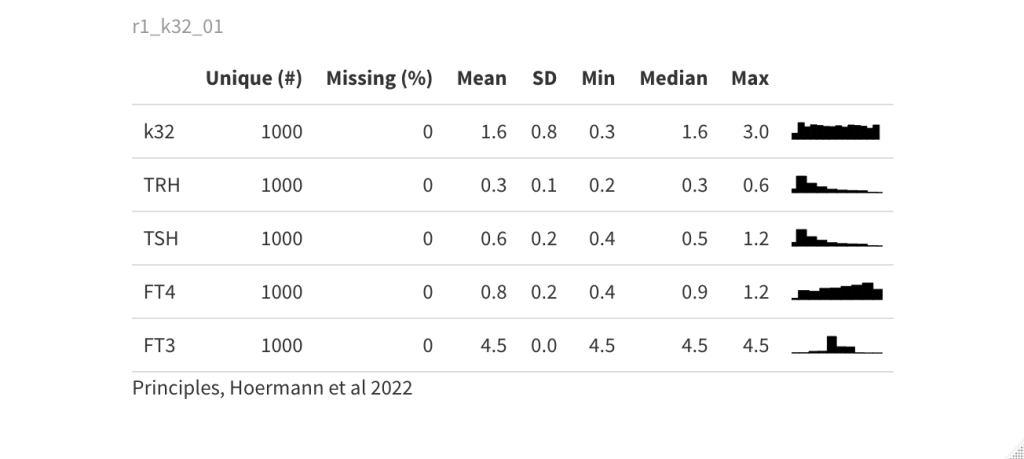
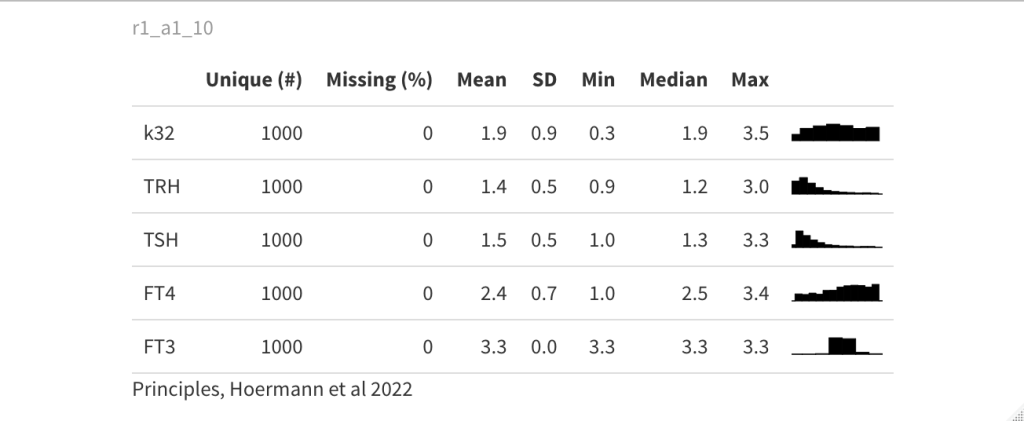
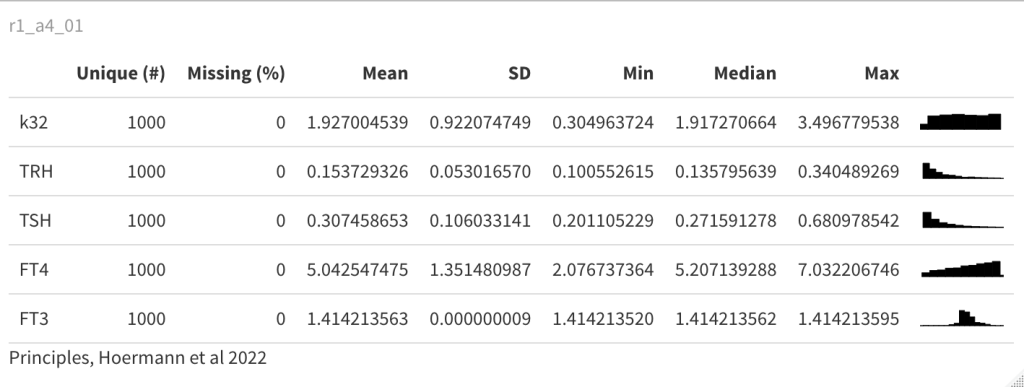
These tables show the complex (theoretical) interplay between the hormones.
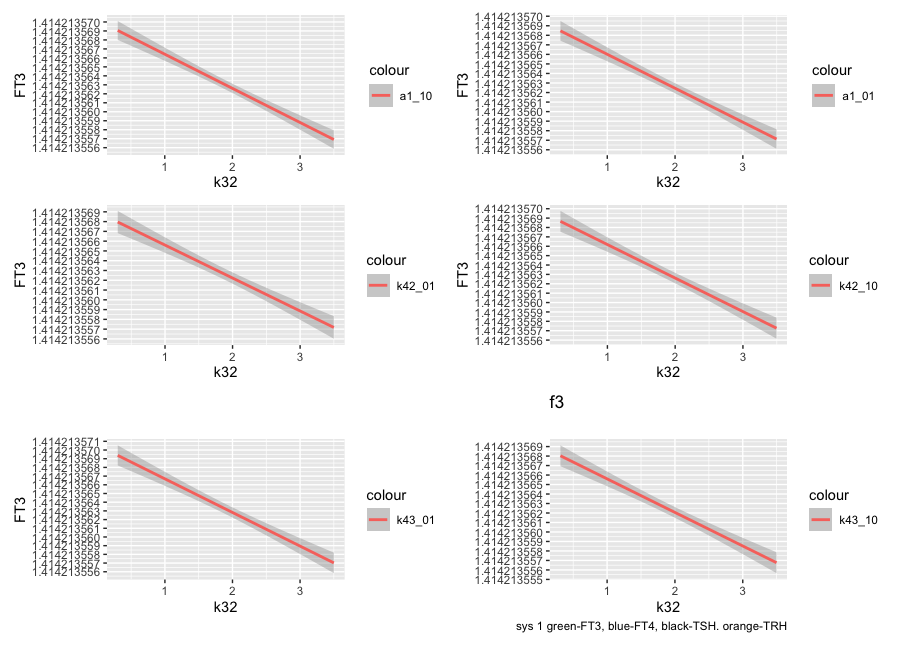
Equilibrium solutions
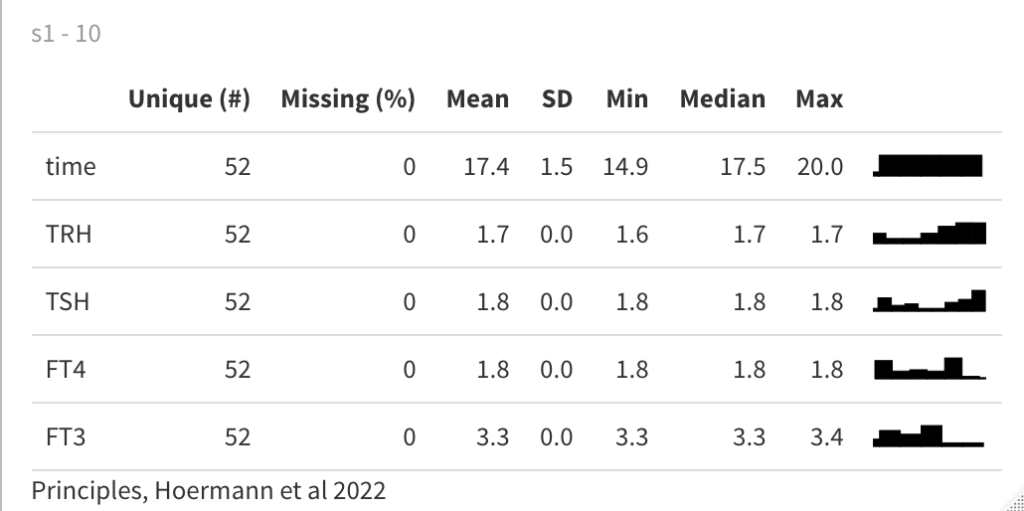
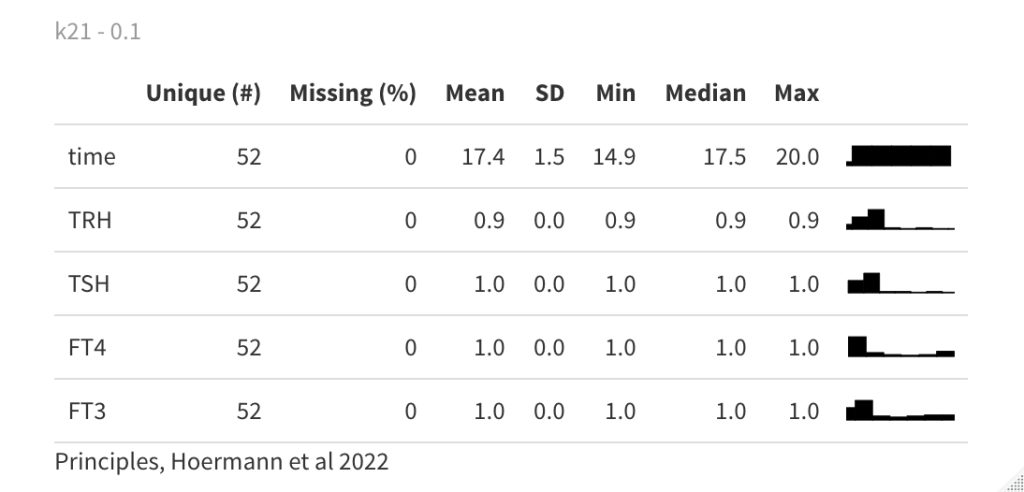
Time-dependent solutions

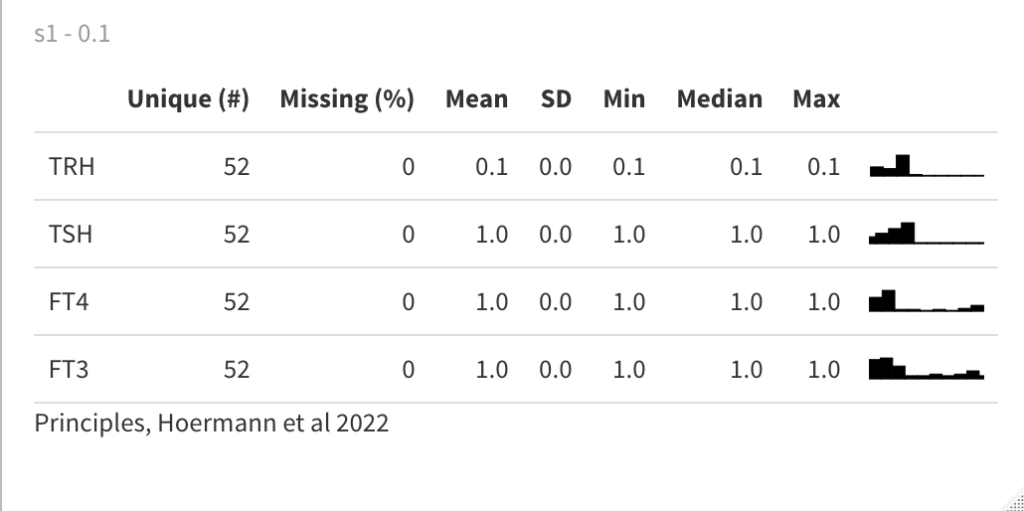
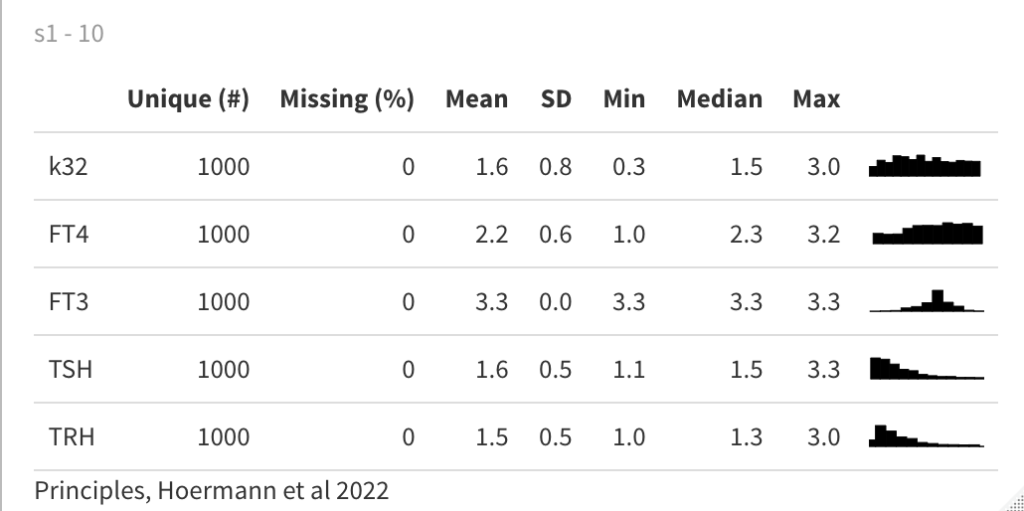
s1/FT3(0.1,1,10) – 1.0, 1.4, 3.3
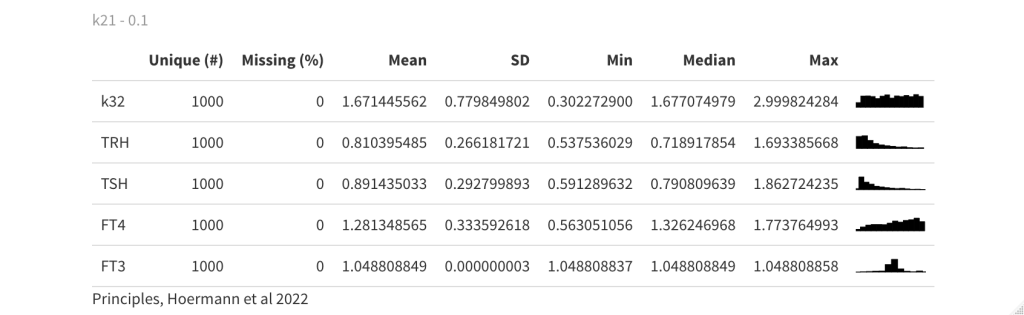
s1/TSH(0.1,1,10) – 0.9, 1.0, 1.6
s1/TRH(0.1,1,10) – 0.1, 0.5, 1.5
There is still a marginal variation in FT3 all over the range – see the histograms. But it is in the 9th decimal
| s1_10 (analytical equilibrium solutions of system (1)) | |
| TRH | 1.6556002607617 |
| TSH | 1.82116028683787 |
| FT4 | 1.82116028683787 |
| FT3 | 3.3166247903554 |
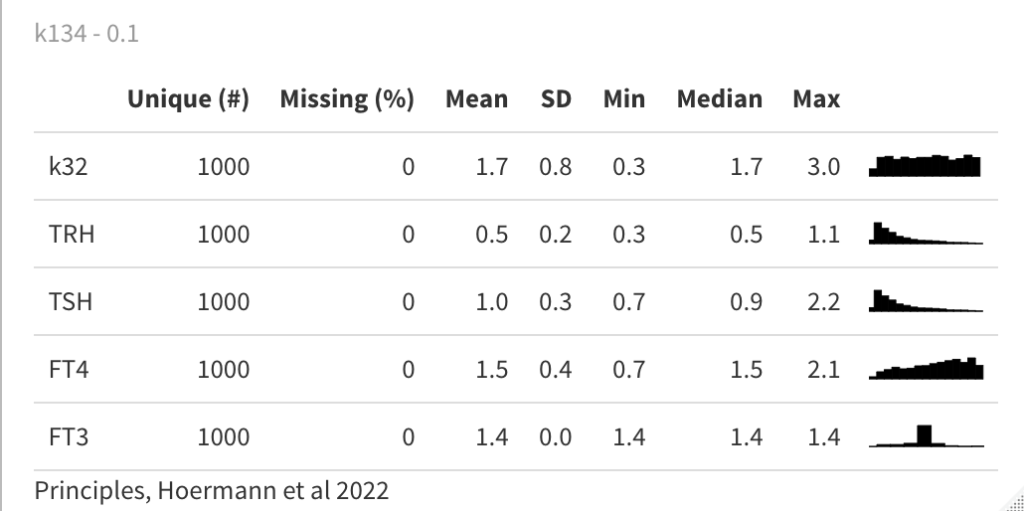
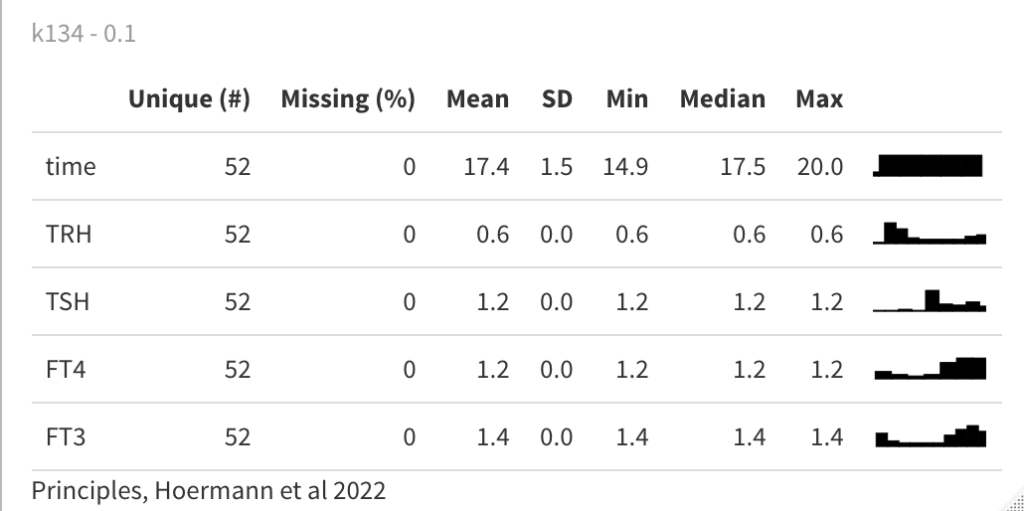
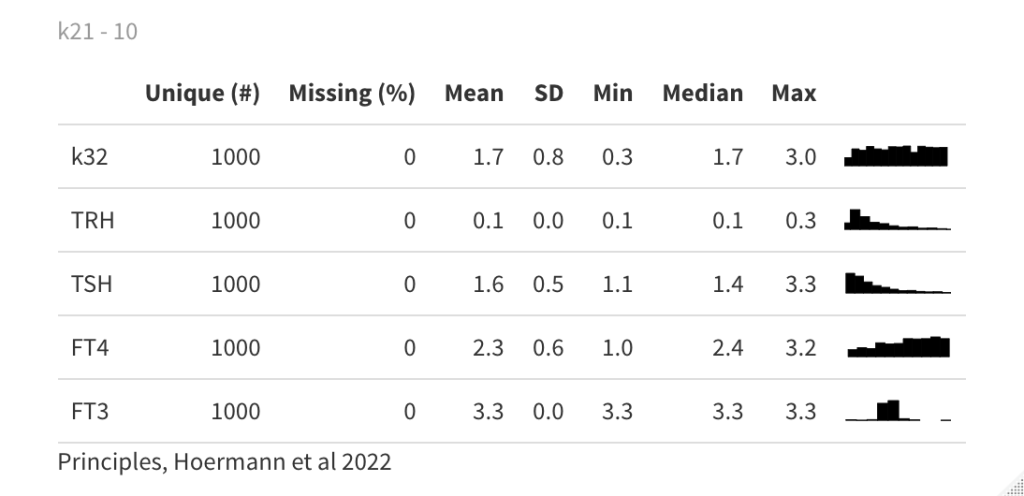
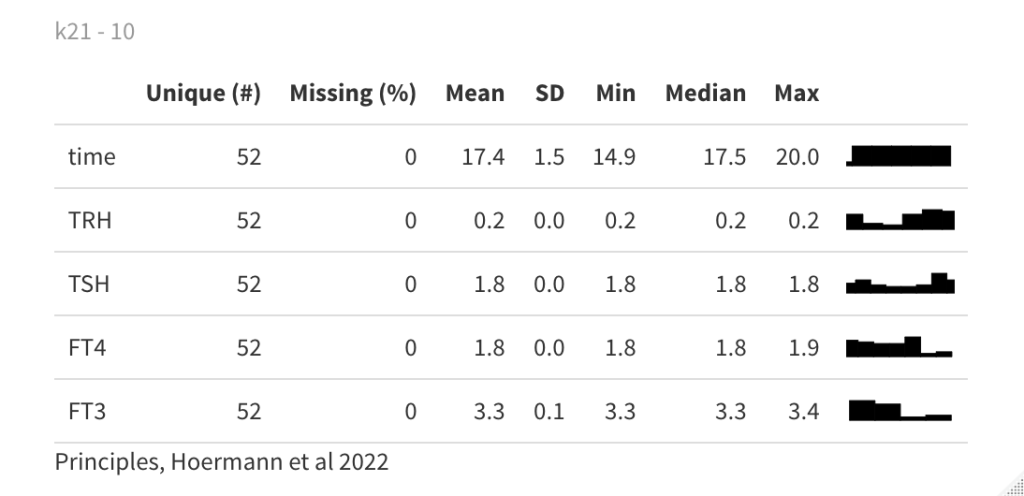
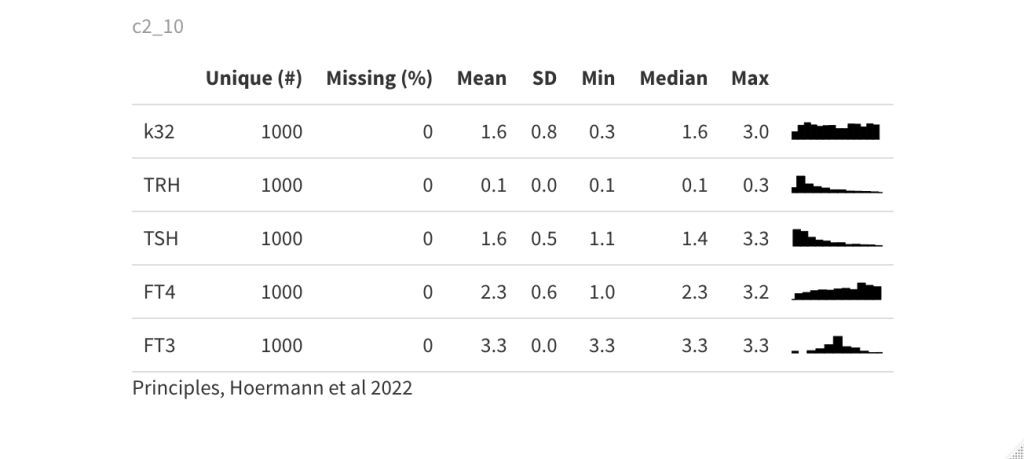
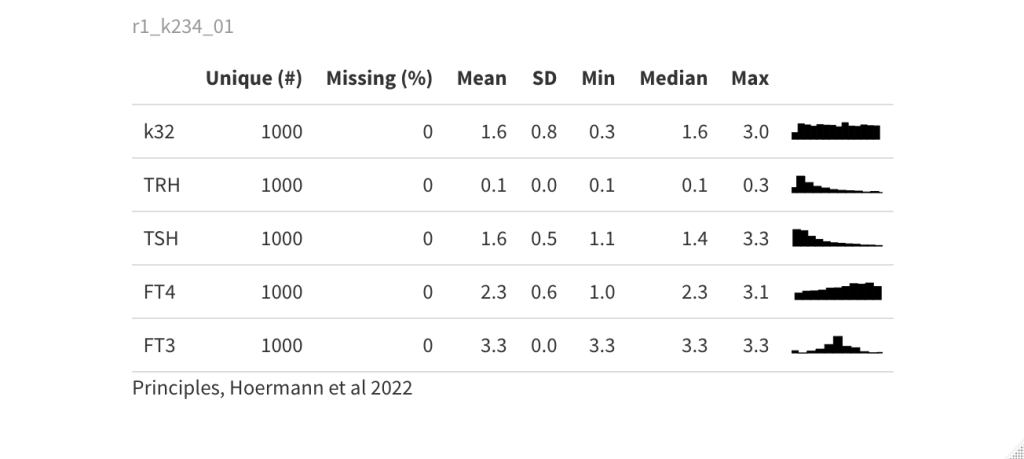
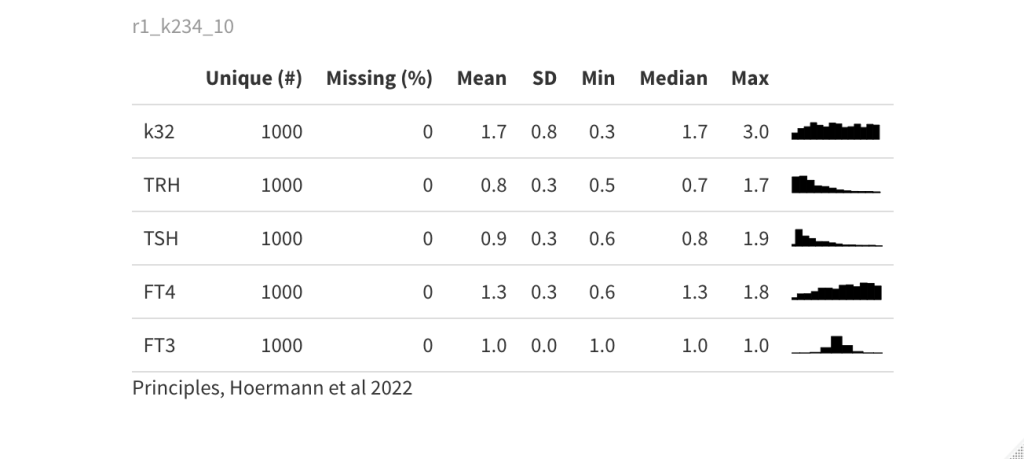


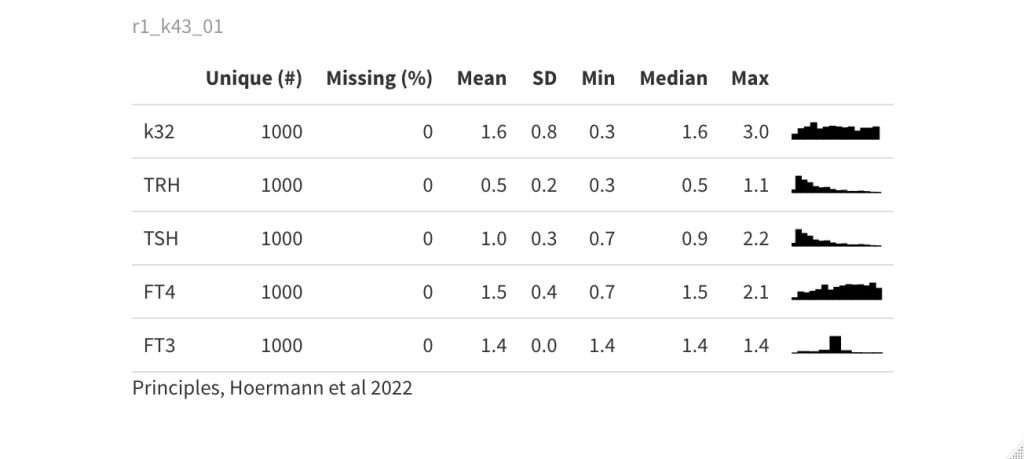
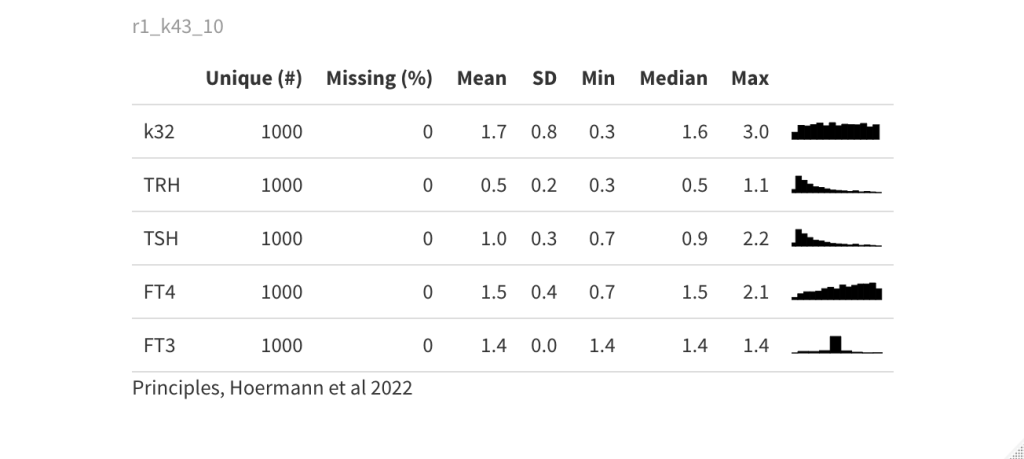
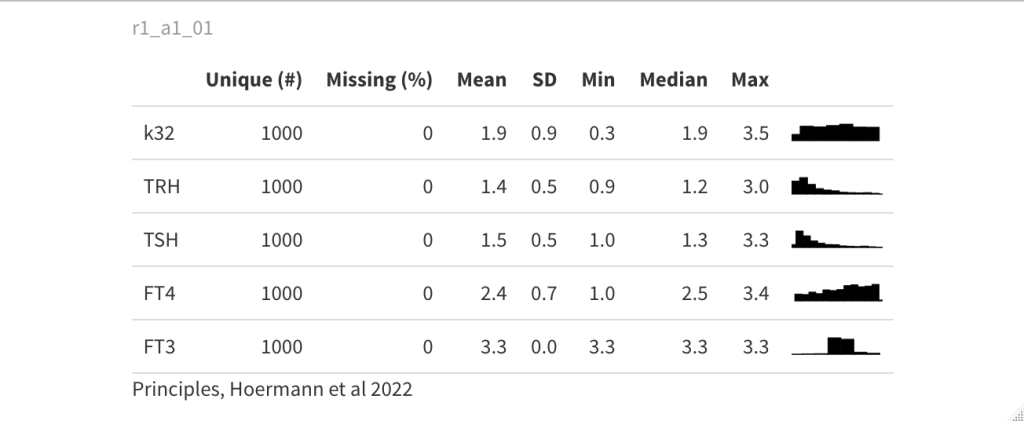
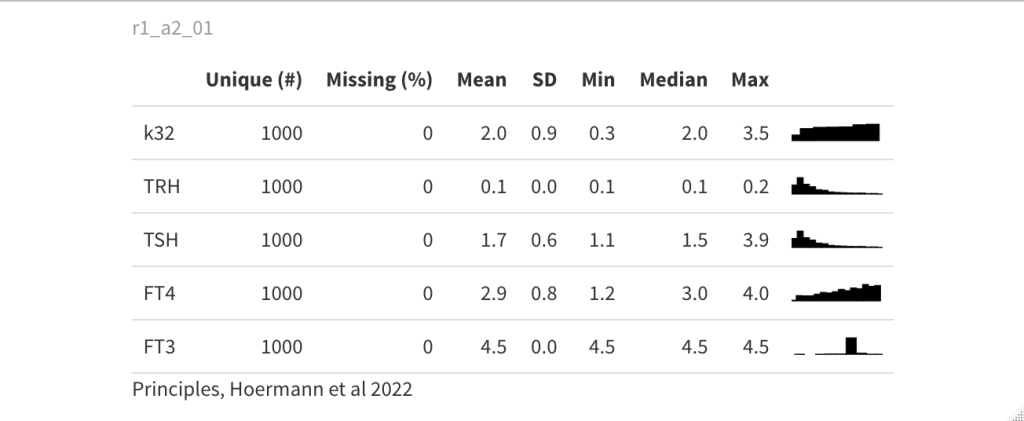
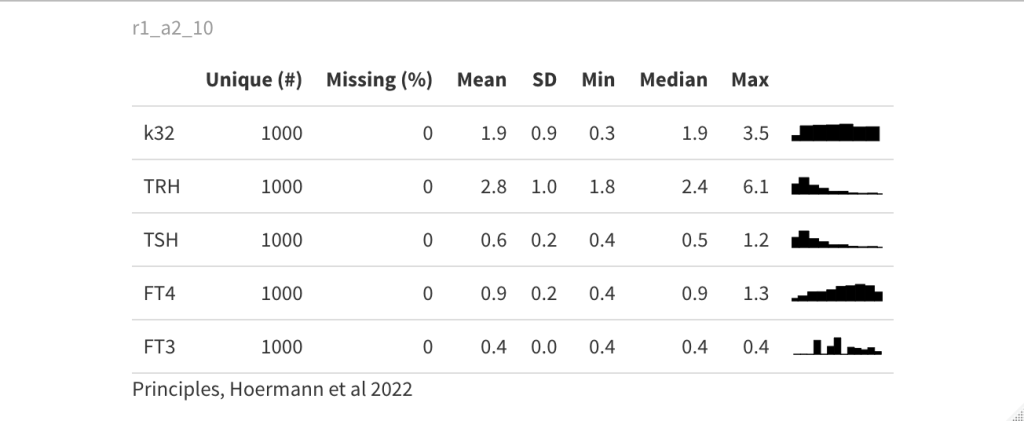
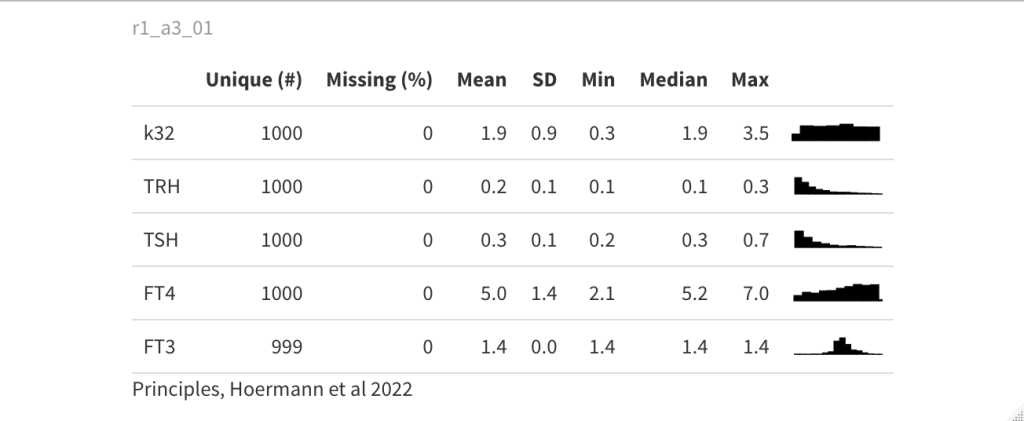

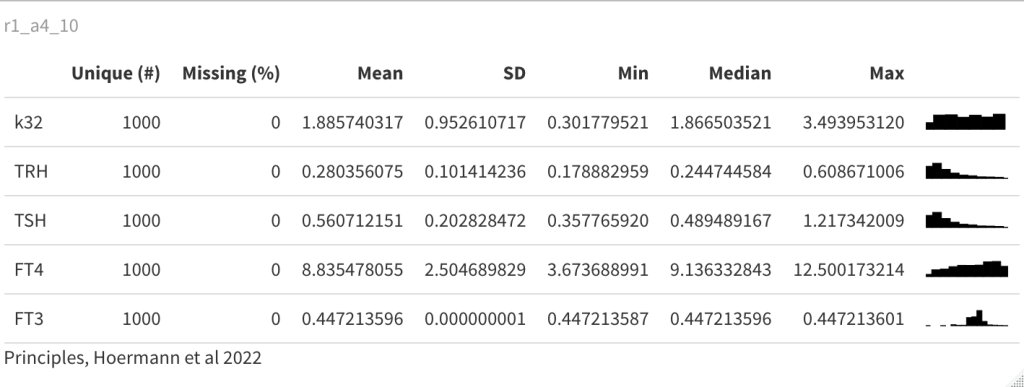
Below are three different parameters 0.1 or 10 – to show the movement experimental not physiological
P300 abstracts
You may find some connections between severe/chronic disease and impaired cognition measured by P300
Pilo 1 overview
Objective: To visualize different computer-based scenarios from Simthyr with the help of RStudio and different packages. Pilo 1 summary reflects the values at 7.00 o’clock each day for a year.
Three distinct SPINA-GD categories defining poor (<23 nmol/s), intermediate (23–29 nmol/s) or good (>29 nmol/s) converters. (LINK)
Pilo 1 skim_summary all year reflects the values at any time during a year.
The profile of the histogrammes in the summaries shows the differences in the profile.
From the information of the Pilo 1 file:
Case No. 1 from Pilo et al. showing slight hyperdeiodination and high conversion rate [Pilo A, Iervasi G, Vitek F, Ferdeghini M, Cazzuola F, Bianchi R. Thyroidal and peripheral production of 3,5,3′-triiodothyronine in humans by multicompartmental analysis. Am J Physiol. 1990 Apr;258(4 Pt 1):E715-26. PubMed PMID: 2333963.] LINK
Slight hyperdeiodination:
may lead to suppressed TSH levels,
Isolated high-T3 syndrome with normal or even low FT4 levels is a rare form of NTIS that is caused by hyperdeiodination.
Recently, the first case of thyroid hormone receptor alpha mutation was reported. The phenotypical pattern consisted in skeletal abnormalities, microsomia, constipation, and hyperdeiodination. (LINK)
High conversion rate:
– From a systems biologic perspective, thyroid homeostasis is a processing structure whose signalling is implemented by two different mechanisms, conversion and relaying.
– Another example of conversion processes is transport of thyroid hormones by plasma and transmembrane transporters.
– A large portion of thyroxine binds reversibly to plasma proteins. Only a small free fraction (0.02% to 0.03%) is available for conversion to T3 and transport to cytoplasm. T3 is formed from T4 by 5′ deiodination at the outer ring by type 1 deiodinase predominantly in liver, kidney, and thyroid. Type 2 deiodinase mediates intracellular deiodination in glial cells, pituitary, brown adipose tissue, skeletal muscle, and placenta [19]. Obviously, intracellular deiodination facilitates feedback at the pituitary level by providing a mainly T4-dependent mechanism, which is faster than one that would depend on T3 from systemic circulation [20]. In addition, T3 is regulated by nonthyroidal factors, first of all peripheral deiodination [19, 21–25] that is subject of multiple metabolic control inputs [19, 26–30], which would also render a primarily T3-dependent feedback mechanism ineffective. High pituitary DIO2 expression rate ensures operative feedback despite T4-induced ubiquitination of type 2 deiodinase [31].(LINK)
Hyperdeiodination compensates for beginning thyroid failure (LINK)
A correlation only shows if there is a relationship between variables. (LINK)
Looking at SPINA-GD and the correlation with T4 and T3 and comparing the three hours from 7 to 9 with figures for the whole year shows that the T3 values differs markedly.
Deliberate overplotting! Showing that most of the parameters change significantly within each hour over a year.
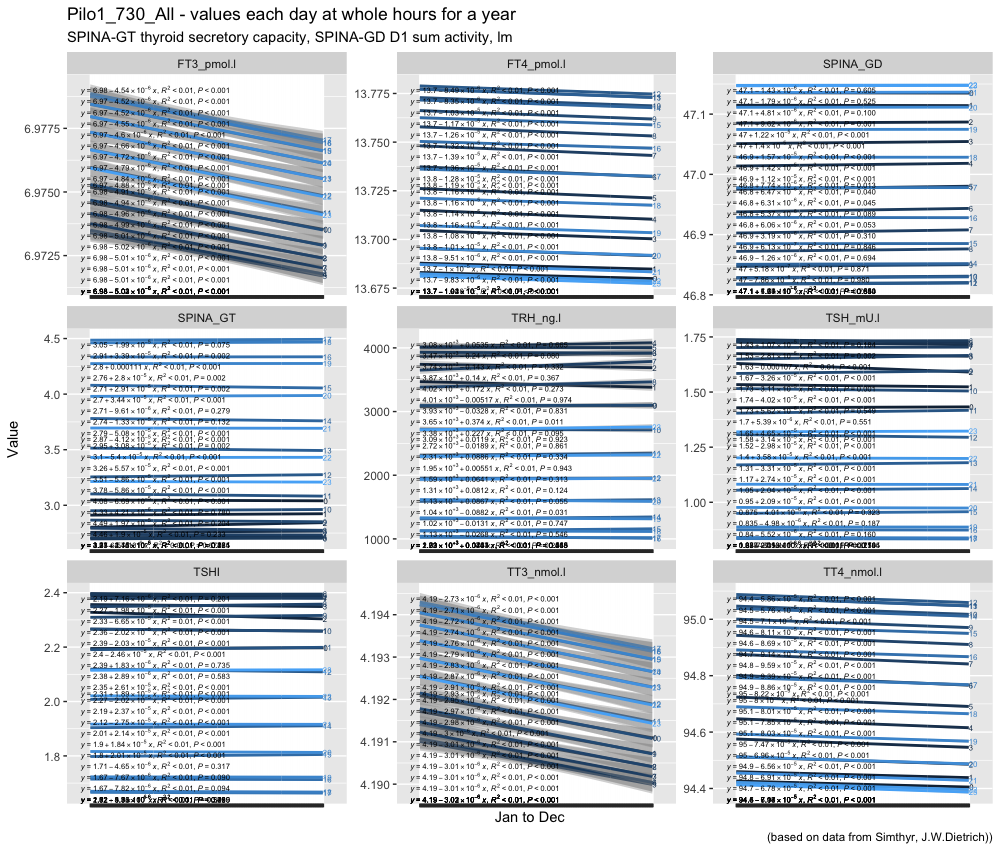
Looking specifically at the three hours normally used for drawing blood for testing TSH, T3 and T4. Again TRH is different from the other values.
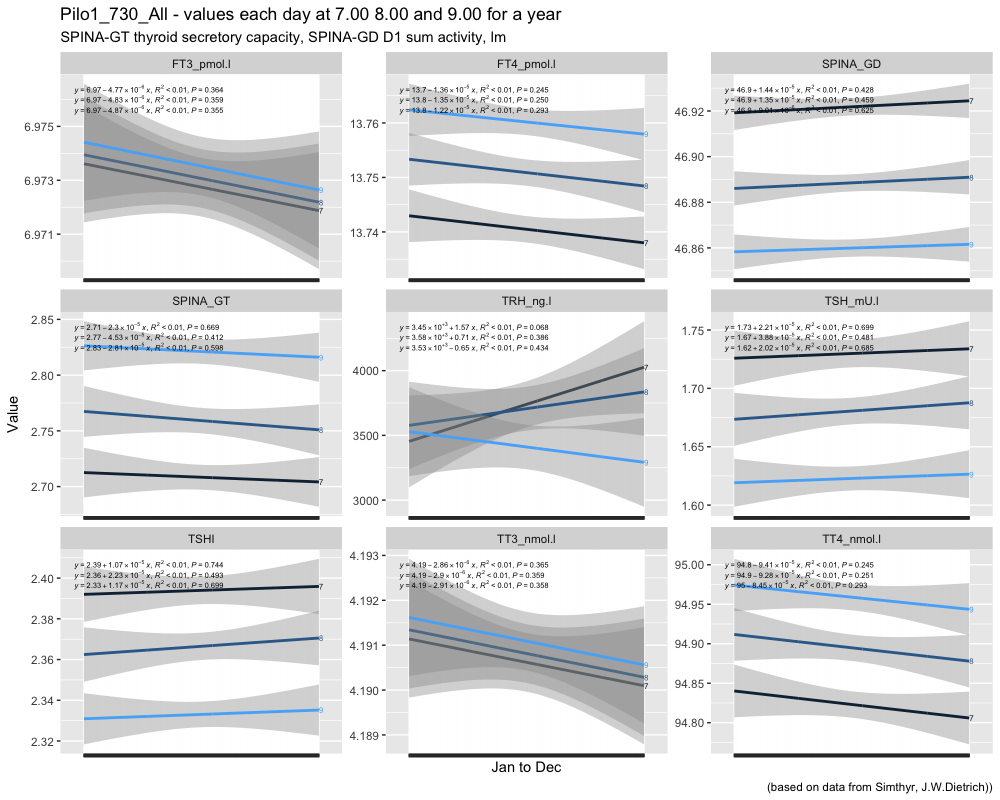
I am not able to explain the differences in P-values from the whole year compared to the three selected hours.
7.00 o’clock TSH compared to TSH (mean whole-year 1,3256) with a one sample t-test:
t = 67.191, df = 364, p-value < 2.2e-16 (0,00000000000000022)
alternative hypothesis: true mean is not equal to 1.3256 (The mean whole-year TSH value)
8.00 o’clock TSH compared to TSH (mean whole-year) with a one sample t-test:
t = 61.288, df = 364, p-value < 2.2e-16
alternative hypothesis: true mean is not equal to 1.3256
9.00 o’clock TSH compared to TSH (mean whole-year) with a one sample t-test:
t = 56.799, df = 364, p-value < 2.2e-16
alternative hypothesis: true mean is not equal to 1.3256
Looking into finding perspectives on the figures I read the Data Science Live Book and experimented with MIME, MIC and MAS. This lead to the following plot based on a sample of 32.000 observations (from a 315.361 obs. from the thyroid hormones during a year). TRH, TSH, TT4, FT4, TT3 and FT3 are shown.
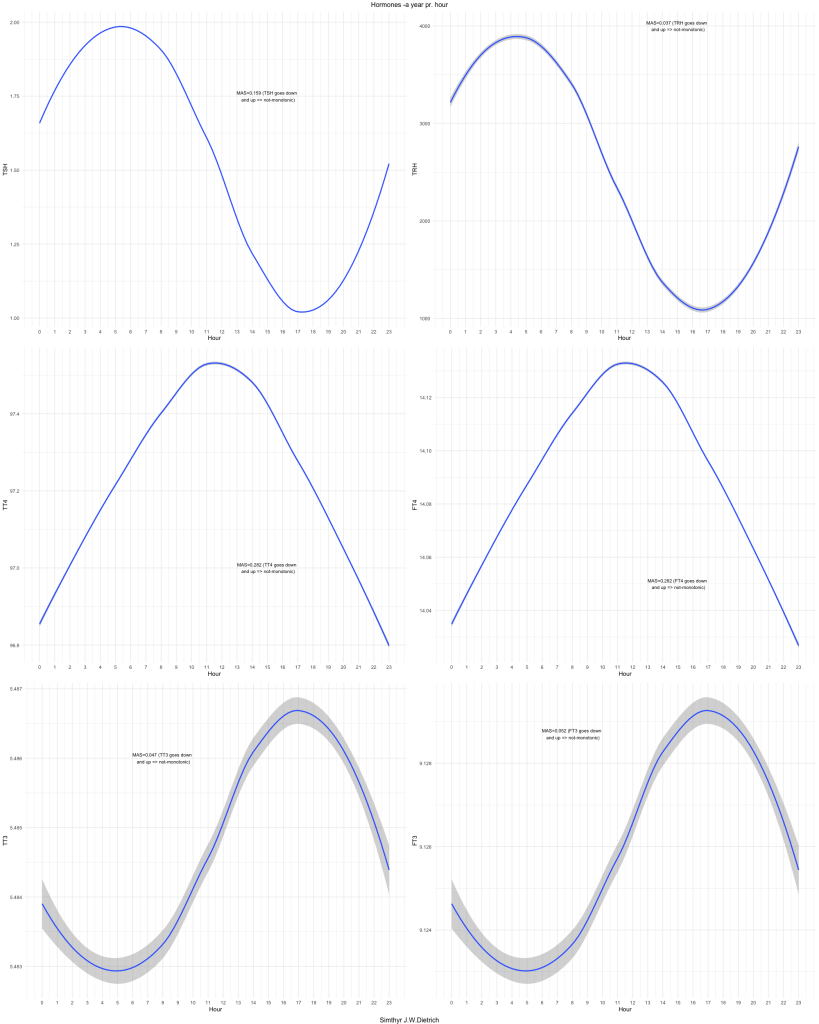
Maximum Asymmetry Score tells you if the figures have one direction (up/down) = monotonic or goes up-down or down up = non-monotonic.
In order to be able to reduce the time for calculation of MAS I have checked the effect of the size of the three different subsets 3.200, 32.000, 315.361:
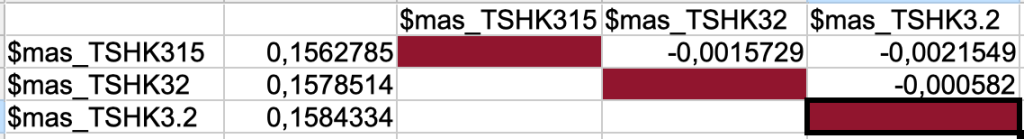
I will for the rest of the plots and calculations use 3.200 as the subset.
(07.01.2022) to be continued…..
Quick overview – DataExplorer
Link: https://www.r-bloggers.com/2021/03/faster-data-exploration-with-dataexplorer/
This R package offers an easy to use method for getting an impression of your data. These data are extracted from a simulation model:
SimThyr is a simulation program for the pituitary thyroid feedback control that is based on a parametrically isomorphic model of the overall system that aims in a better insight into the dynamics of thyrotropic feedback. Applications of this program cover research, including development of hypotheses, and education of students in biology and medicine, nurses and patients.
https://sourceforge.net/p/simthyr/home/SimThyr/
You may find different scenarios build for SimThyr here: https://sourceforge.net/projects/simthyr/files/Scenarios/ This file presented below are taken from these scenarios – Kubota 2.
Data Profiling Report
Basic Statistics
Raw Counts
| Name | Value |
|---|---|
| Rows | 864 |
| Columns | 12 |
| Discrete columns | 1 |
| Continuous columns | 11 |
| All missing columns | 0 |
| Missing observations | 0 |
| Complete Rows | 864 |
| Total observations | 10,368 |
| Memory allocation | 85.7 Kb |
Percentages

Data Structure
Missing Data Profile

Univariate Distribution
Histogram

Bar Chart (with frequency)

QQ Plot


Correlation Analysis
## Warning in dummify(data, maxcat = maxcat): Ignored all discrete
## features since `maxcat` set to 20 categories!
Principal Component Analysis


Q-Q plot – explanation: https://stats.stackexchange.com/questions/101274/how-to-interpret-a-qq-plot