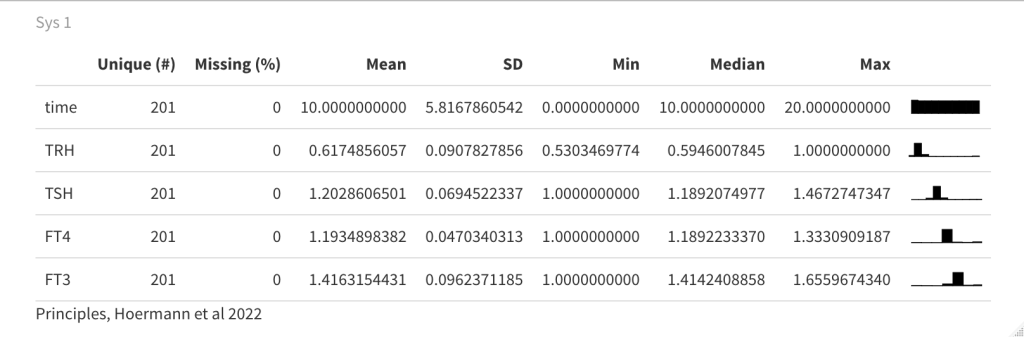
Standard figures from the SimThyr calculation.
Case No. 2 from Kubota et al. showing overt hypothyroidism
Case No. 5 from Kubota et al. showing overt hypothyroidism
modelling
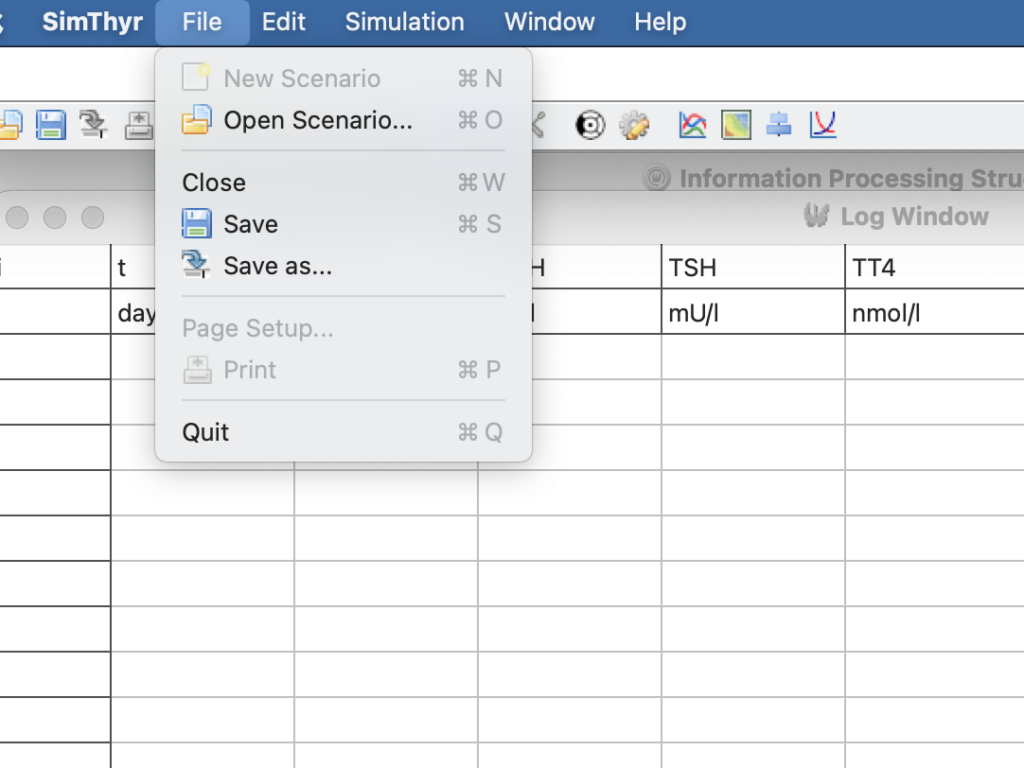
We start by opening SimTHyr v. 4.0.6
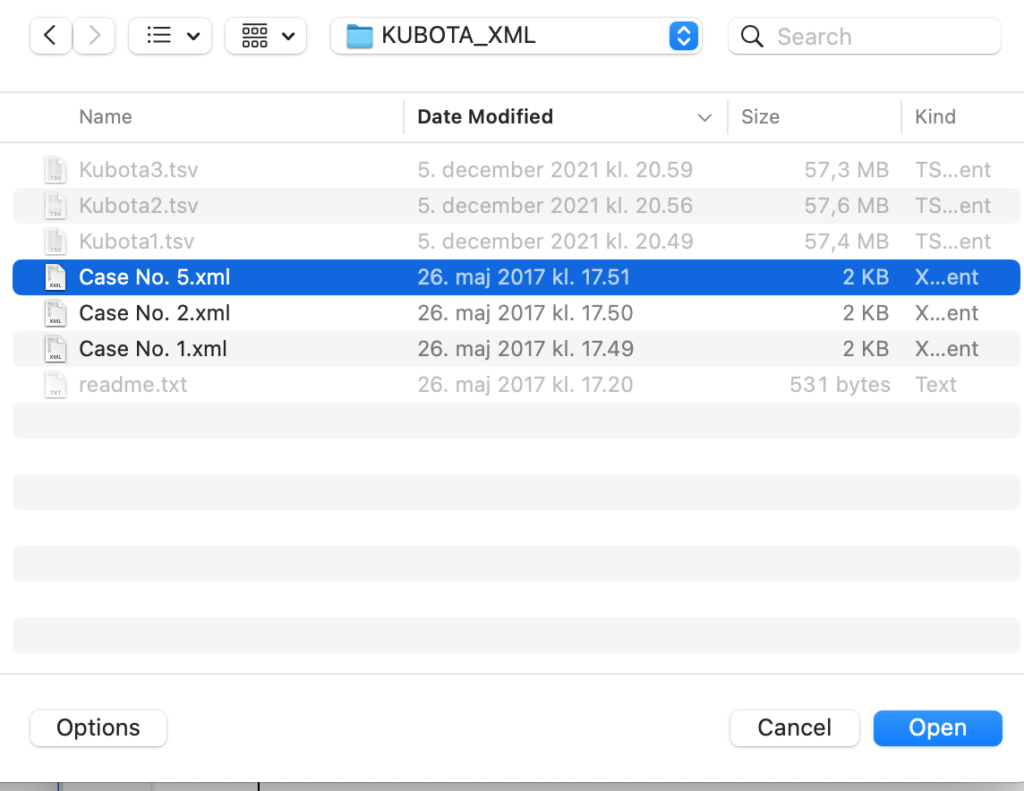
I have downloaded the scenarios as xml files and choose Kubota nr 5
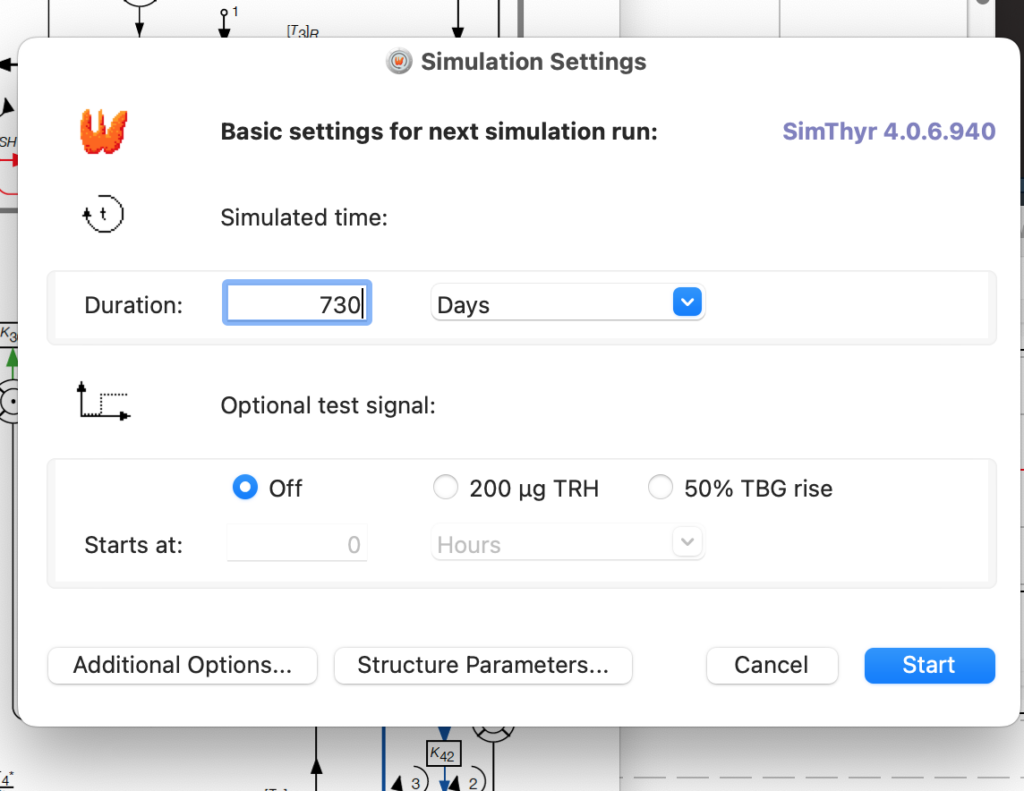
Now the relevant parameters are changed in the model and we can run the scenario
After doing so we can save the results – but before that – a little detour to the Preferences settings.
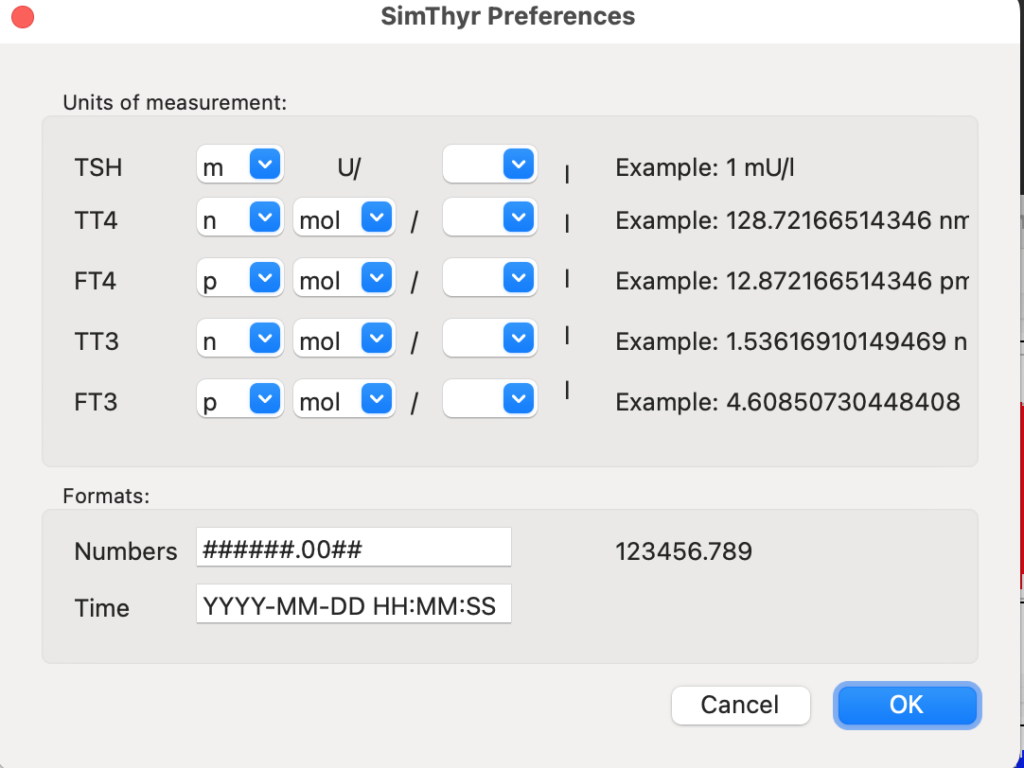
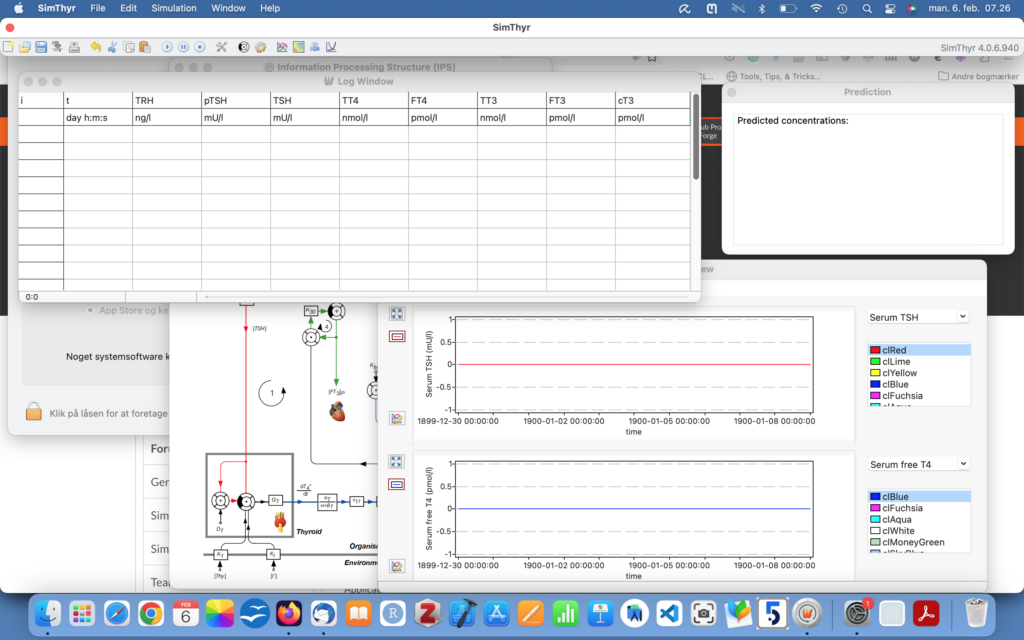
Running the Scenario for 730 days gives this opening image

Then I save it as .tsv and prepare for importing the file into R.
Continues in a Markdown file to be found here: LINK
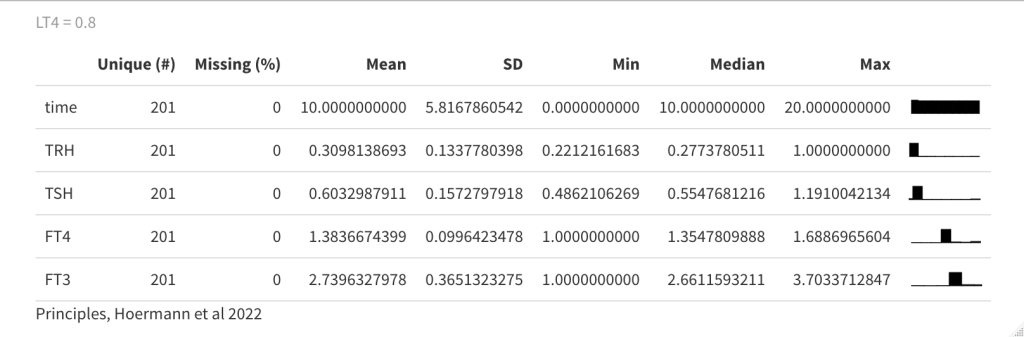
This is a .csv file used for many manipulations in R.
The file covers two years but I have used only the last year. Maybe you will be able to understand why later on.
| NA_1 | i_NA | t_day.h.m.s | date | year | month | day | time | hour | minute | second | TRH_ng.l | pTSH_mU.l | TSH_mU.l | TT4_nmol.l | FT4_pmol.l | TT3_nmol.l | FT3_pmol.l | cT3_pmol.l | X_NA | ratio | TSH_Sum | TSH_TSH_Sum | SPINA_GT | SPINA_GD | TSHI | TRH_TSH | TT4_FT4 | TT3_FT3 | sqrtTSH | sqrtTRH | sqrtFT4 | sqrtFT3 | sqrtTT4 | |
|---|---|---|---|---|---|---|---|---|---|---|---|---|---|---|---|---|---|---|---|---|---|---|---|---|---|---|---|---|---|---|---|---|---|---|
| 1 | 3 | 2 | 1900-01-01 00:01:40 | 1900-01-01 | 1900 | 01 | 01 | 00:01:40 | 00 | 01 | 40 | 3181.7579 | 4 | 1.8138 | 121.9379 | 17.6696 | 3.2158 | 5.3507 | 11693.749 | NA | 0.302819531851315 | 13.523488 | 0.134122202792652 | 3.37496005632224 | 28.0001492590831 | 2.97198529203133 | 1754.19445363326 | 6.90099945669398 | 0.601005475919039 | 1.34677392312147 | 56.4070731380383 | 4.20352233252067 | 2.31315801449015 | 11.0425495244531 |
| 2 | 4 | 3 | 1900-01-01 00:03:20 | 1900-01-01 | 1900 | 01 | 01 | 00:03:20 | 00 | 03 | 20 | 4029.9948 | 4 | 1.8011 | 121.9379 | 17.6696 | 3.2158 | 5.3507 | 11693.749 | NA | 0.302819531851315 | 13.523488 | 0.133183095958676 | 3.38929977468556 | 28.0001492590831 | 2.96495878936087 | 2237.51862750541 | 6.90099945669398 | 0.601005475919039 | 1.34205066968427 | 63.482240036092 | 4.20352233252067 | 2.31315801449015 | 11.0425495244531 |
| 3 | 5 | 4 | 1900-01-01 00:05:00 | 1900-01-01 | 1900 | 01 | 01 | 00:05:00 | 00 | 05 | 00 | 3443.9415 | 4 | 1.7948 | 121.9379 | 17.6696 | 3.2158 | 5.3507 | 11693.749 | NA | 0.302819531851315 | 13.523488 | 0.132717239812687 | 3.39648848175333 | 28.0001492590831 | 2.96145479511969 | 1918.84416090929 | 6.90099945669398 | 0.601005475919039 | 1.33970145928113 | 58.6851045837016 | 4.20352233252067 | 2.31315801449015 | 11.0425495244531 |
| 4 | 6 | 5 | 1900-01-01 00:06:40 | 1900-01-01 | 1900 | 01 | 01 | 00:06:40 | 00 | 06 | 40 | 1199.1919 | 4 | 1.7845 | 121.9379 | 17.6696 | 3.2158 | 5.3507 | 11693.749 | NA | 0.302819531851315 | 13.523488 | 0.131955601986706 | 3.40835077718868 | 28.0001492590831 | 2.95569946394808 | 672.004427010367 | 6.90099945669398 | 0.601005475919039 | 1.3358517881861 | 34.6293502682335 | 4.20352233252067 | 2.31315801449015 | 11.0425495244531 |
| 5 | 7 | 6 | 1900-01-01 00:08:20 | 1900-01-01 | 1900 | 01 | 01 | 00:08:20 | 00 | 08 | 20 | 3763.4079 | 4 | 1.7558 | 121.9379 | 17.6696 | 3.2158 | 5.3507 | 11693.749 | NA | 0.302819531851315 | 13.523488 | 0.129833368432759 | 3.44213815003558 | 28.0001492590831 | 2.93948579350997 | 2143.41491058207 | 6.90099945669398 | 0.601005475919039 | 1.32506603609028 | 61.3466209338379 | 4.20352233252067 | 2.31315801449015 | 11.0425495244531 |
| 6 | 8 | 7 | 1900-01-01 00:10:00 | 1900-01-01 | 1900 | 01 | 01 | 00:10:00 | 00 | 10 | 00 | 5208.548 | 4 | 1.7487 | 121.9378 | 17.6696 | 3.2158 | 5.3507 | 11693.749 | NA | 0.302819531851315 | 13.523488 | 0.129308355950772 | 3.45066781786054 | 28.0001492590831 | 2.93543385473748 | 2978.52576199462 | 6.90099379725631 | 0.601005475919039 | 1.32238421043205 | 72.1702708876723 | 4.20352233252067 | 2.31315801449015 | 11.0425449965124 |
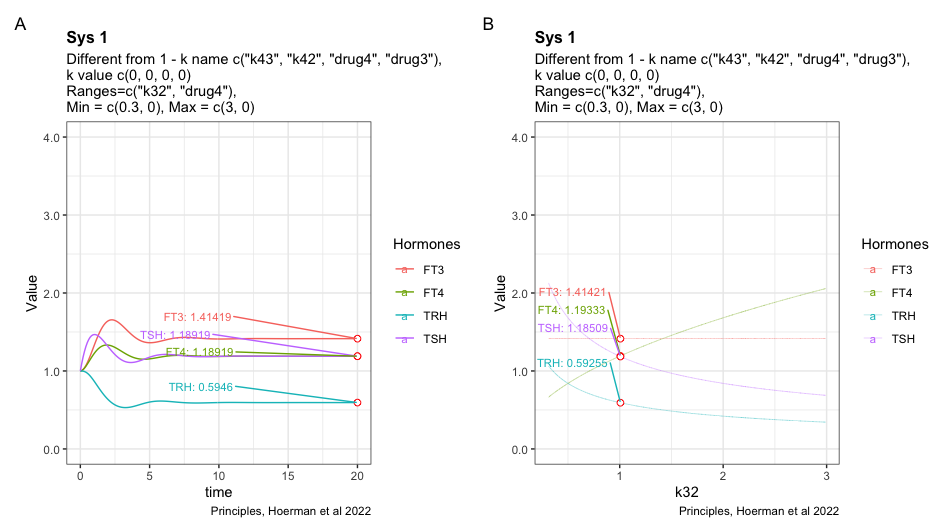
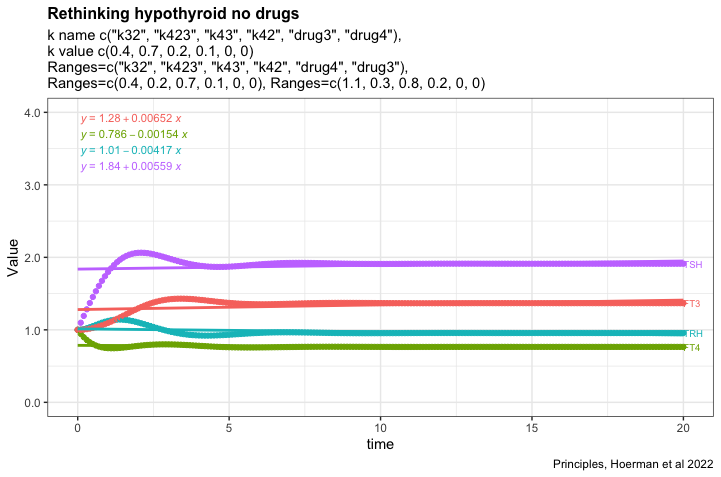
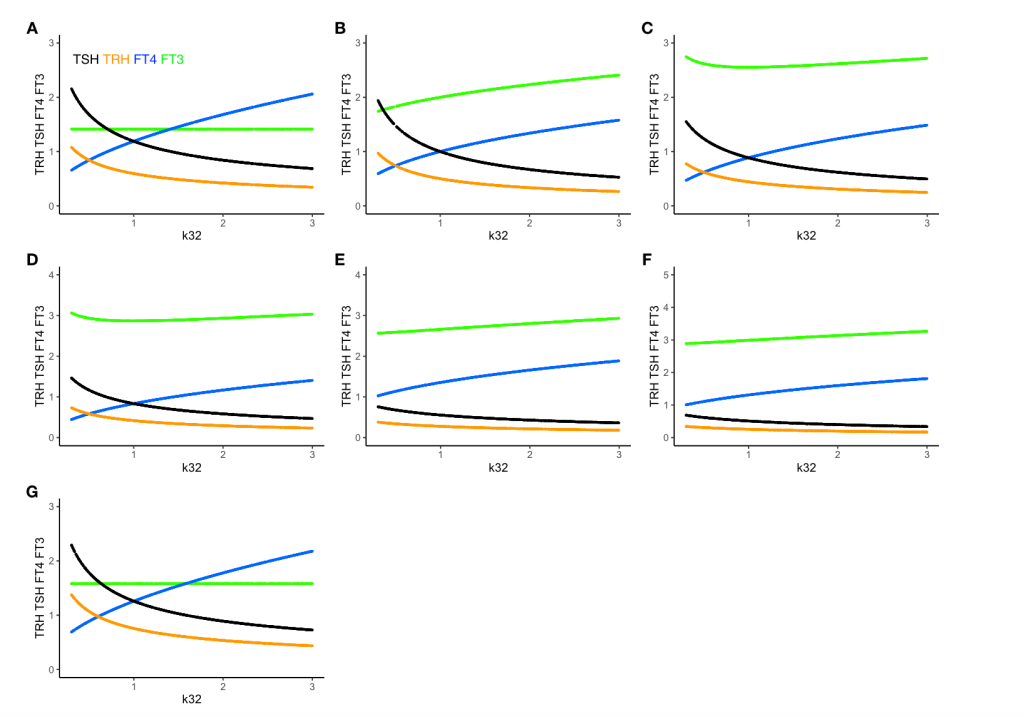
I would like to know how hypothyroid the model can get when the different parameters from fig. 6. A in Principles, Hoermann et al 2022.
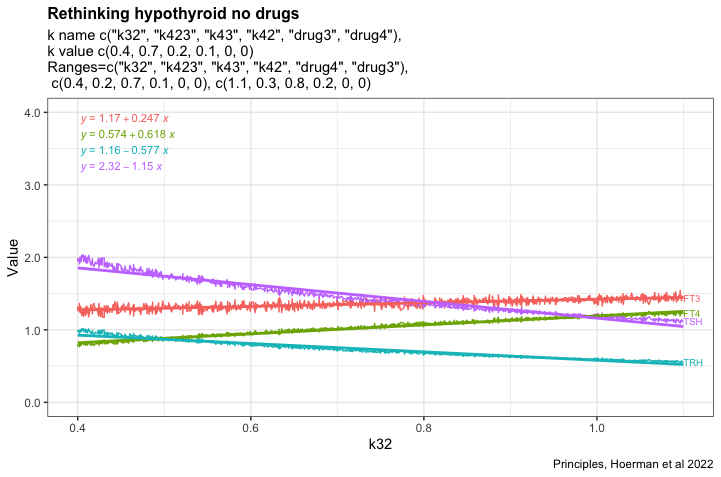
Recap text from fig. 6. A: FT4 levels (blue curve) decline, but the mechanisms in system (sys. 10) protect FT3 levels (green curve), keeping them in a range close to the original level, as the percentage of the estimate of FT4 production rate constant (k32 = 0.4 to 1.1) decreases – as typical at the onset of hypothyroidism in patients suffering from autoimmune thyroiditis and progressive thyroid destruction. Other parameters are chosen within ranges, k423 = 0.2-0.3, k43 = 0.7-0.8 and k42 = 0.1-0.2, to approximate the relative contributions to FT3 production according to (32).
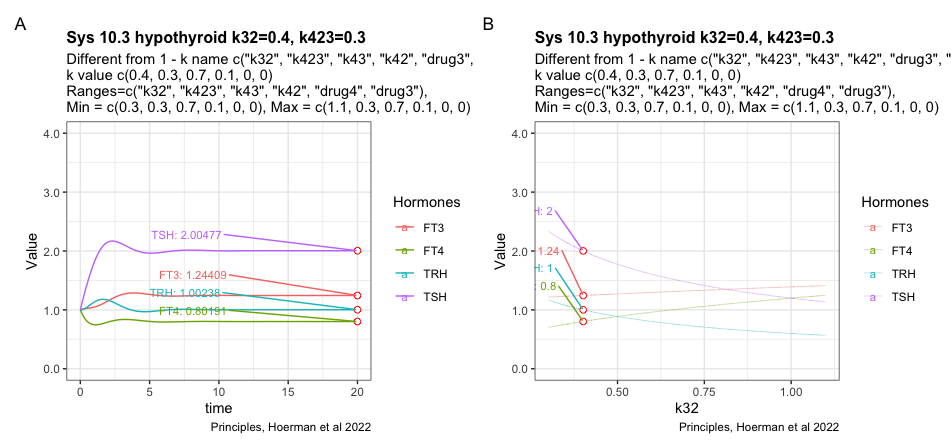
The figures shows the most hypothyroid state the model can achieve under the given conditions.
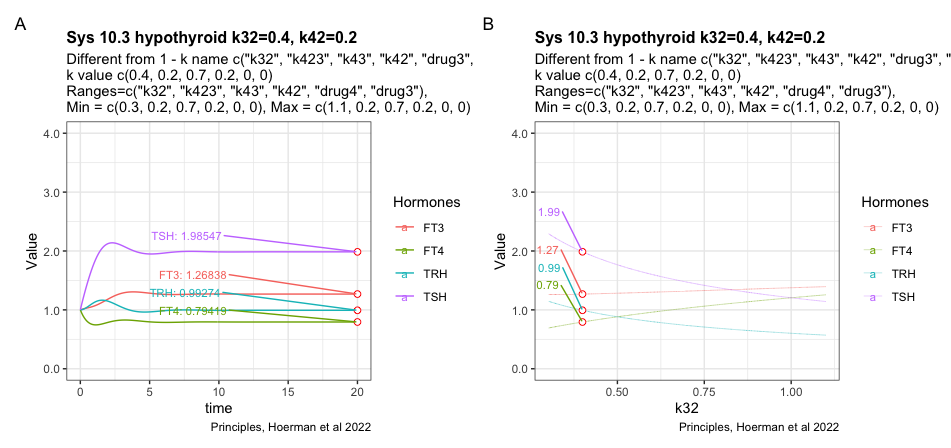
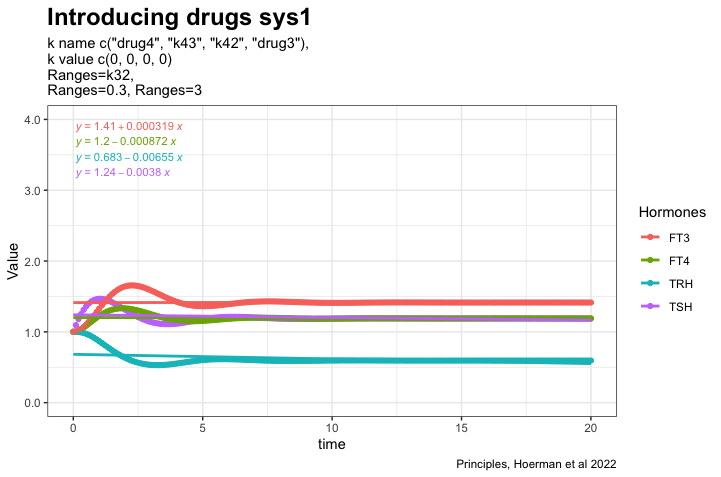
Trying to change the k42 parameter which results in a slight decrease of TSH
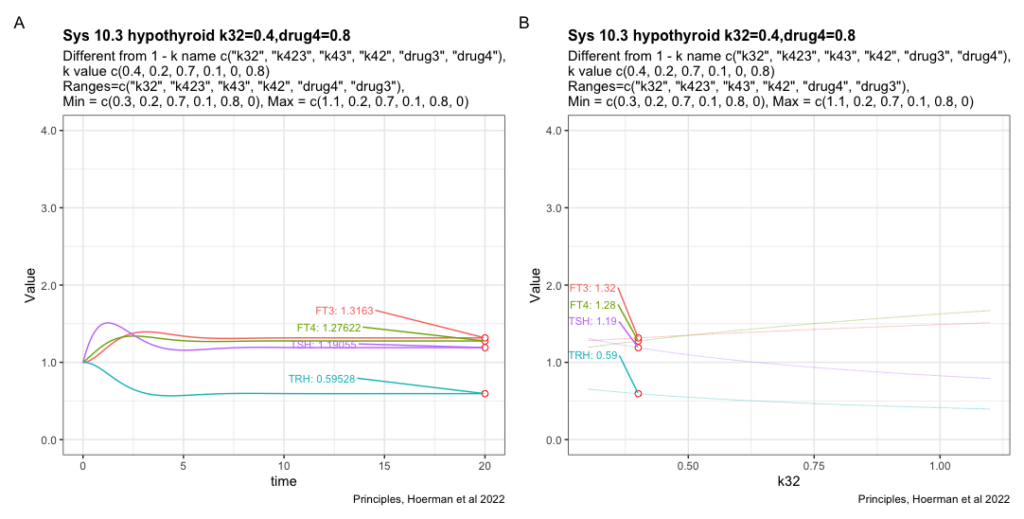
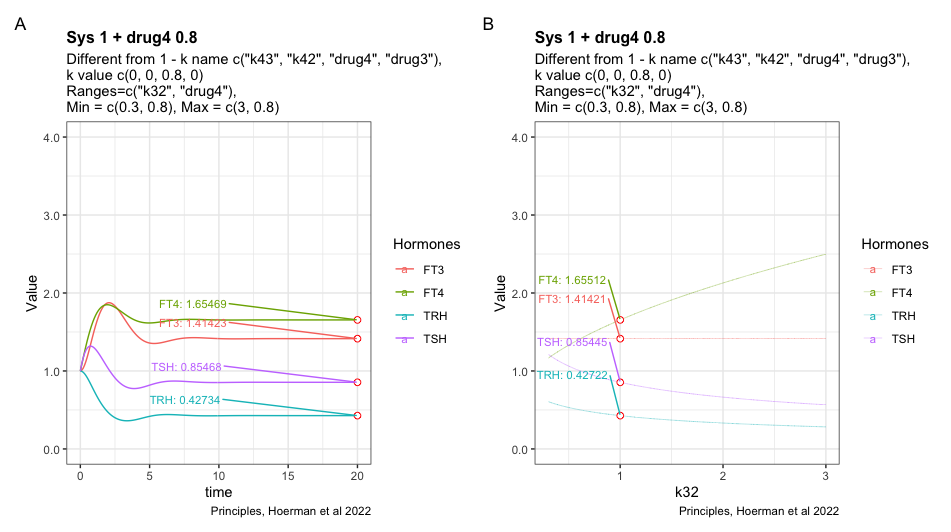
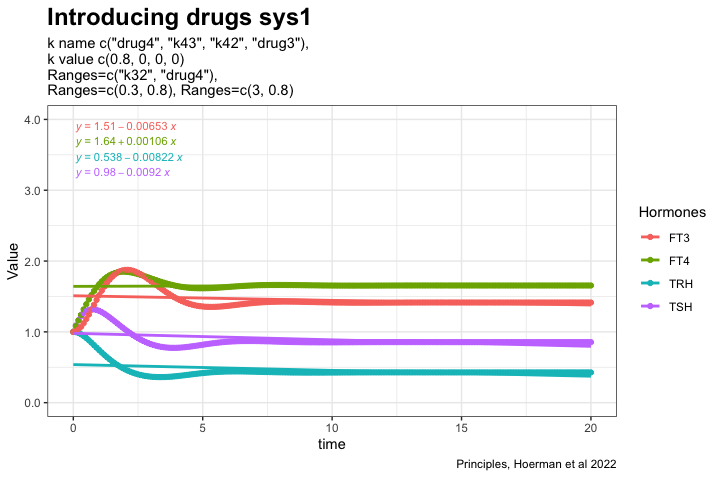
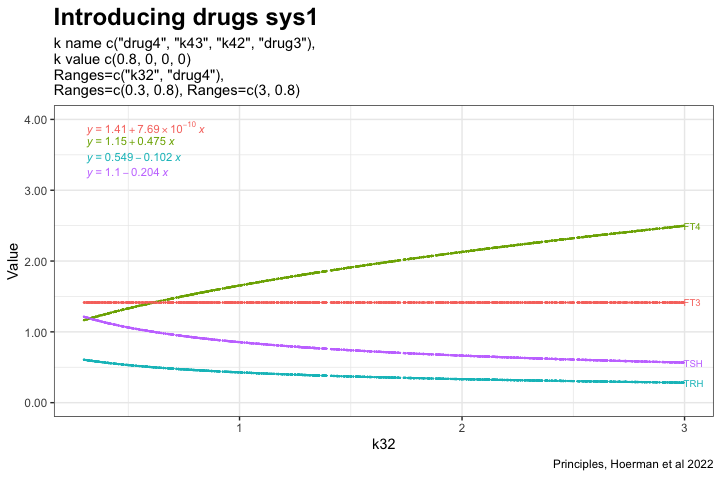
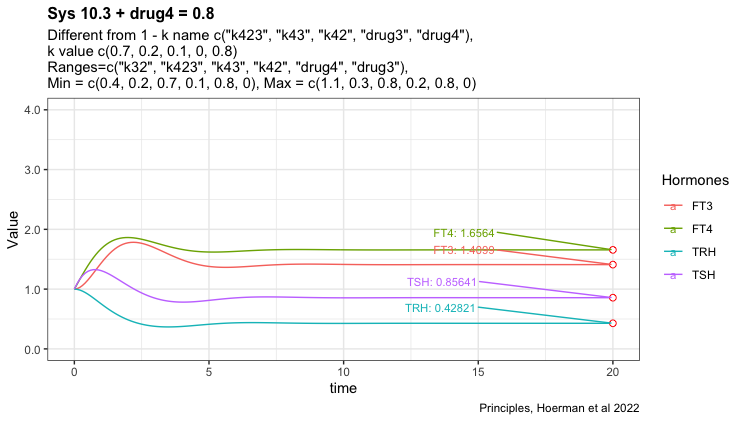
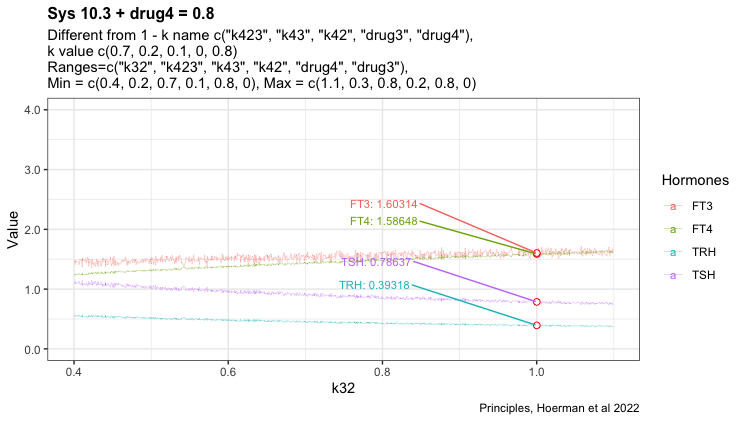
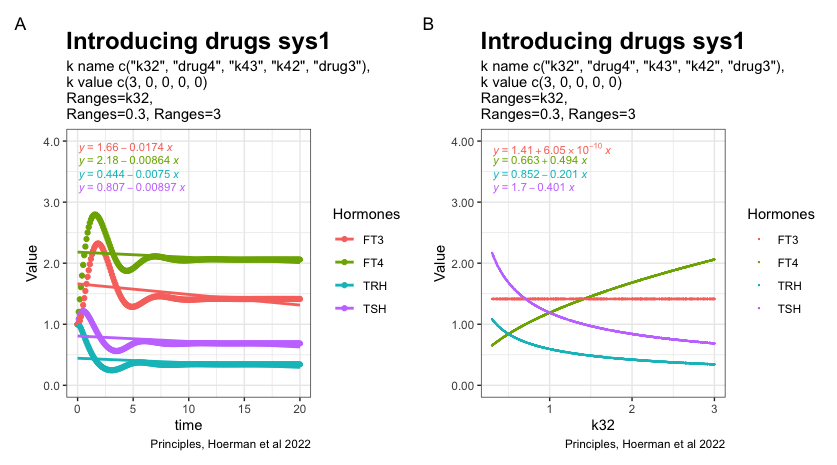
Adding drug4 = 0.8 to the most hypothyroid state. We see FT3 is not returning to the level in the perfect homeostasis. See sys1 below. Apart from that FT3 drops with lower k32.
Here I have tried to show the pattern following perfect homeostasis plus drug4. Mimicing the situation where a patient gets unnecessary LT-4 treatment. Will it be possible to identify the pattern and use it to get the patient off LT-4? Is the pattern disguised by the transformation to real hormone values?
These plots are based on a theoretical model developed by Hoerman et al 2022. The changes in the figures are mine and not discussed with the creators – so I and not the authors are to blame for any error. I would like to show two citations from Rethinking Hypothyroidism, written by A. Bianco.
These two plots illustrate perfect homeostasis
Here I have added L-T4 to the perfect homeostasis illustrating the hormone pattern in a situation where there is no need for L-T4. The gap between TSH/FT4 widens. (~1/3 is getting unnecessary L-T4 treatment. From Rethinking Hypothyroidism, A. Bianco 2022)
Introducing a hypothyroid pattern – TSH increases
L-T4 is added to the hypothyroid pattern and we see that L-T4 treatment is not restoring FT3 although TSH is normalized. ( “Once TSH had normalized, the metabolic rate had not,” from Rethinking Hypothyroidism, A. Bianco 2022)
Is it possible to identify those patients who are not hypothyroid but is treated with L-T4 by the changed hormone pattern? In the perfect homeostasis scenario, the ratio FT4/TSH is close to one whereas in the perfect homeostasis with added LT4 the ratio looks close to 1.5. In the L-T4-treated hypothyroid pattern, the ratio is a little above one.
Will converting the hormone figures to standard values obscure the pattern?
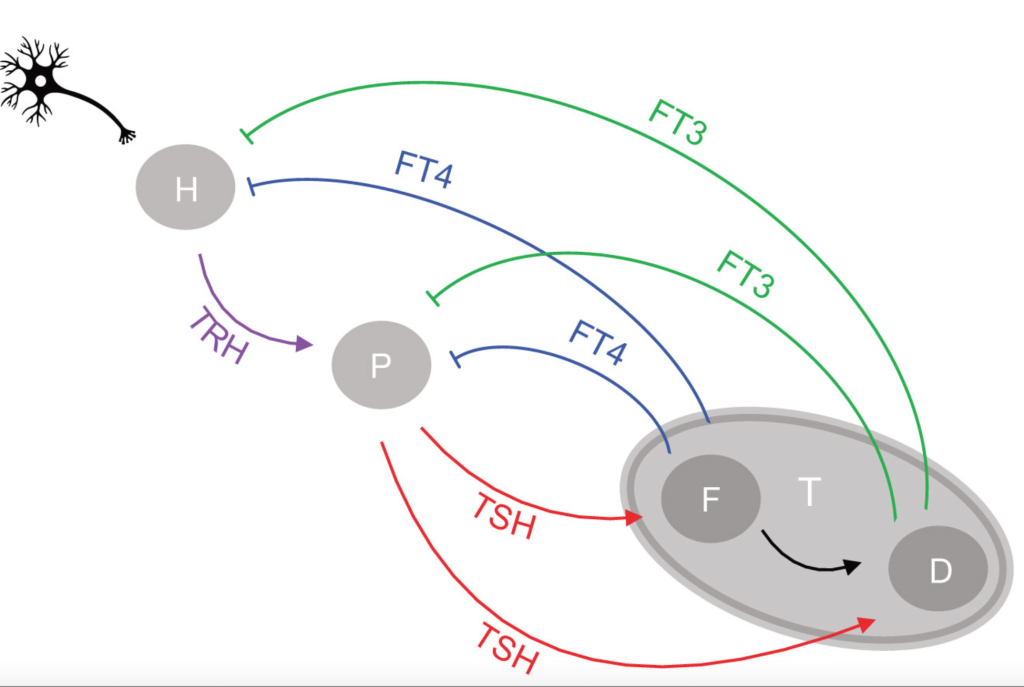
In the article: “Principles of Endocrine Regulation: Reconciling Tensions Between Robustness in Performance and Adaptation to Change.” (Ref.1) the authors describe how their mathematical model can describe perfect homeostasis. The patterns of TRH, TSH, FT3 and FT4 are plotted. The FT3 value is preserved whatever changes in the other hormones.
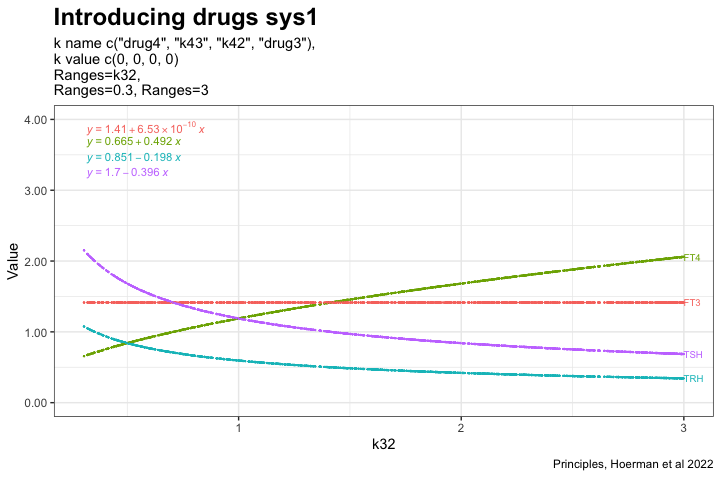
In the next two plots, the K32* is changed to 0.3 and 3. Changes in the patterns between the three hormones TSH, FT4 and TRH.
Redefinition of FT3 reference ranges?
All comments here are all theoretical and based on a complicated mathematical model.
Proceeding from page 10 in the supplementary material for:
Hoermann R, Pekker MJ, Midgley JEM, Larisch R and Dietrich JW (2022)
Principles of Endocrine Regulation: Reconciling Tensions Between Robustness in Performance and Adaptation to Change.
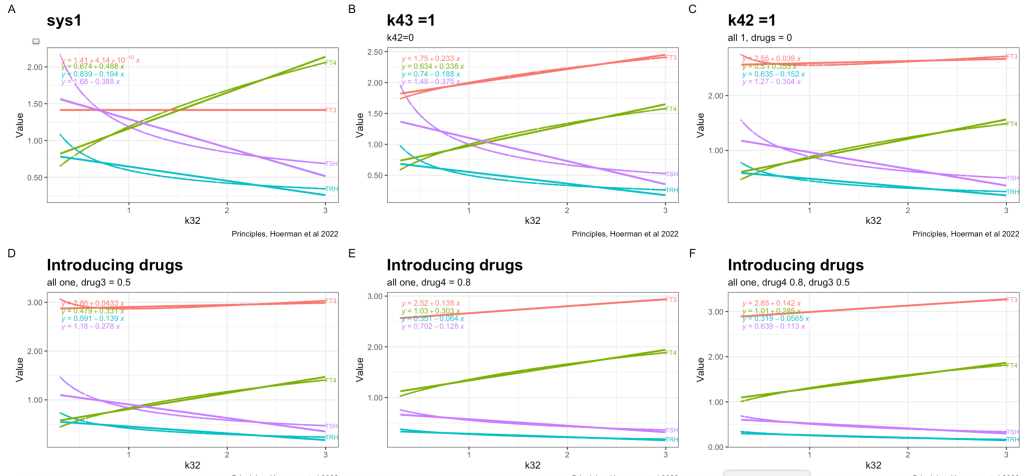
Front. Endocrinol. 13:825107. doi: 10.3389/fendo.2022.825107 – I look at the two equations for sys1 and multiple systems.
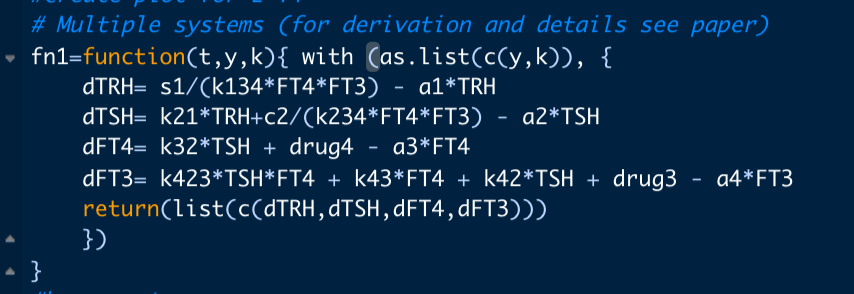
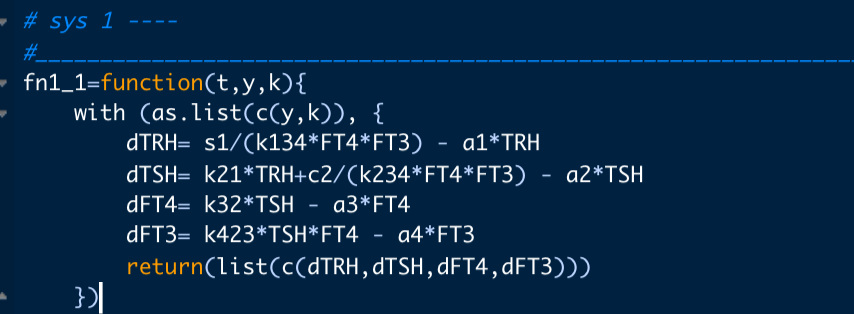
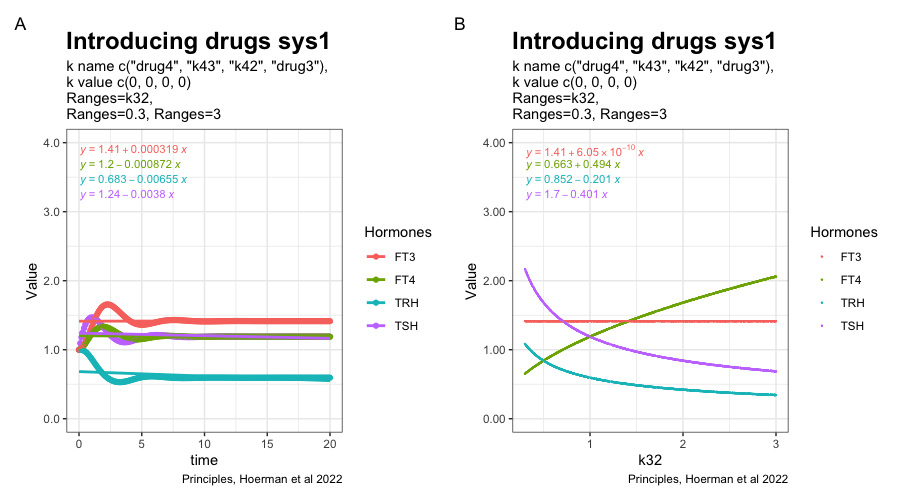
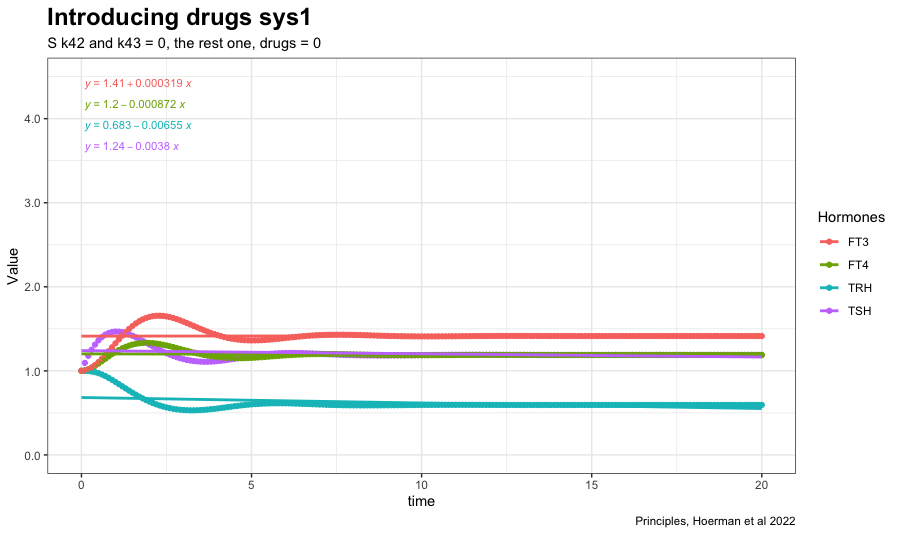
The two parameters k43, k42, drug4 and drug3 are set to zero in the multiple systems equation. Making the result of the two equations the same. This equals fig. 4a in the article.
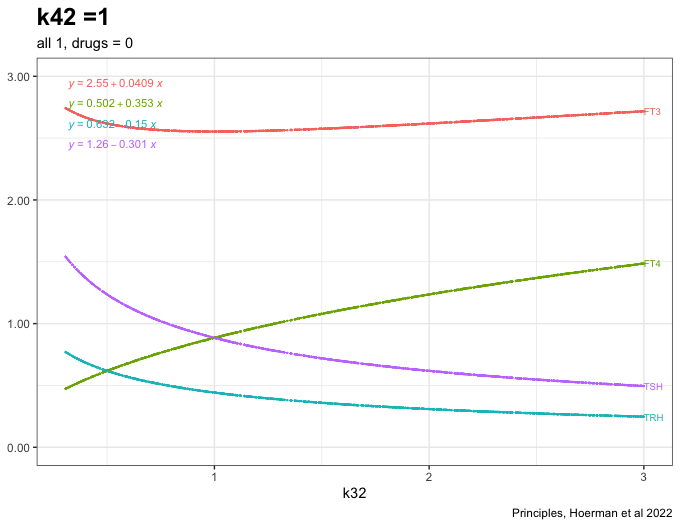
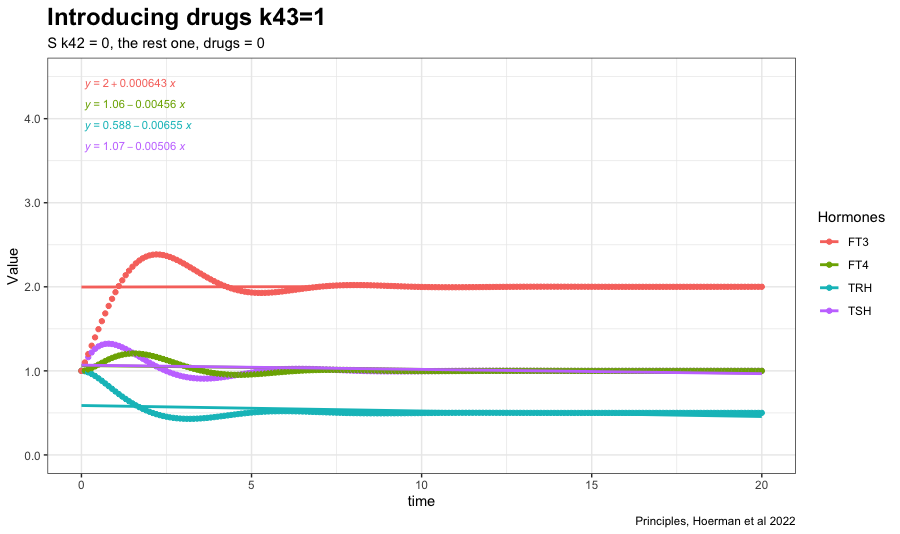
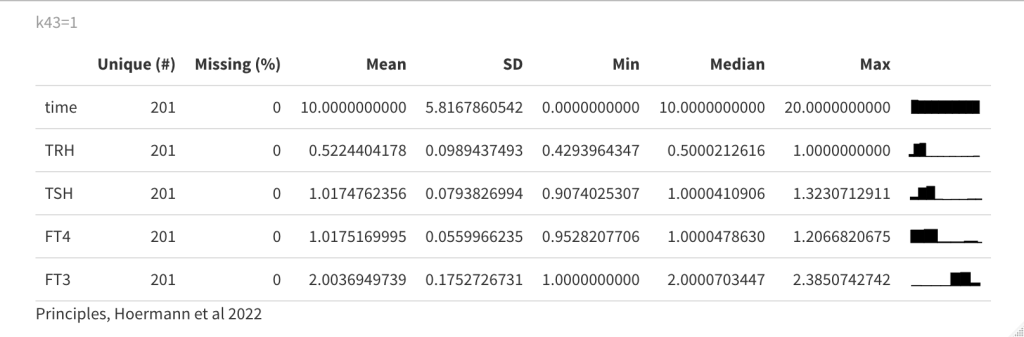
In sys. 9 k43 is changed to 1. (k43 increases the FT3 production rate // the FT3 production rate constant of peripheral organs account for non-thyroidal peripheral FT3 production (by adding the term k43*[FT4]) which physiologically depends on FT4, but not on TSH). See fig. 4b in the article.
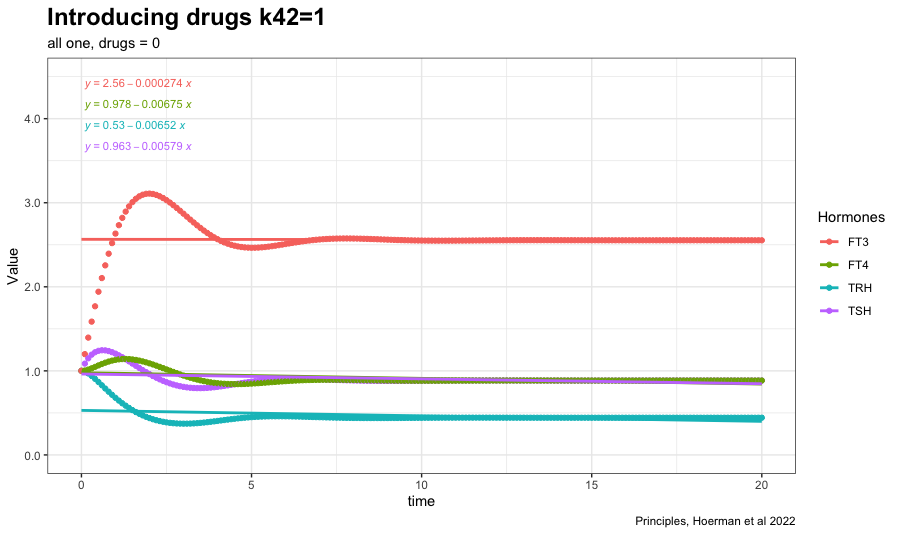
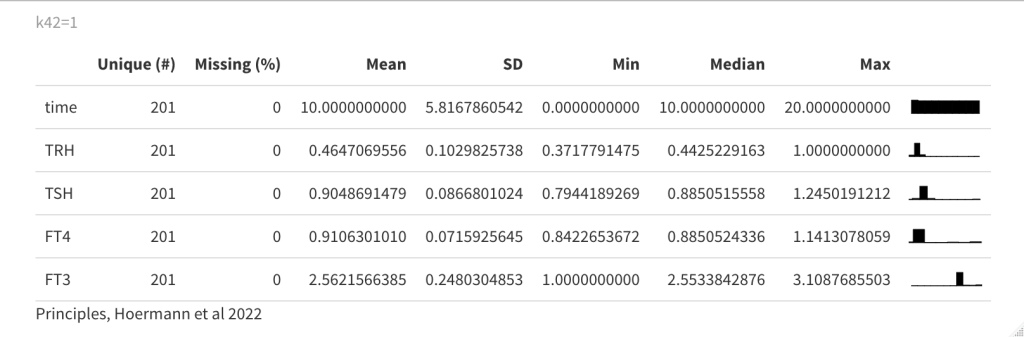
Changing k42 to one increases FT3 further. (The TSH feedforward on FT3 is switched on (k42 = 1)). The other hormones decreases. The TSH FT4 values follow each other closely. See fig. 4c in the article.
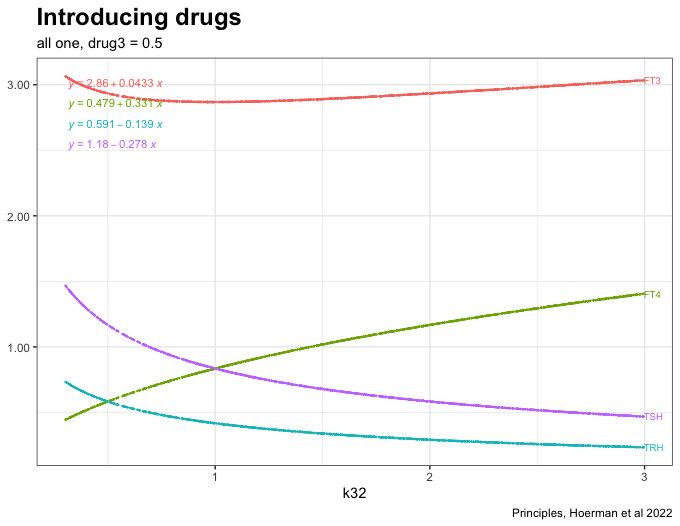
Now a drug is introduced (drug3=0.5) in the equation which gives the following result:
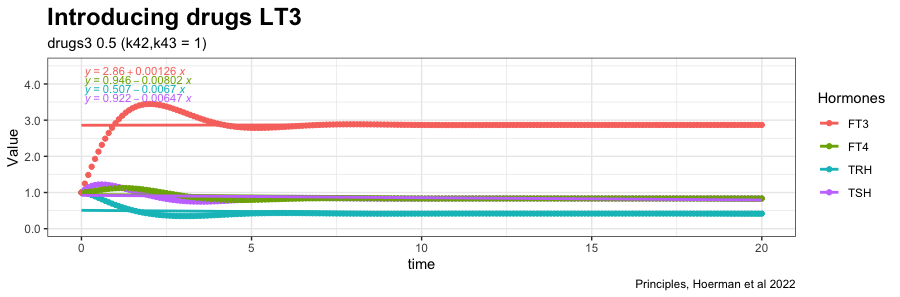
See fig. 4d in the article and the comments.
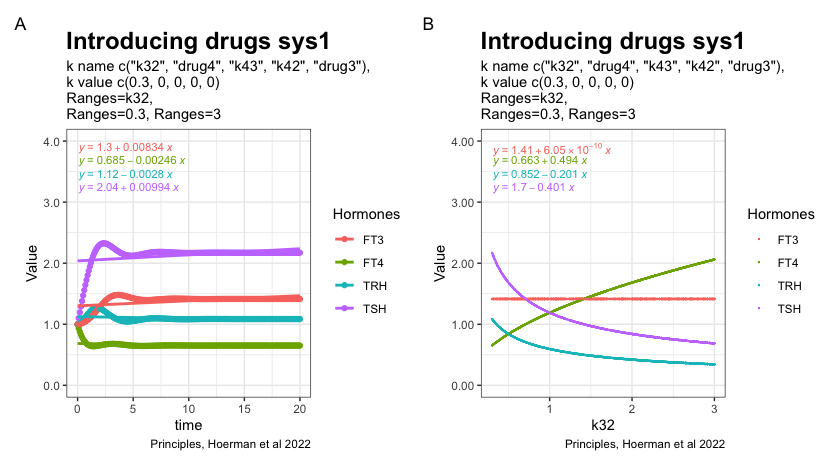
In the next plot drug3=0.5 (LT3) is replaced by drug4=0.8 (LT4) in the equation, which affects the TSH and FT4 values:
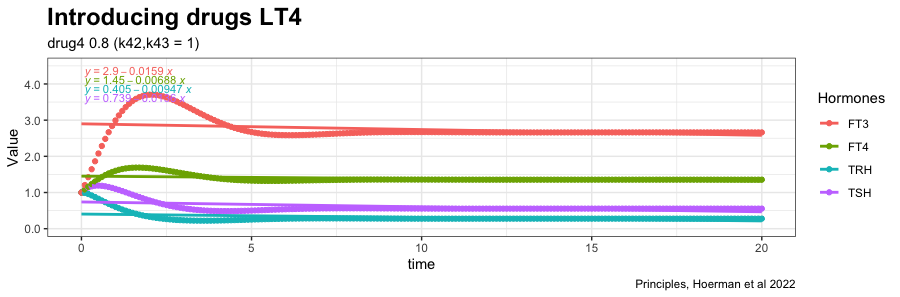
The distance between FT4 and TSH is increased. In the earlier plots, FT4 and TSH were almost in the same line with no spread.
Next, I will reproduce fig. 4 from the article as a test of the R-script:
The FT4 production rate parameter k32, is the proportionality constant positive feedforward of TSH onto FT4 (downstream, activating)