GT

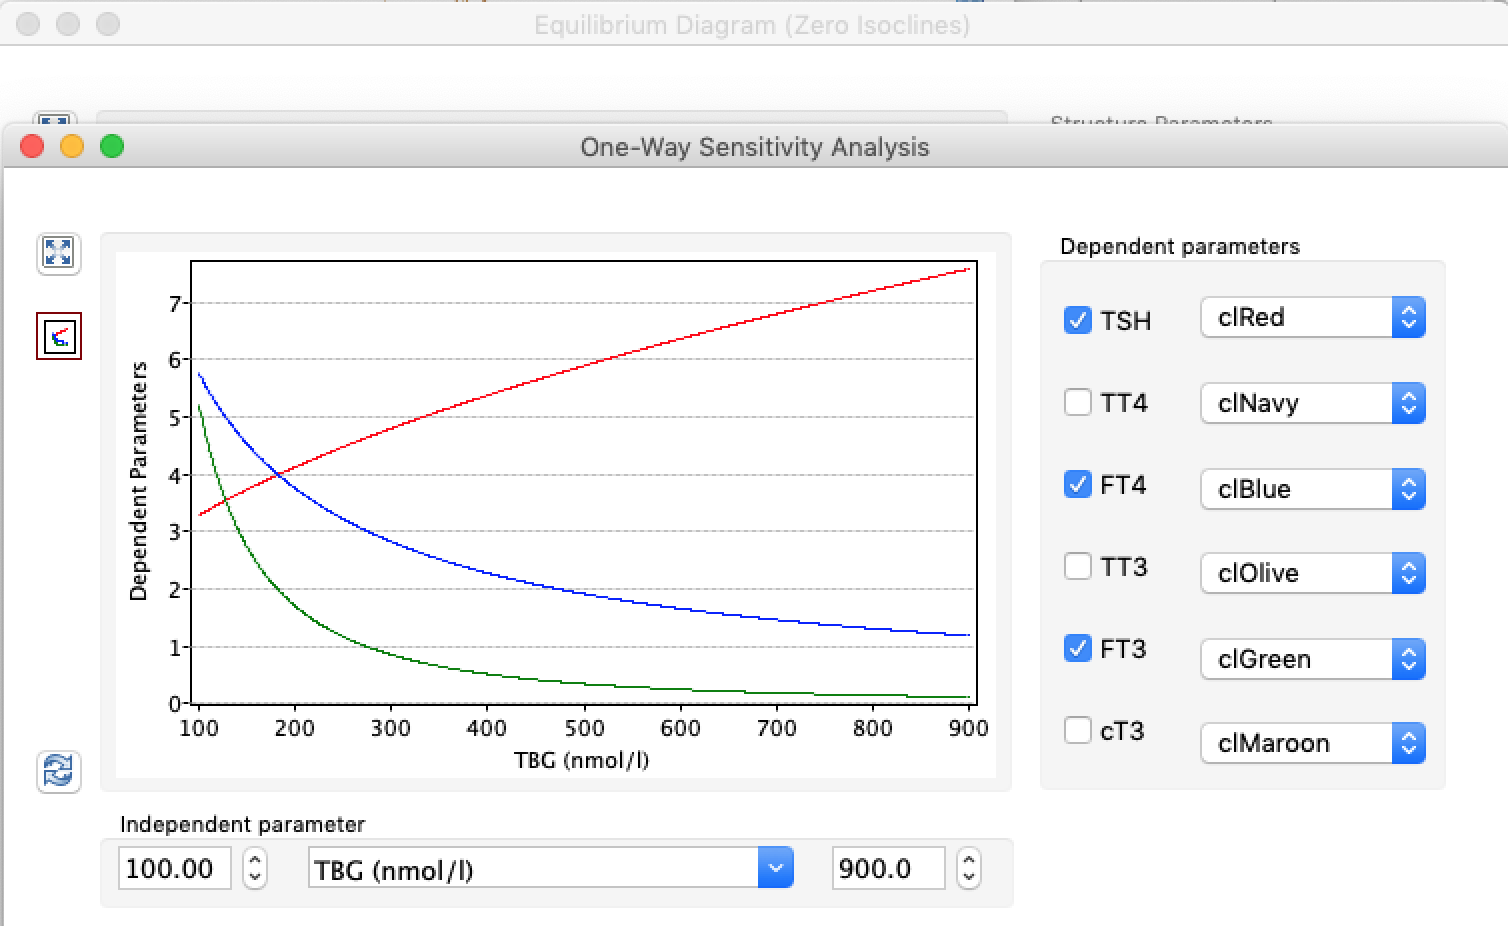
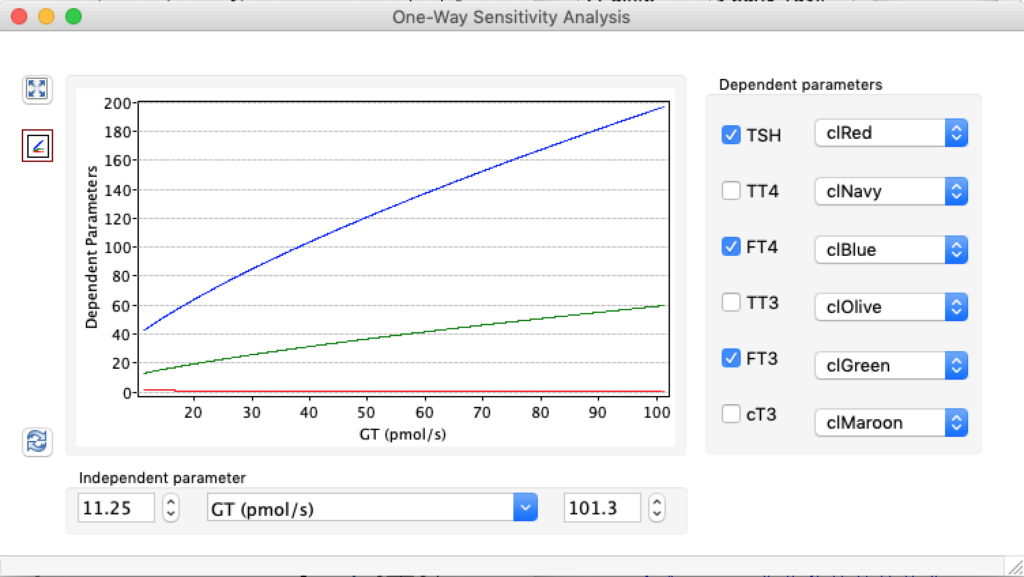
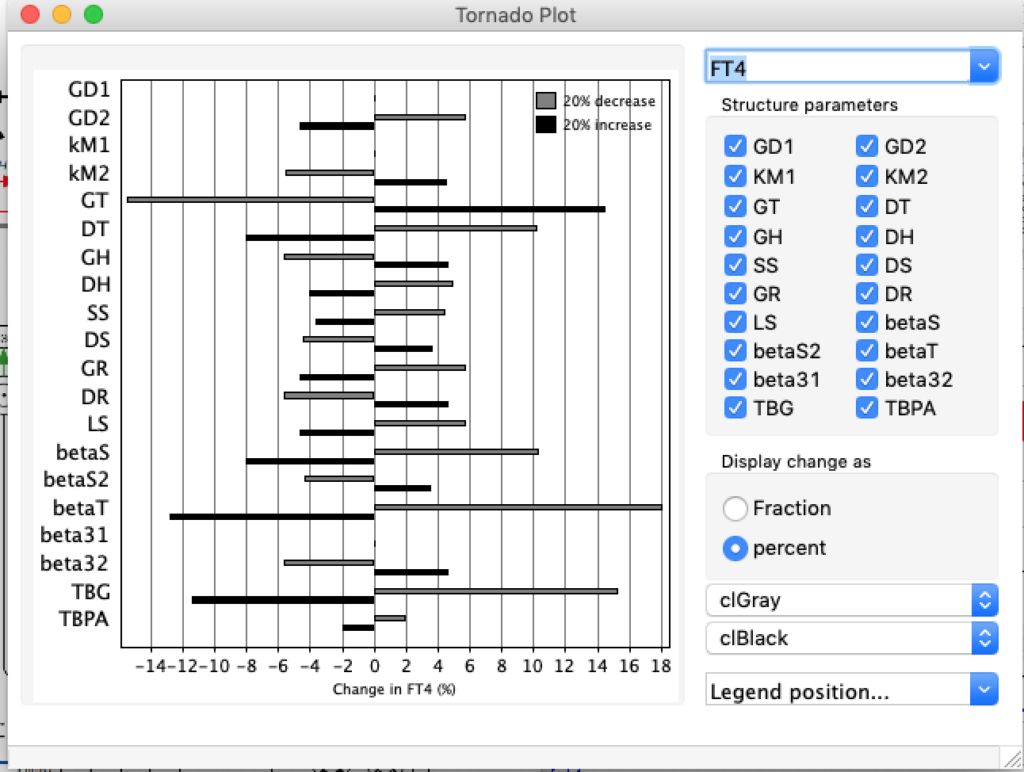
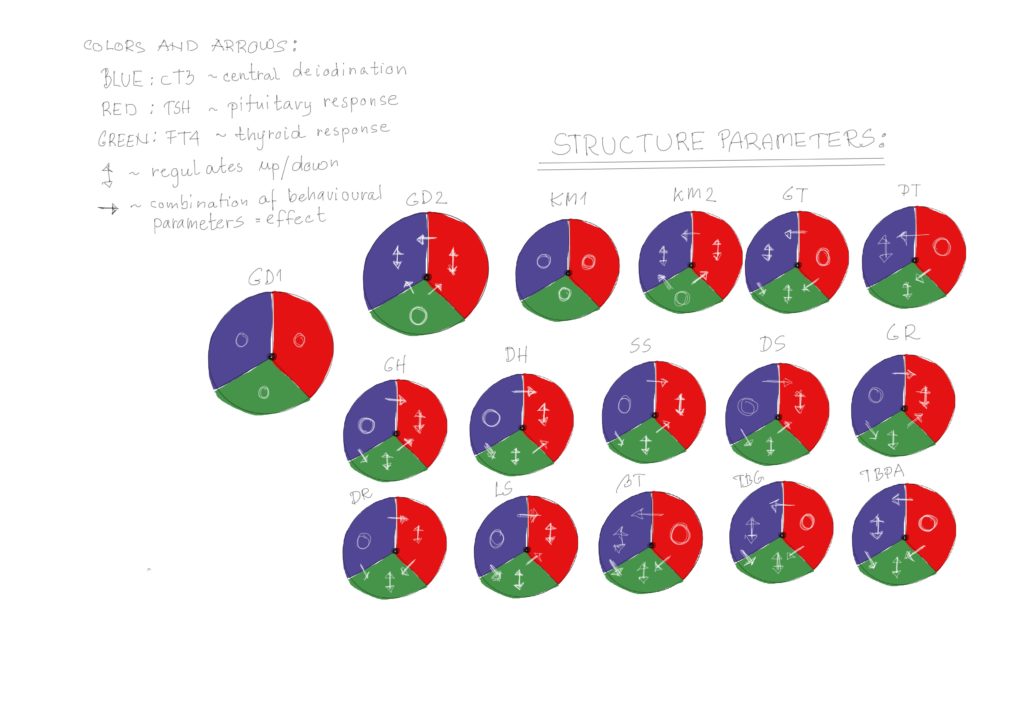
The thyroid secretes T4 and T3 – and GT is a central parameter in the SimThyr model.

GT has been observed to correlate with thyroid volume as determined by ultrasonography and to be elevated in hyperthyroidism and reduced in hypothyroidism [11, 116].
Recently, a small study that has been published as an abstract revealed calculating GT to be beneficial in differential diagnosis of NTIS with thyrotropic adaptation and latent (subclinical) hyperthyroidism.
This feedback loop might prevent excessively high TSH levels and also be a source of TSH pulsatility, as suggested by investigations based on fractal geometry [49].
The existence of this loop may be a challenge for interpretation of laboratory results, especially in patients with Graves’ disease, where TRAbs may suppress TSH secretion independently from current FT4 levels [50] resulting in TSH levels being lower than expected in relation to current FT4 levels.

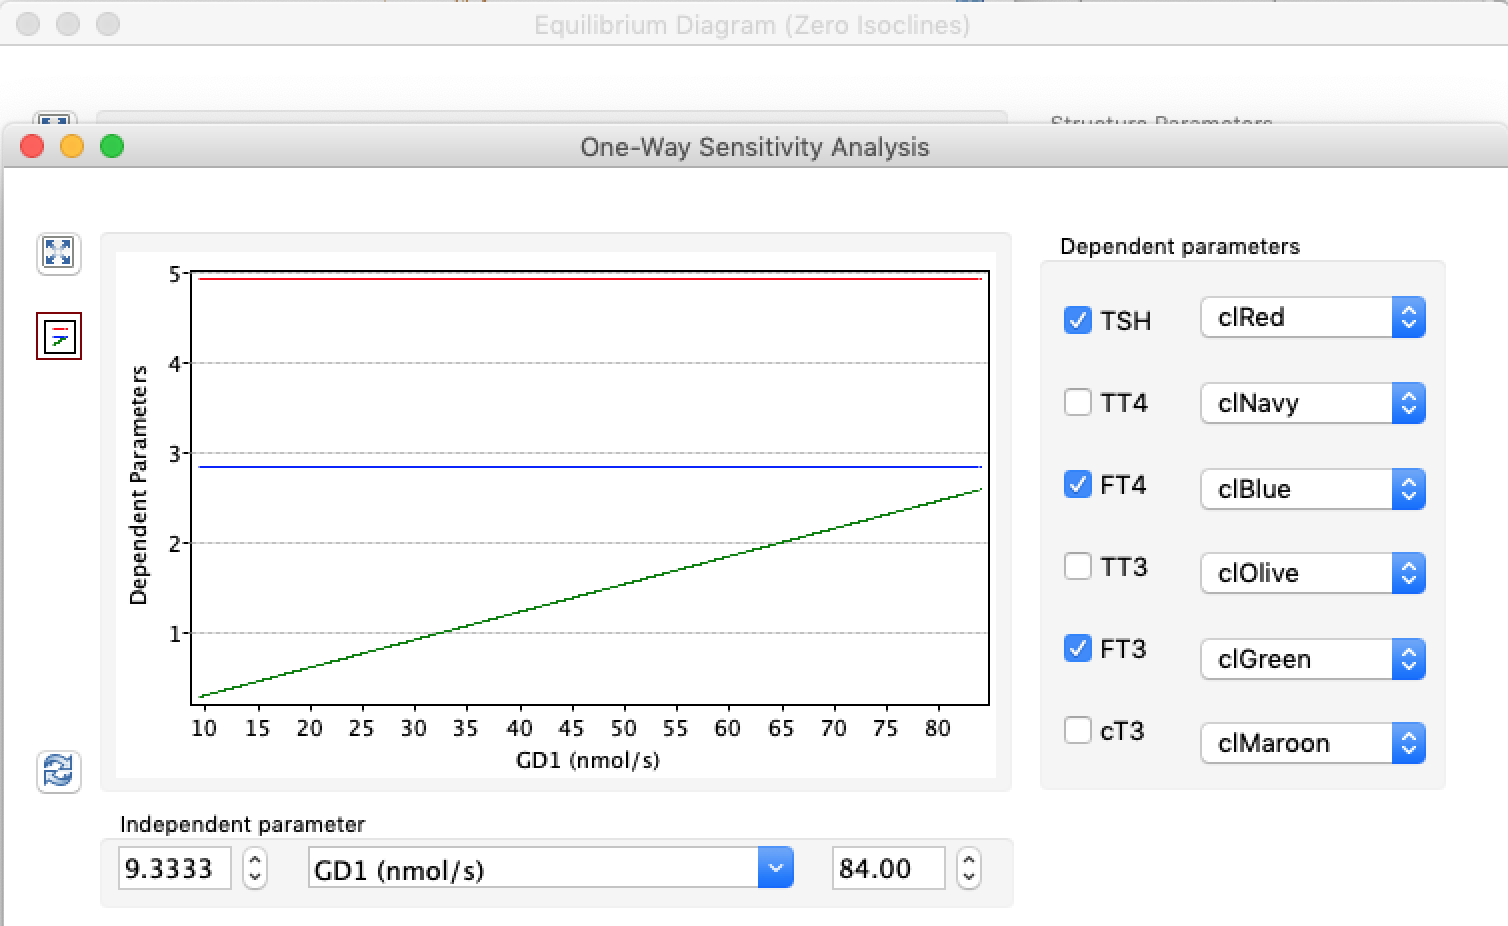
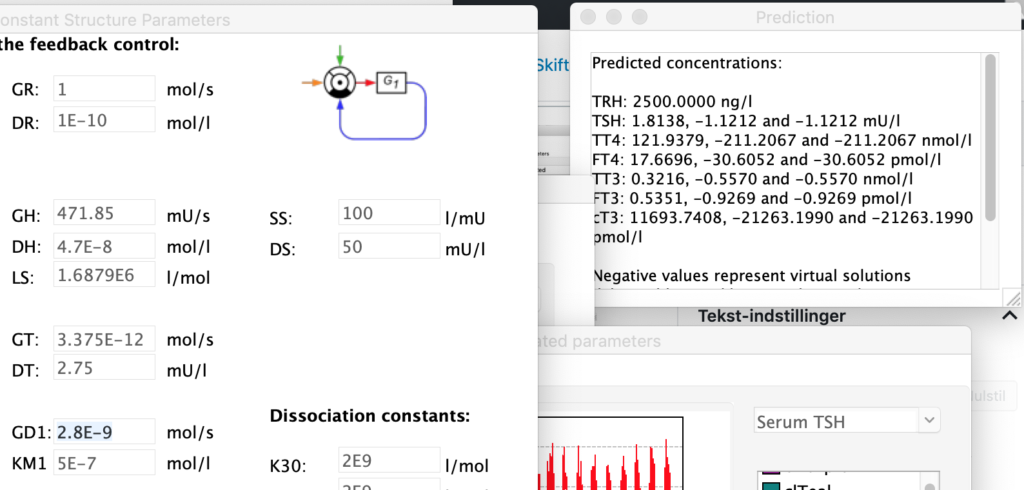
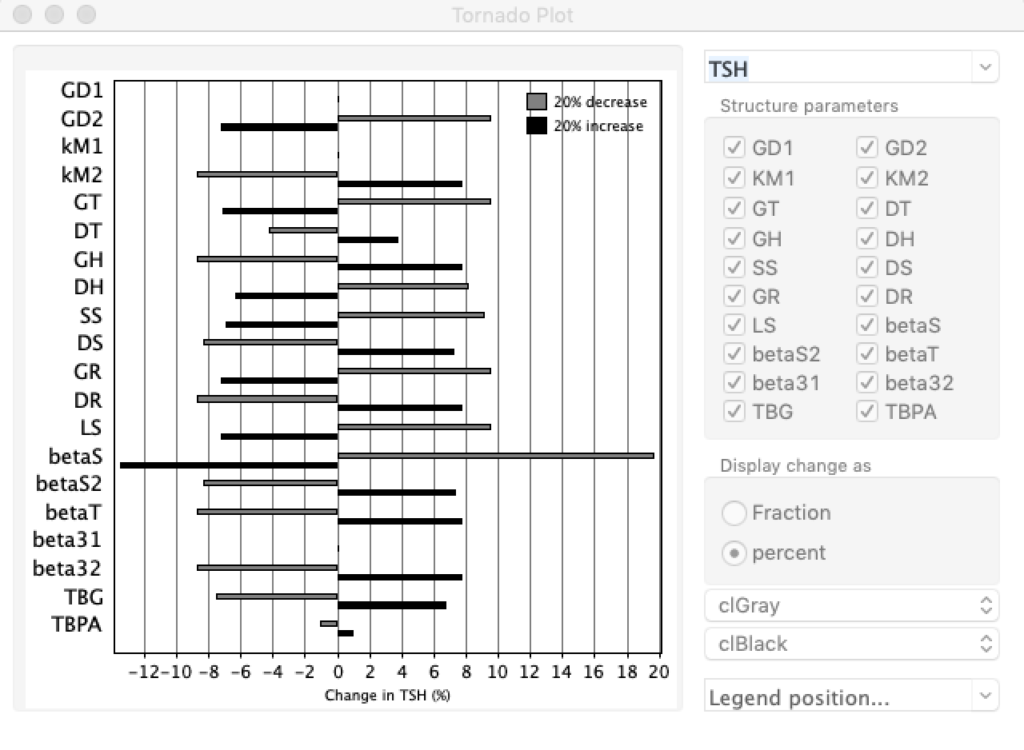
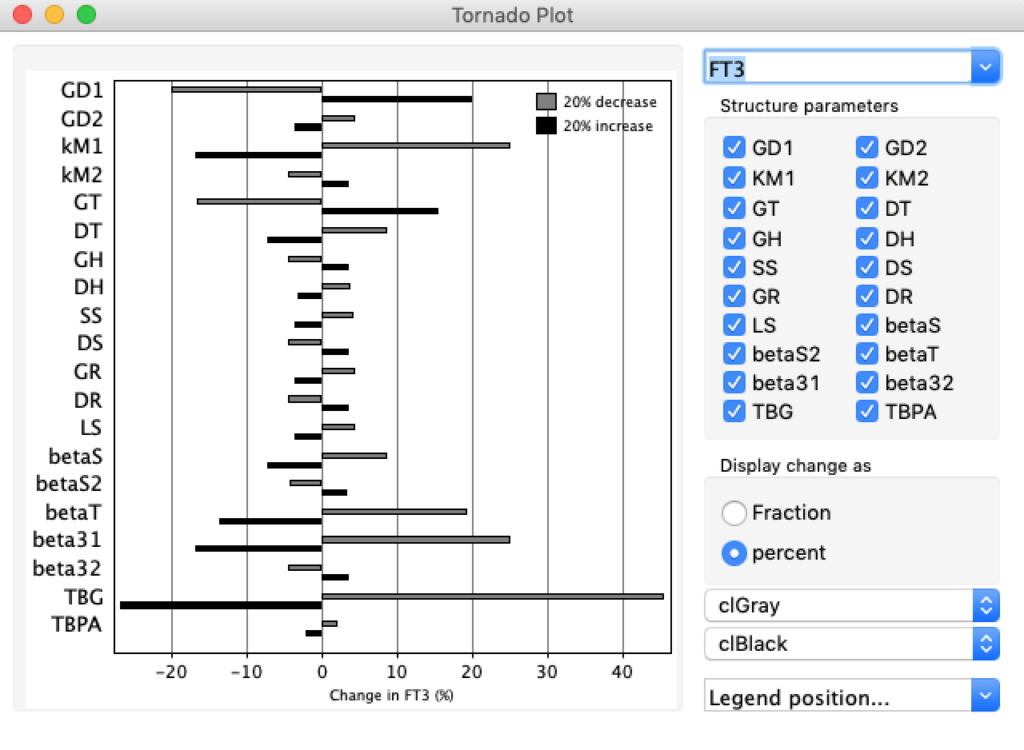
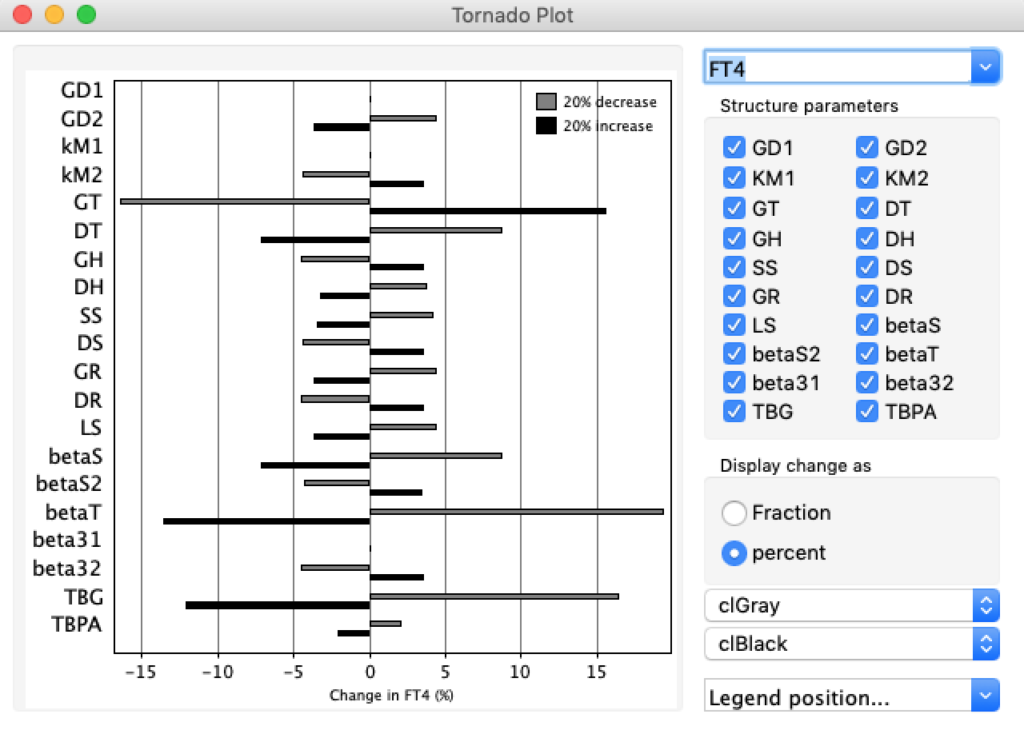
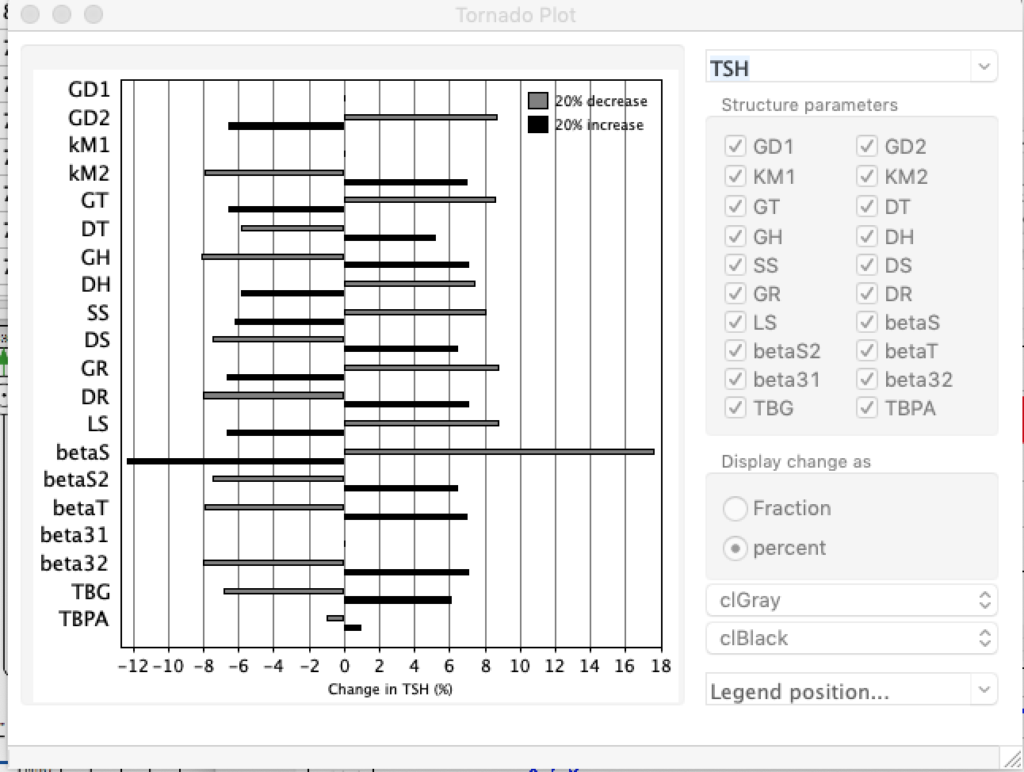
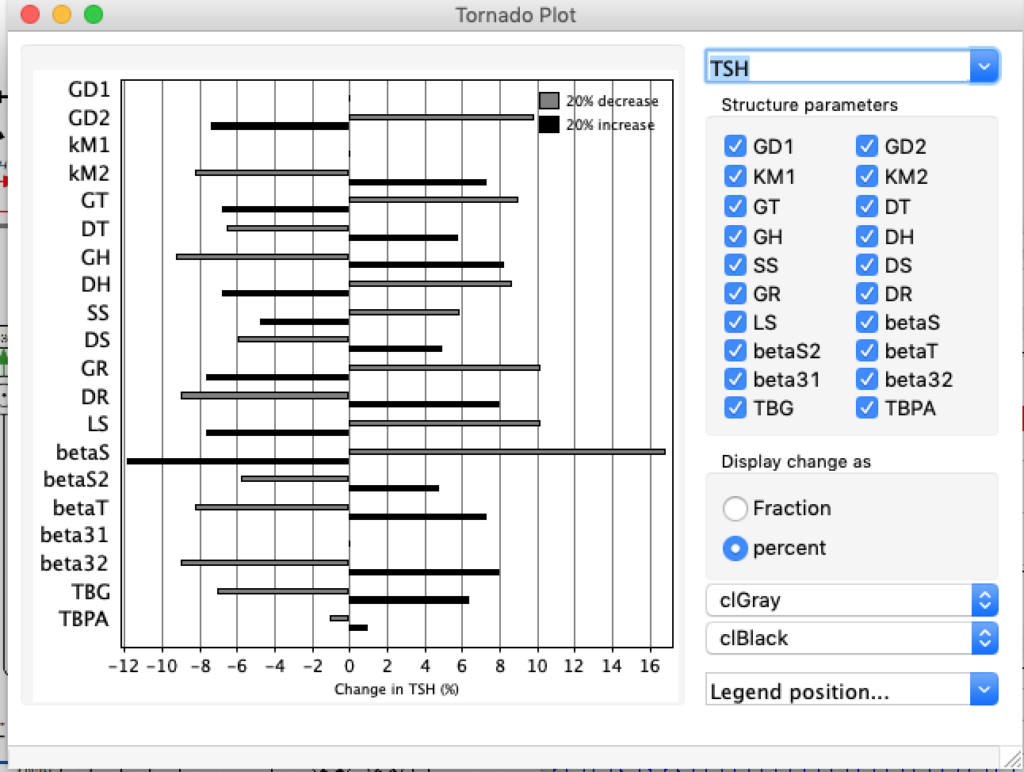
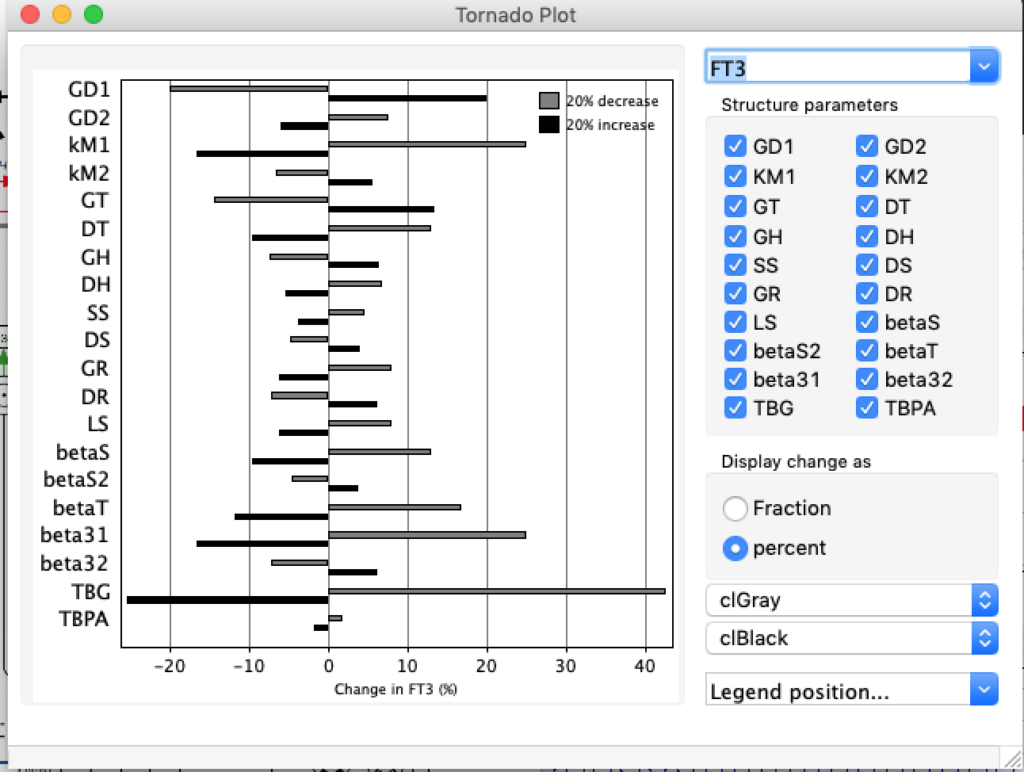
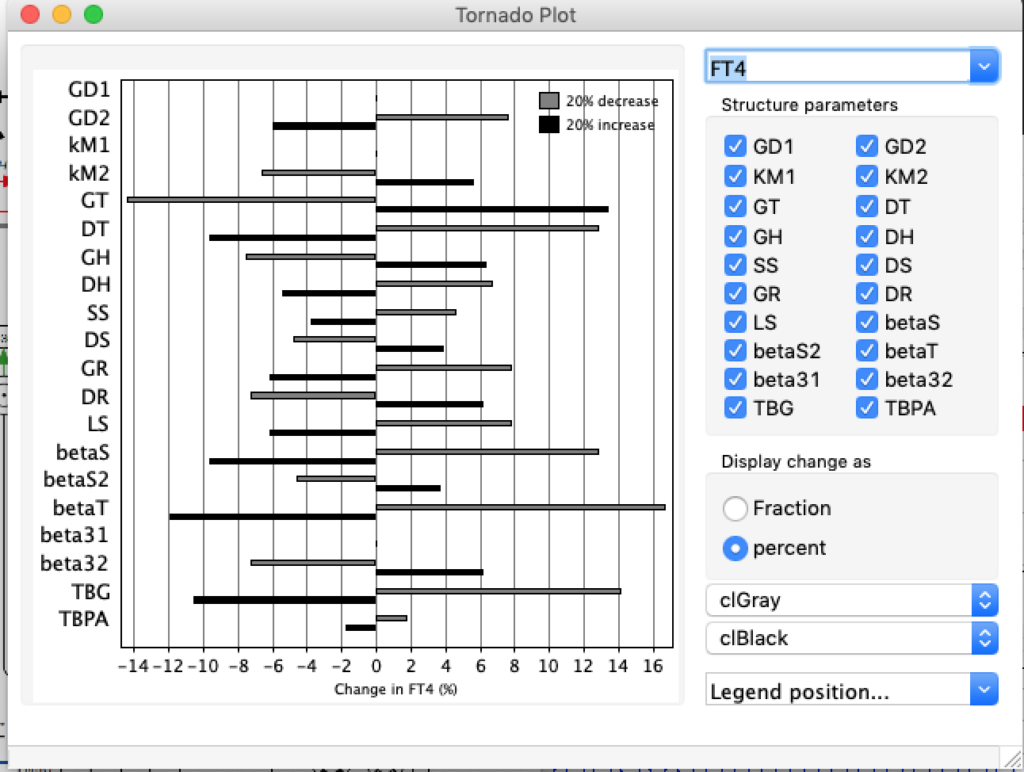
GT: the secretory capacity of the thyroid

TABLE 1. Decrease GT (3.375E-13) STANDARD FIGURES Increase GT (3.375E-11)
TRH 2500 2500 2500
TSH 4,9344 1,8 0,7204
TT4 19,7017 121,94 636,9324
FT4 2,8549 17,67 92,2957
TT3 0,5196 3,21 16,7947
FT3 0,8645 5,35 27,9446
cT3 1917,2921
56908,1934

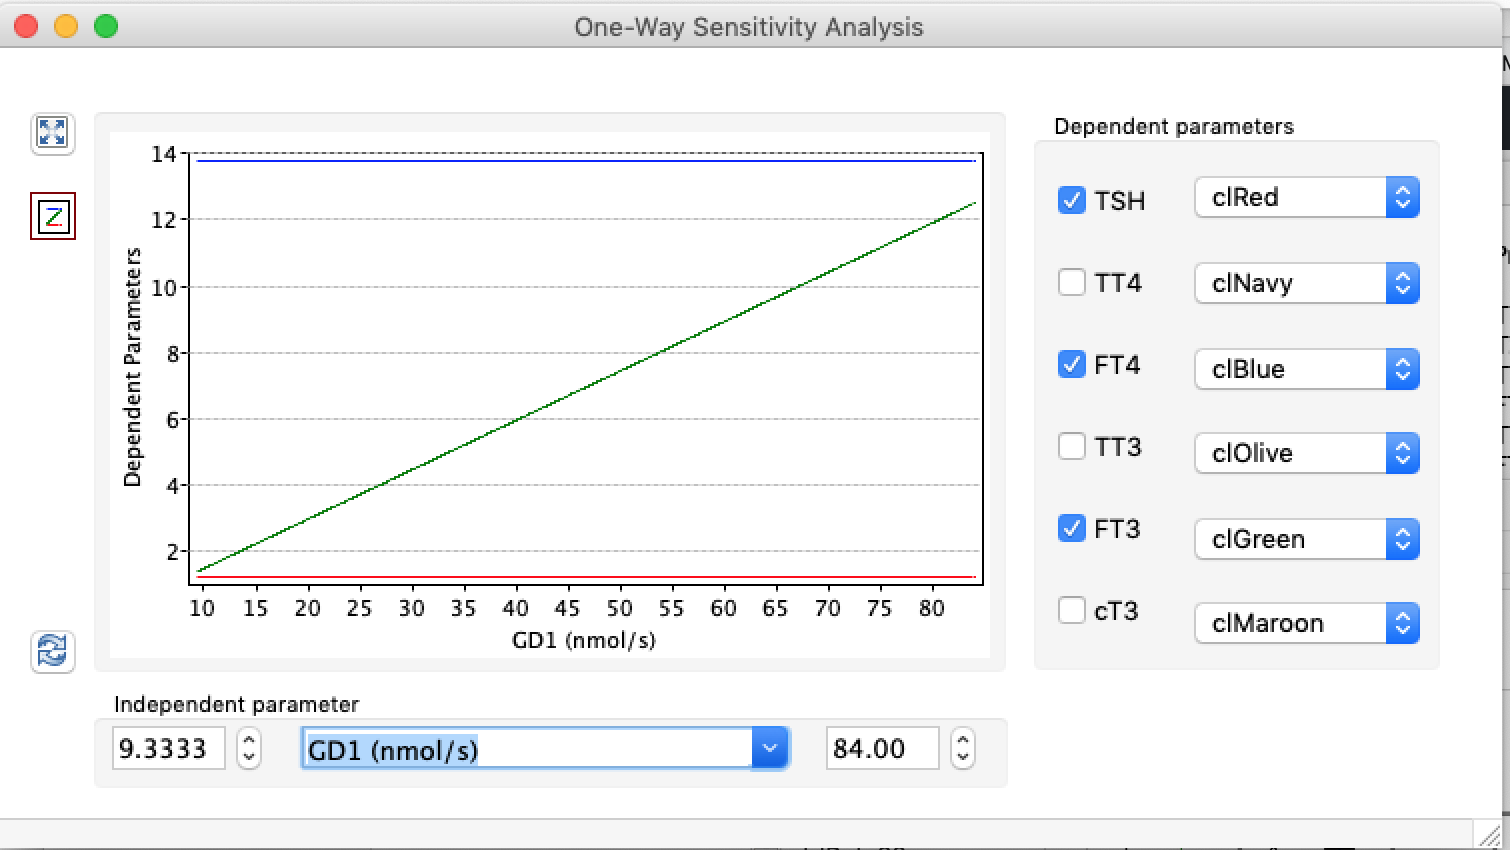
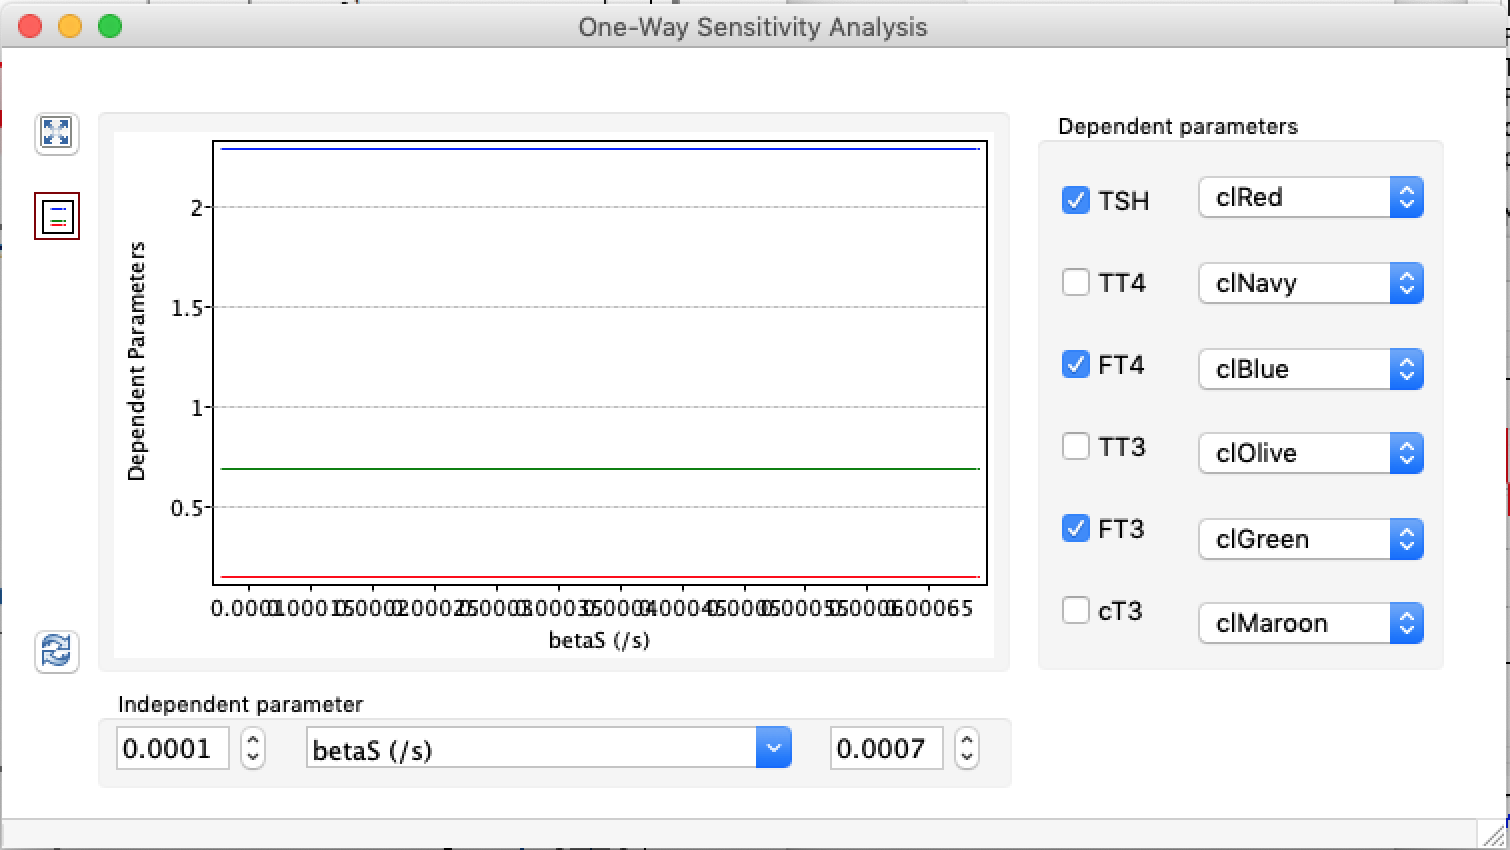
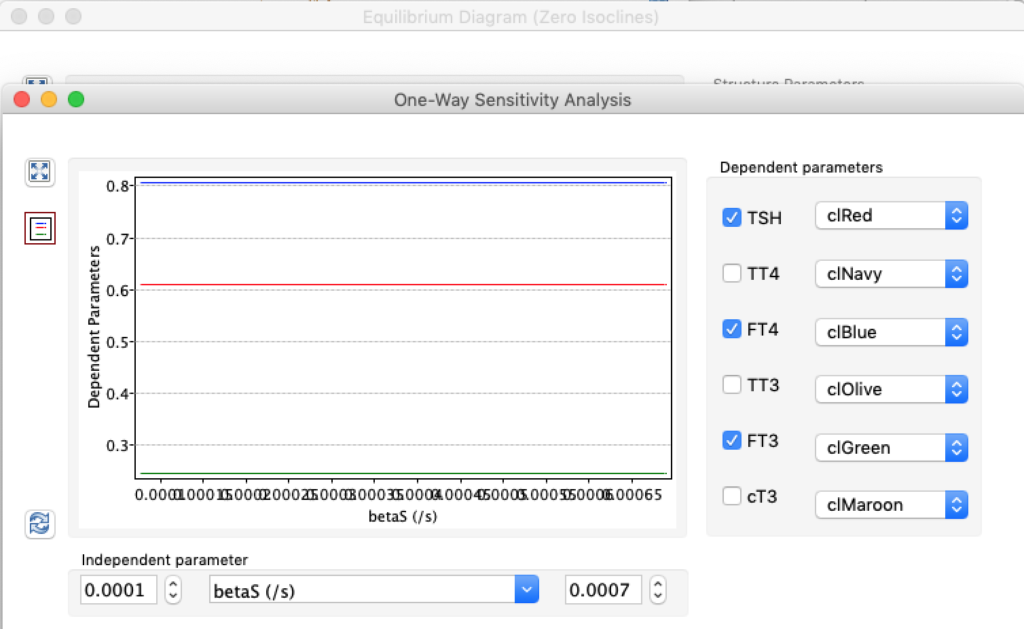
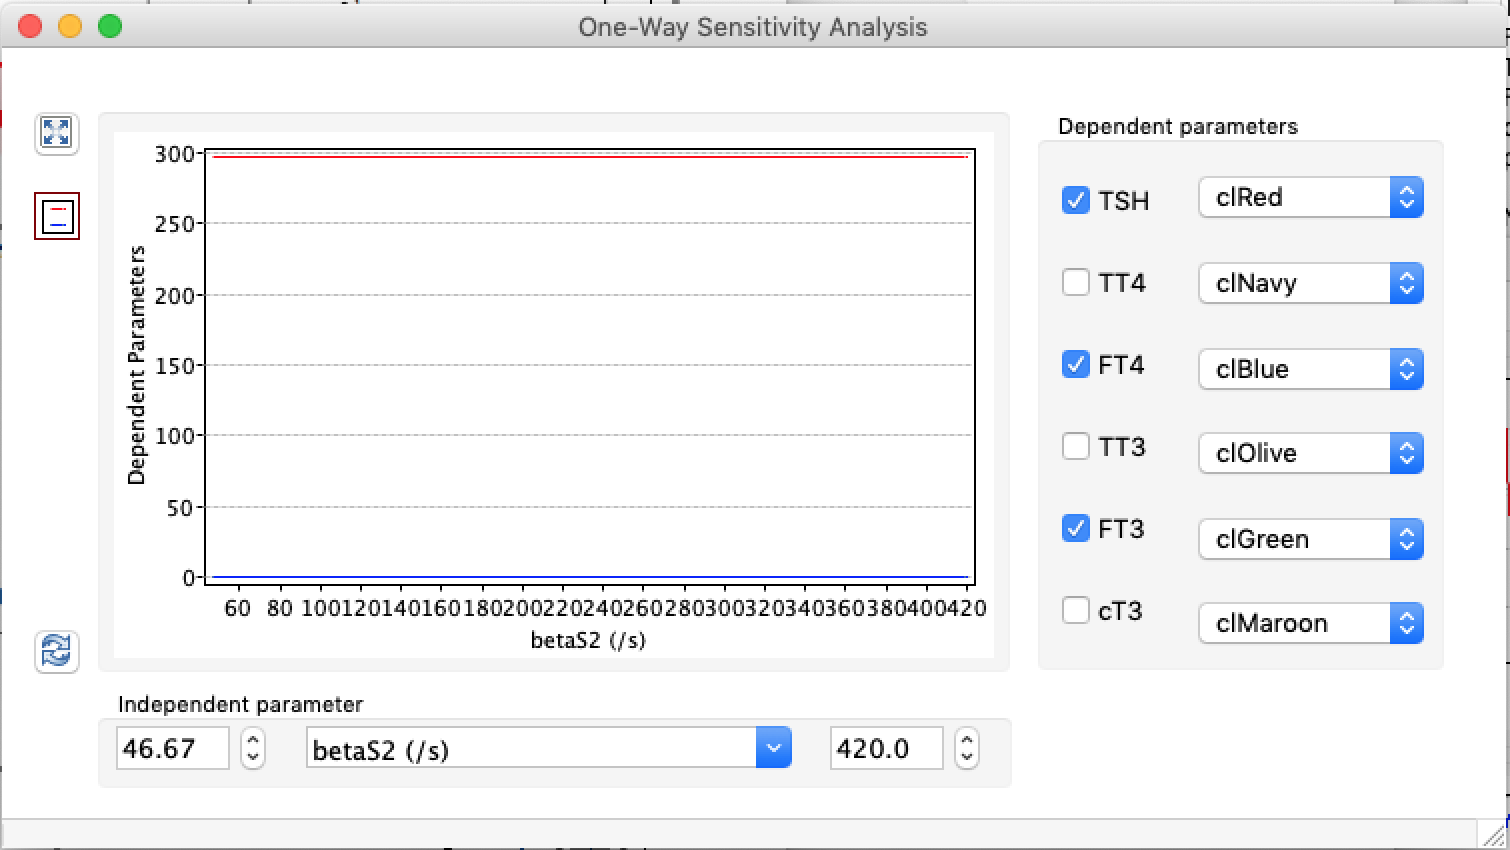
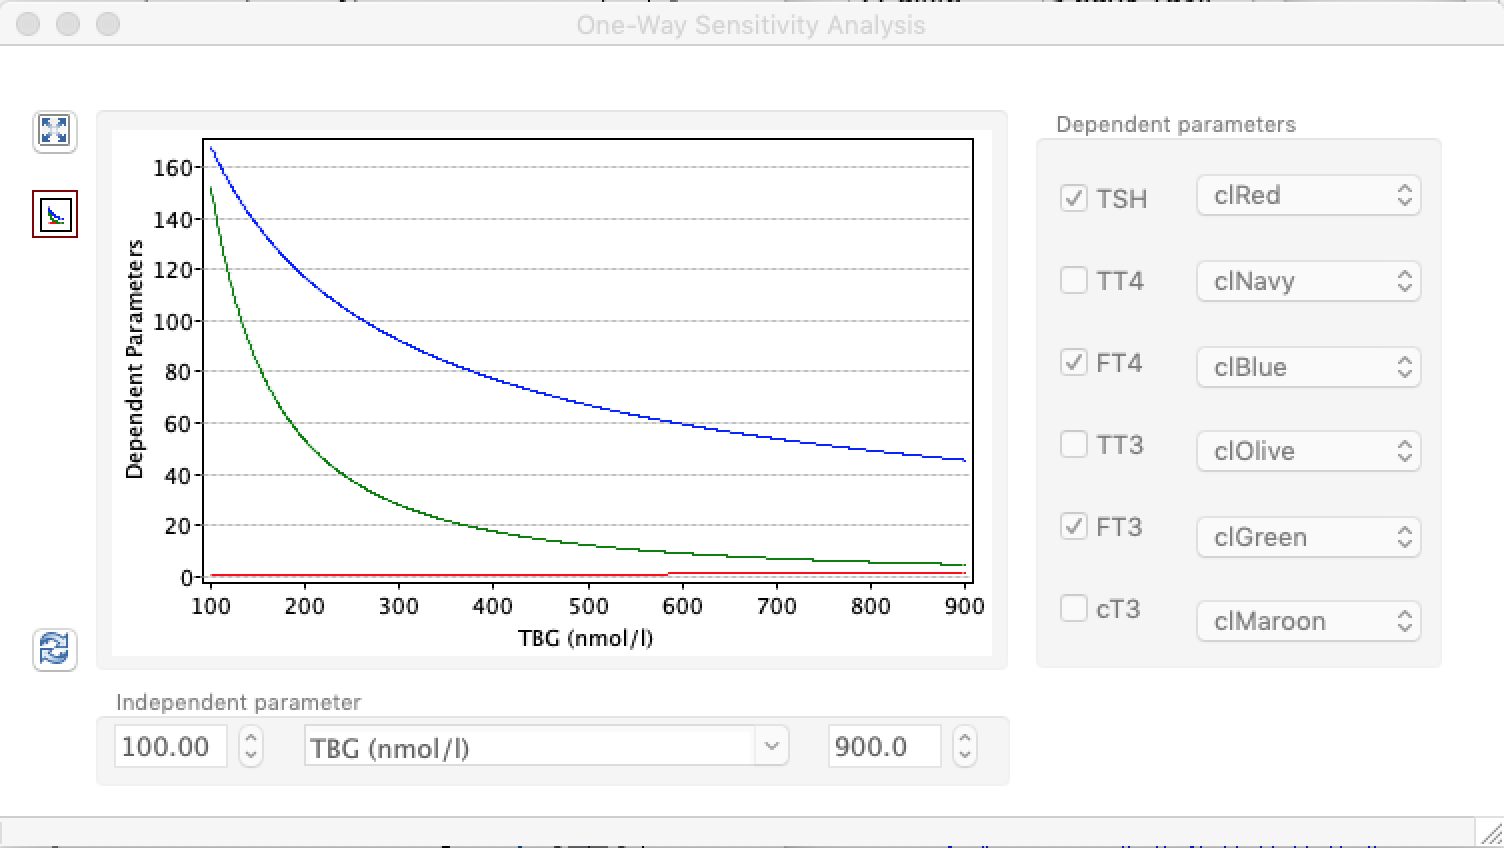
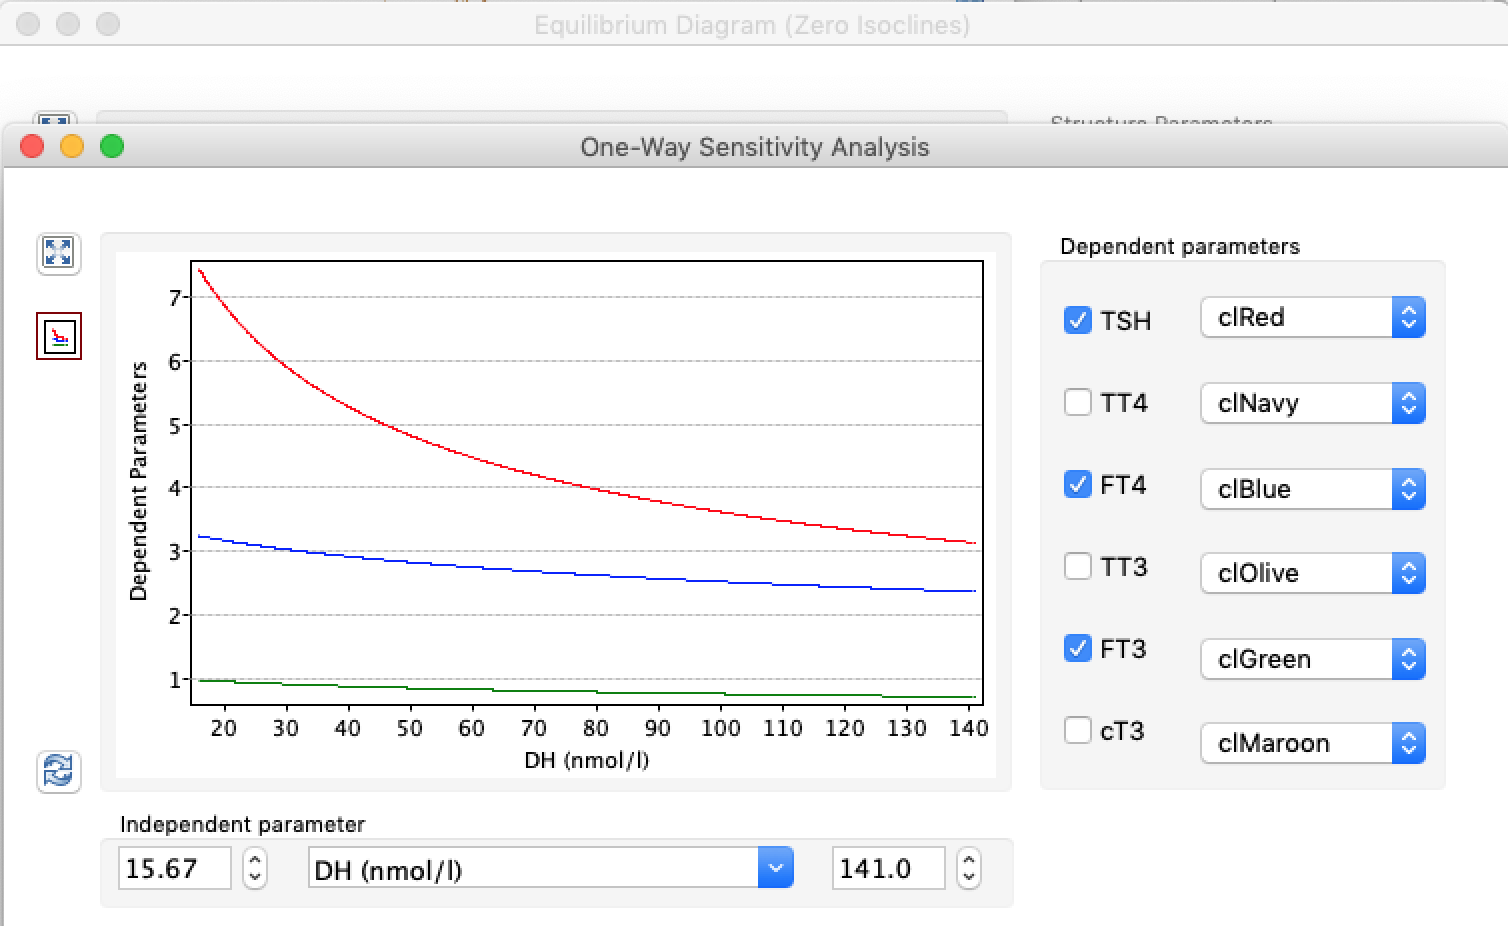
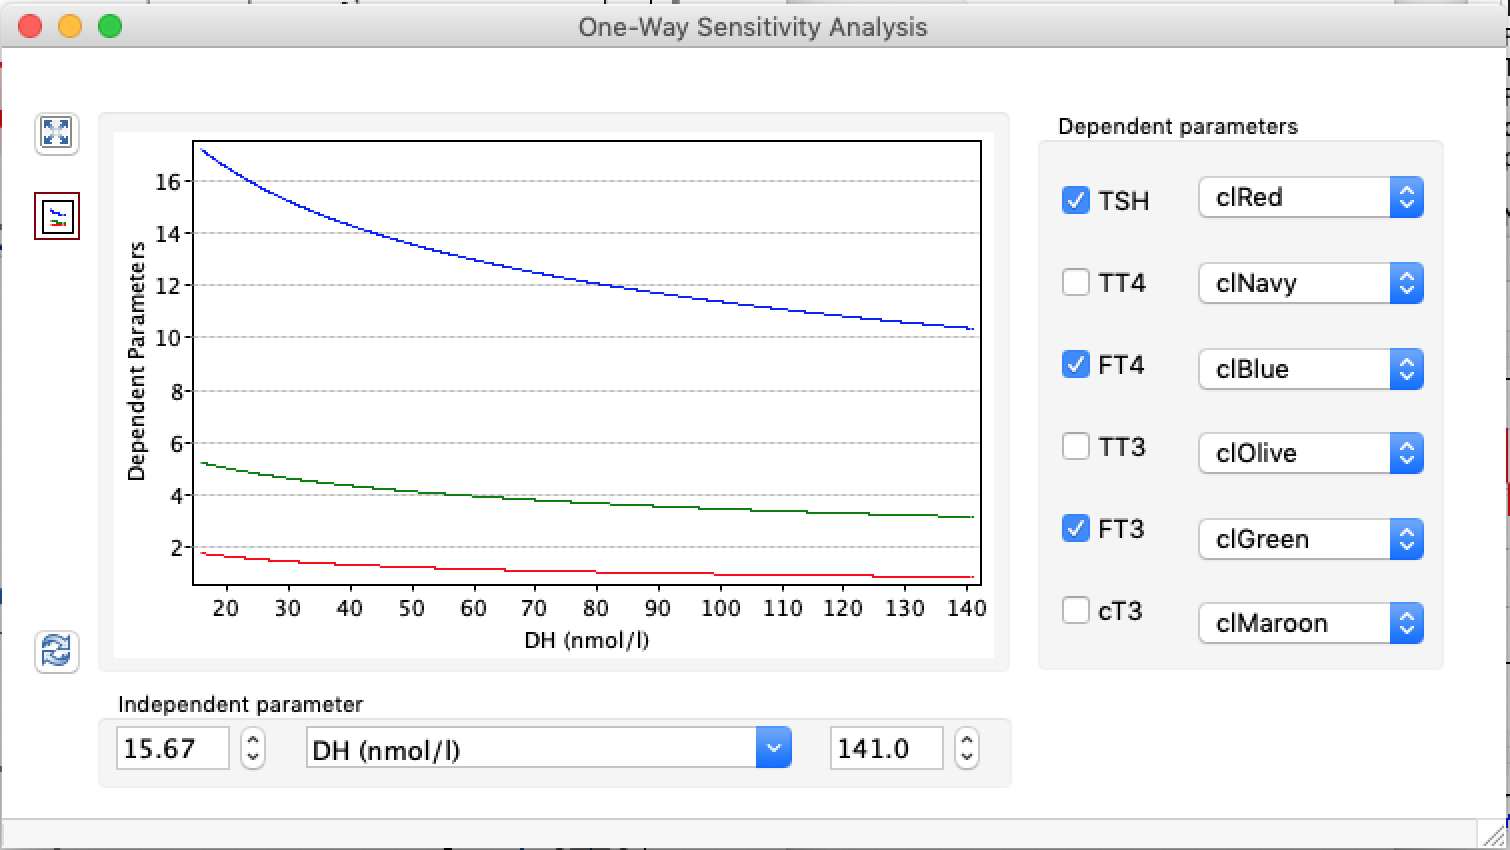
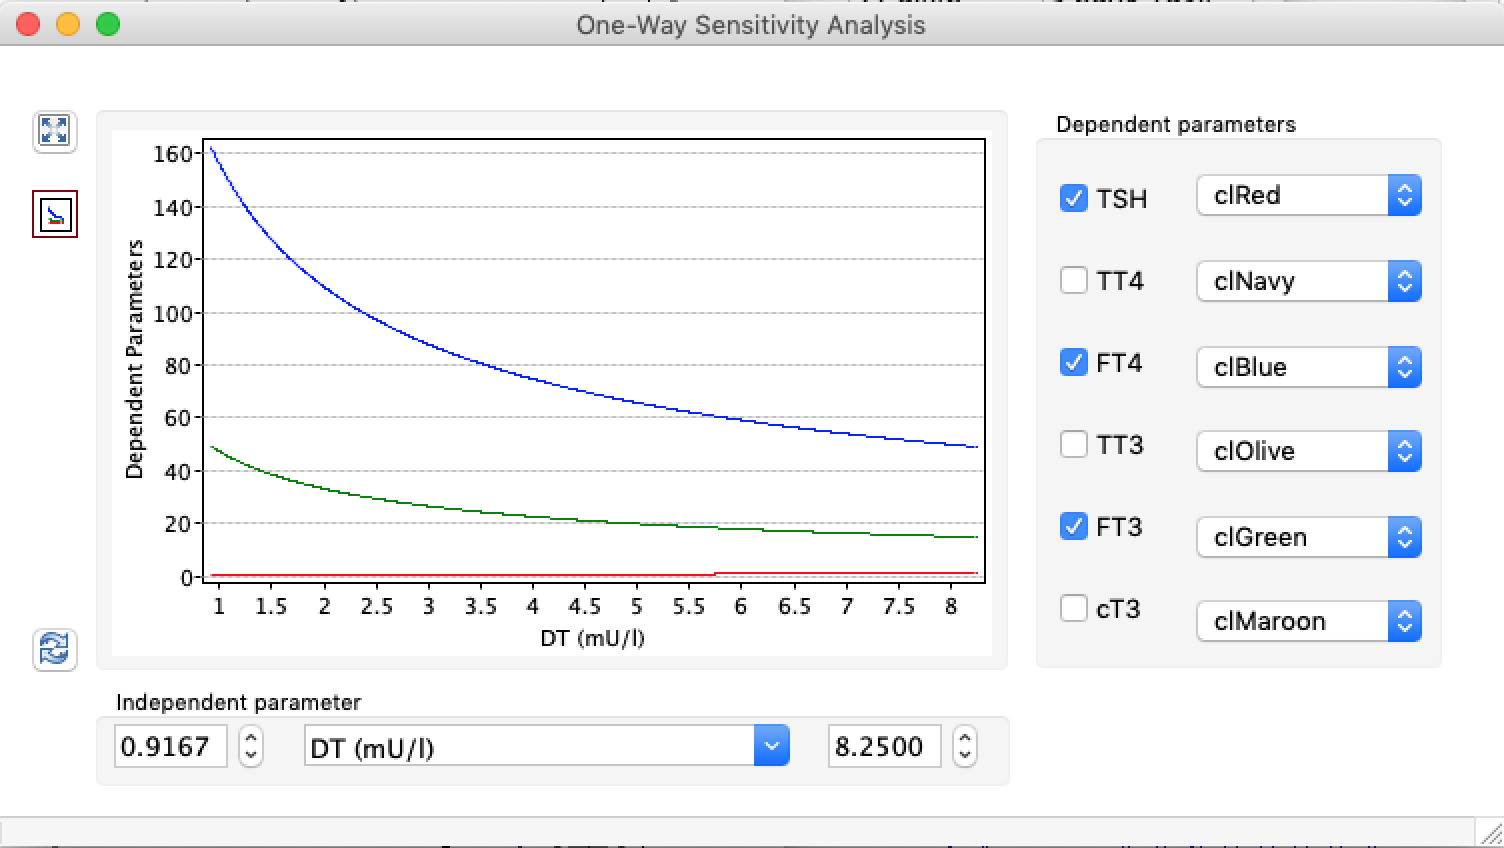
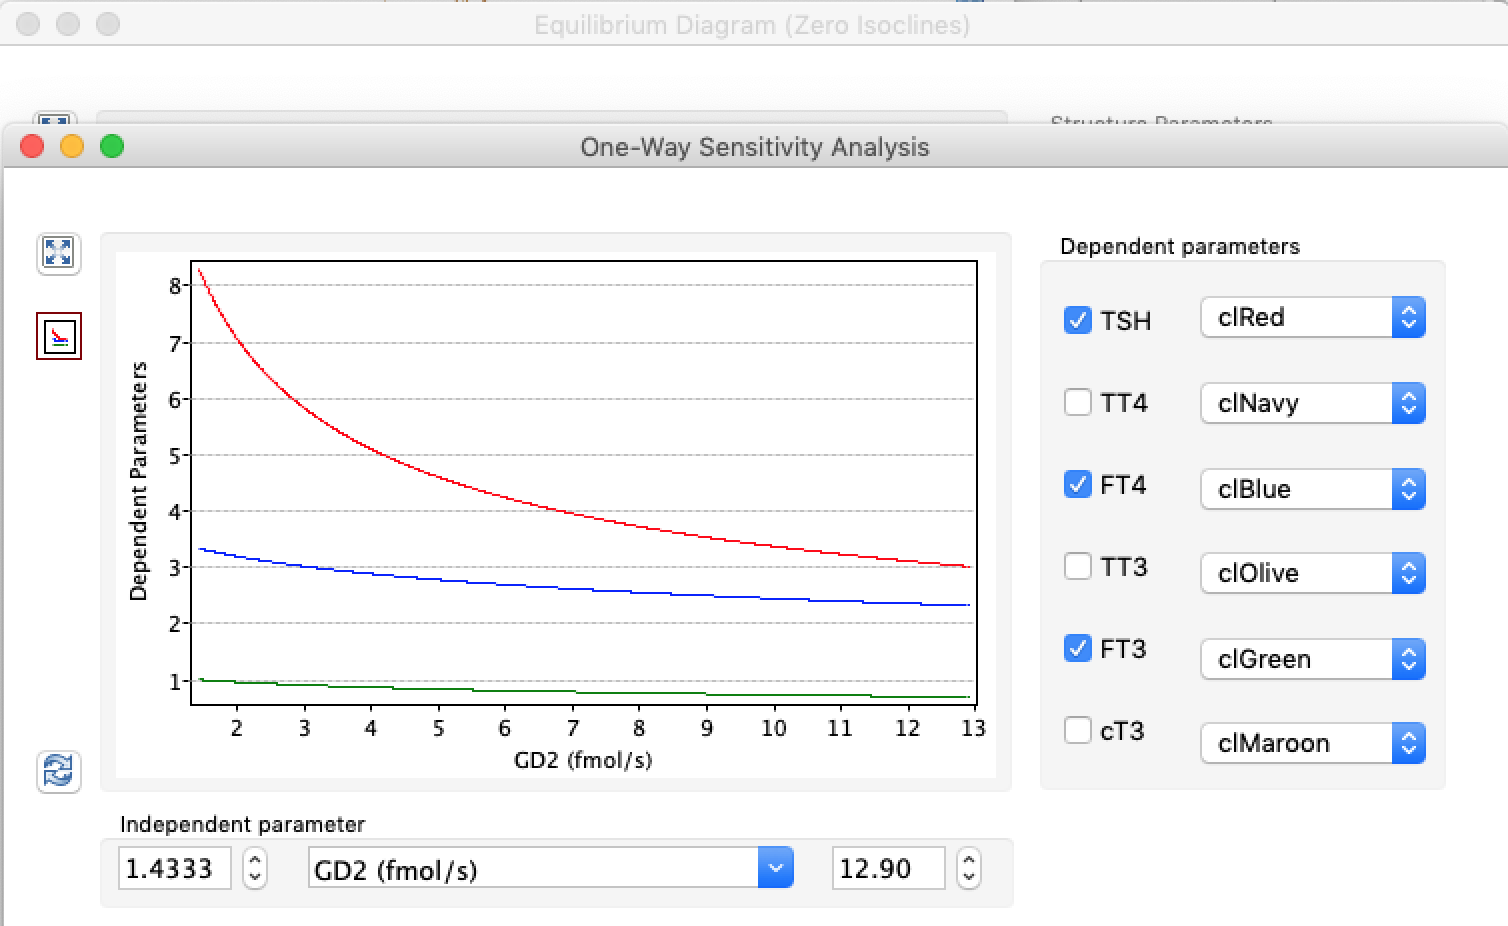
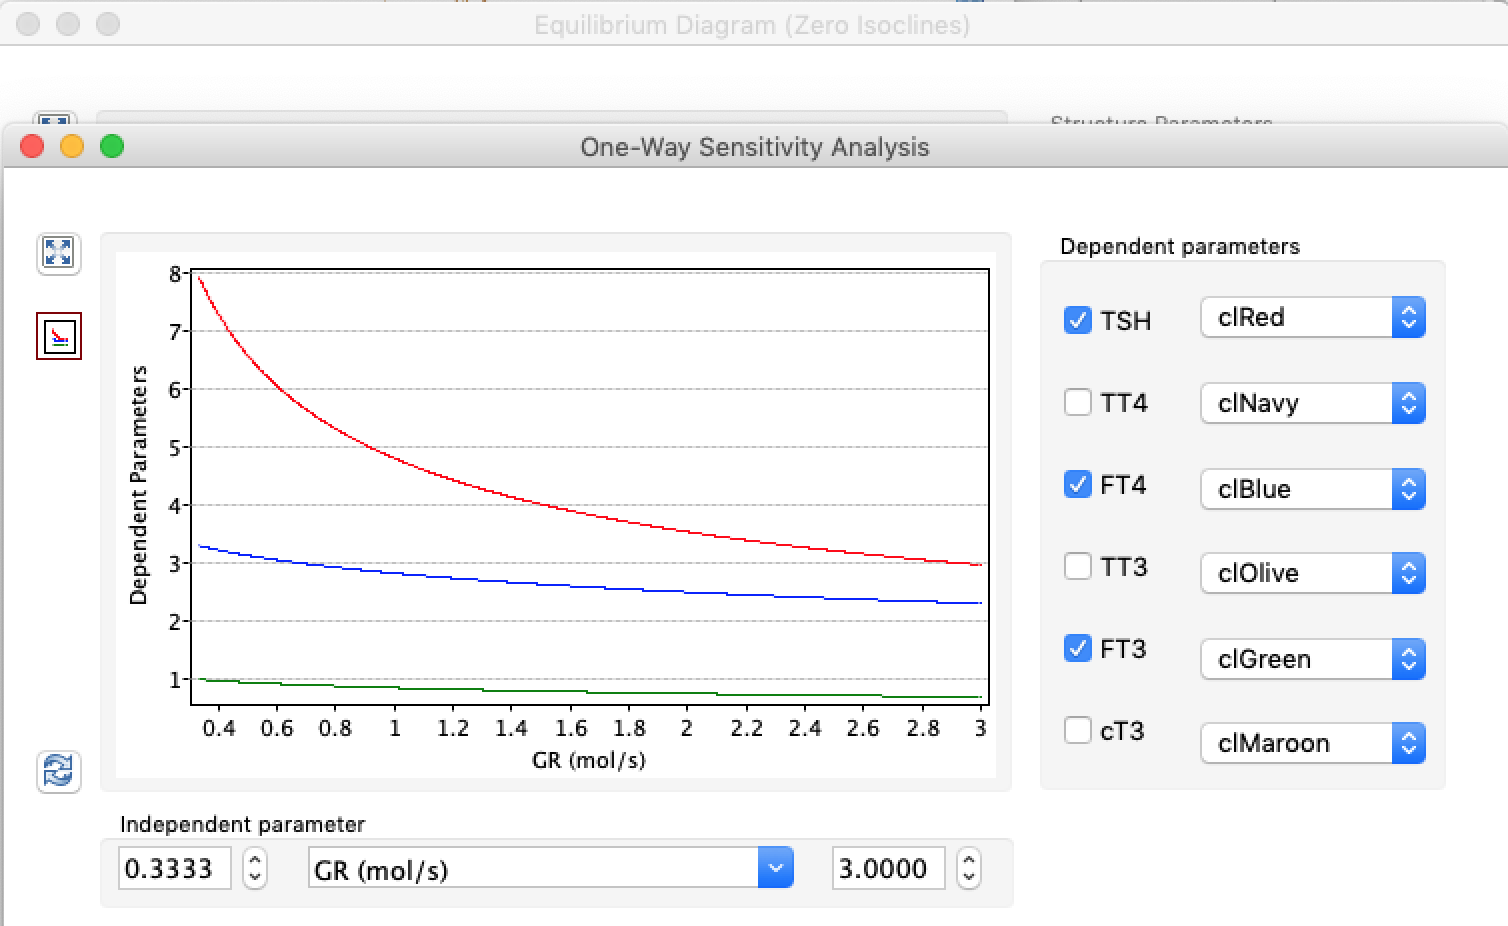
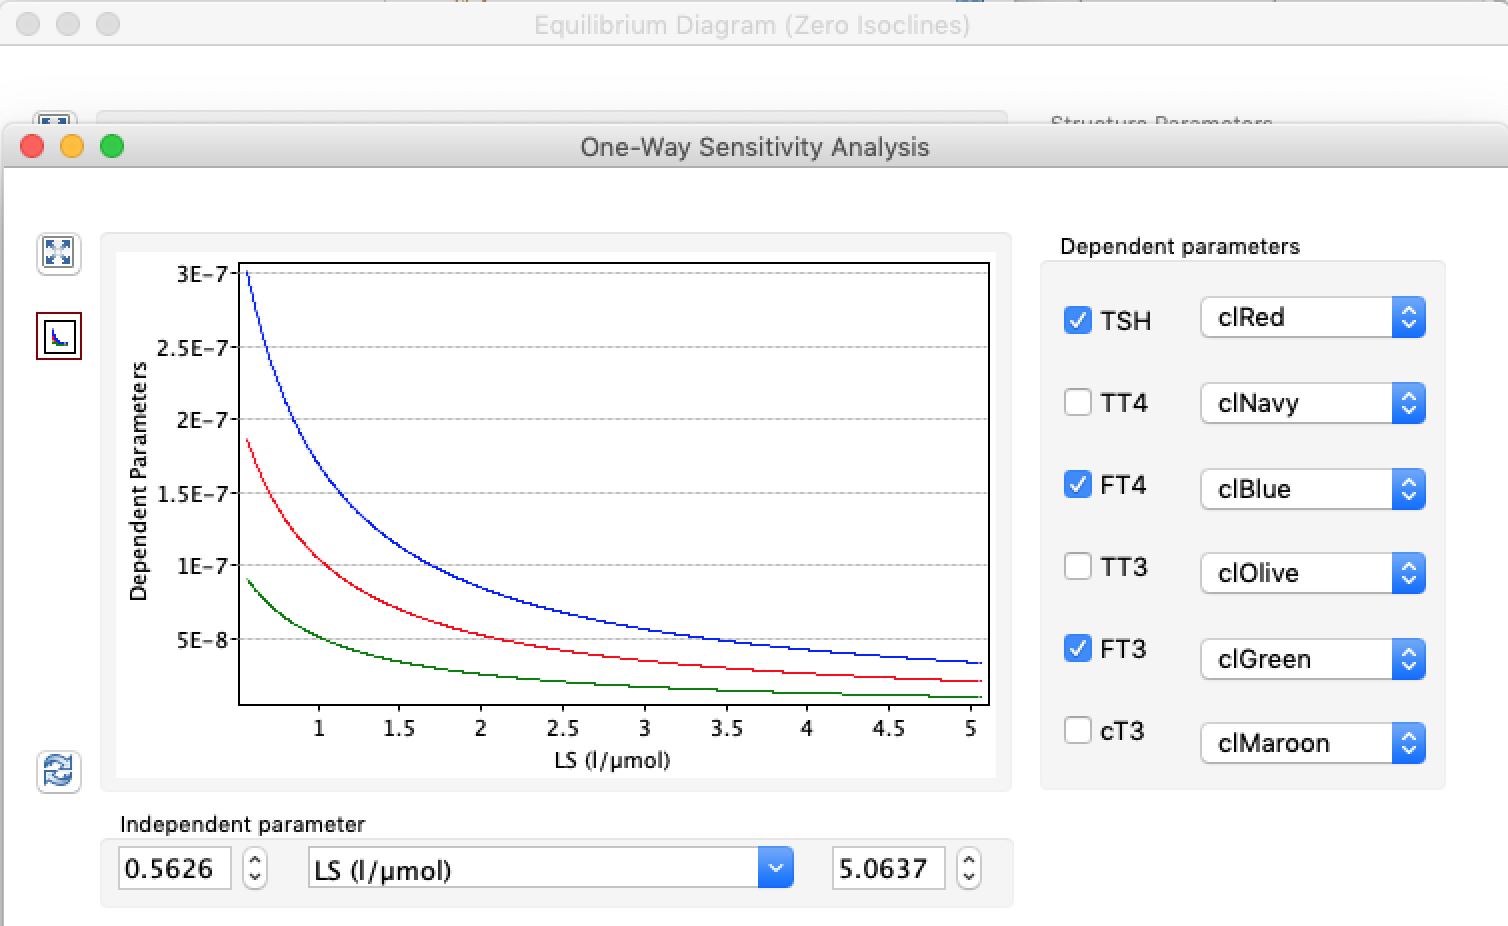
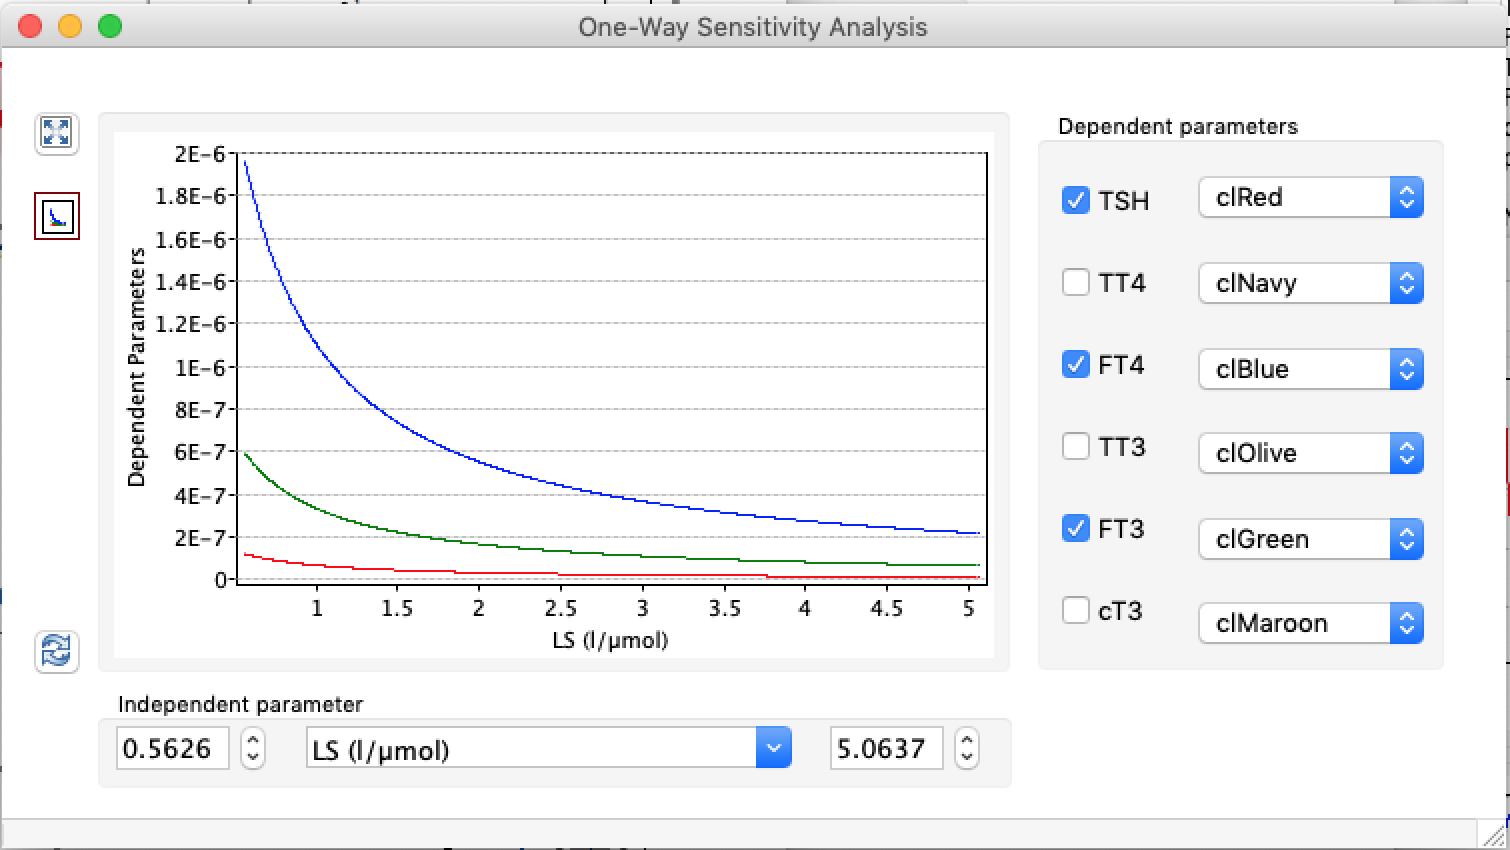
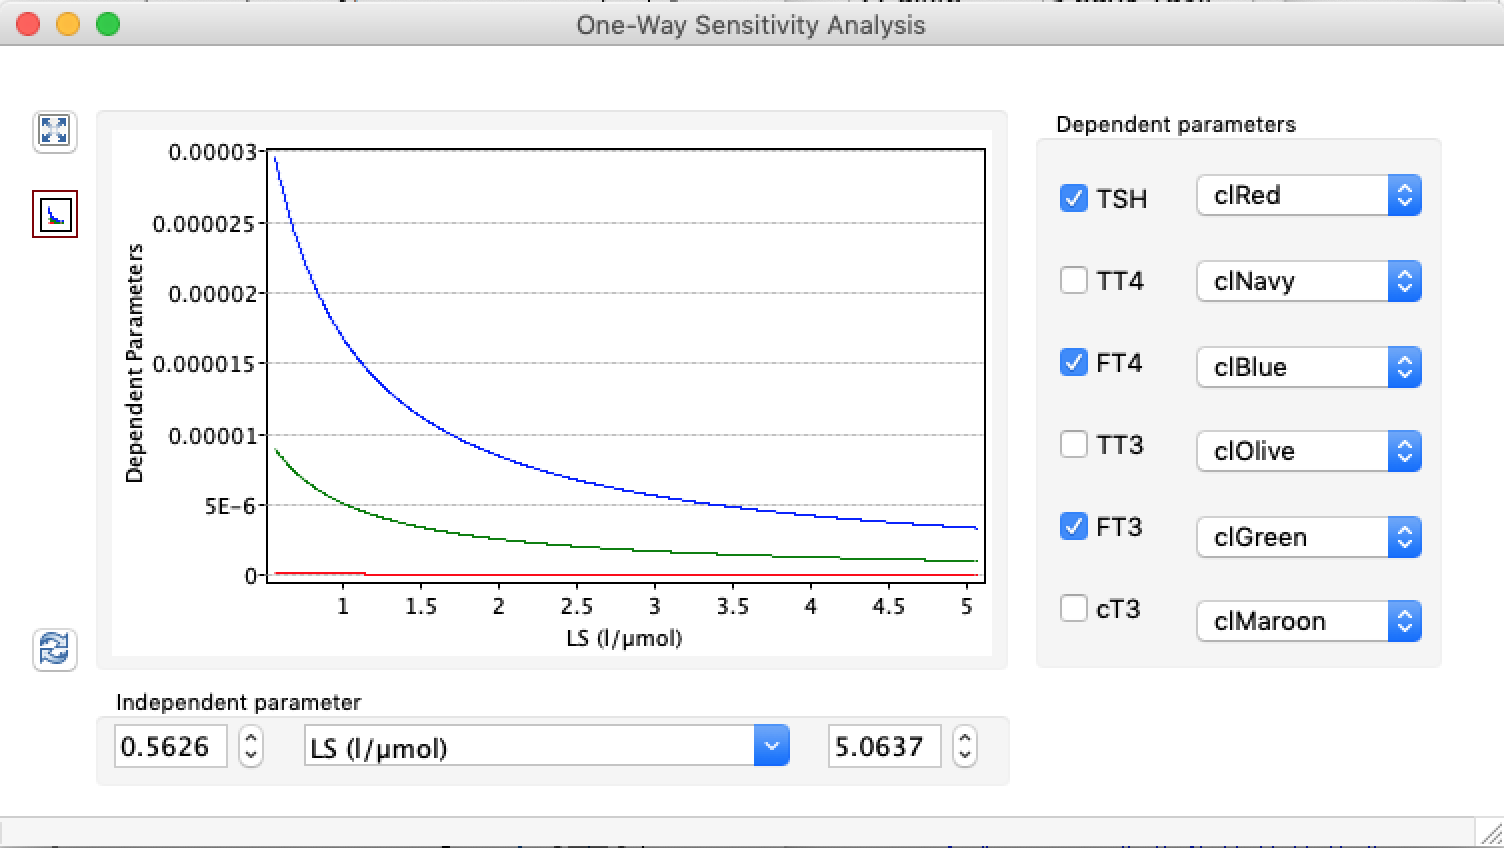
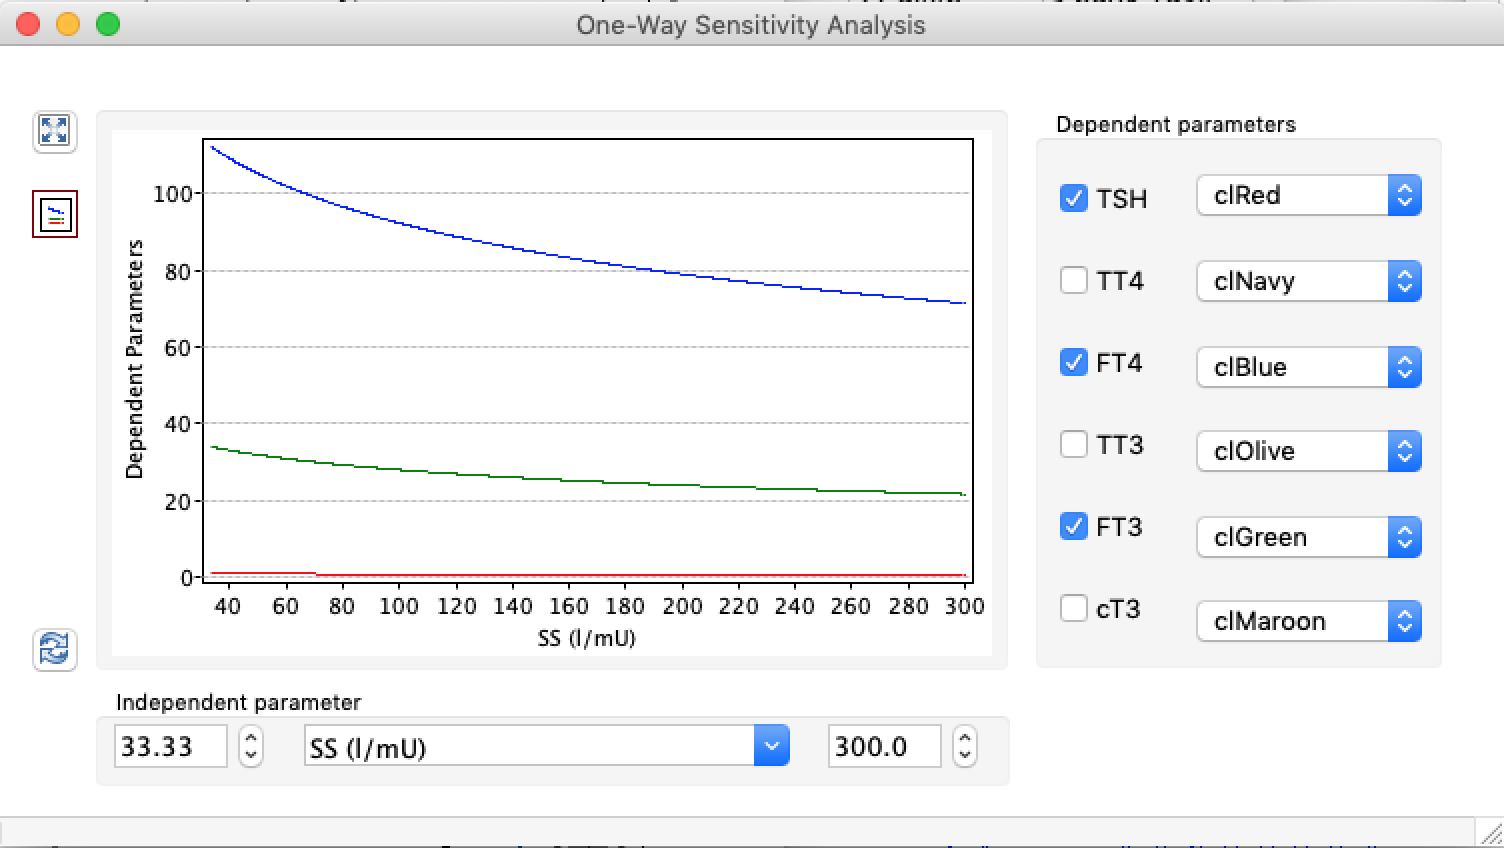
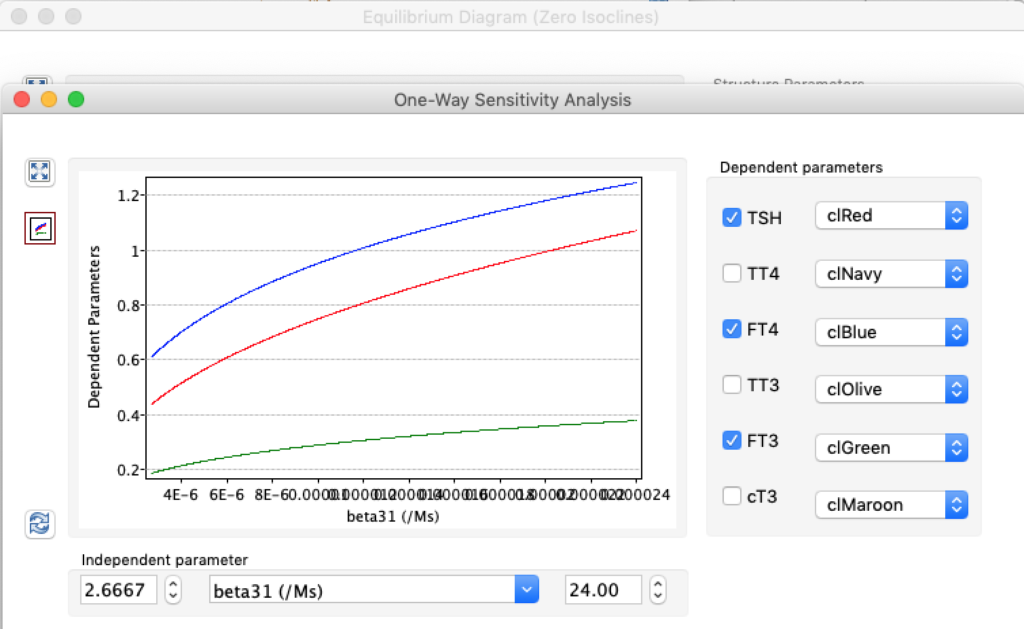
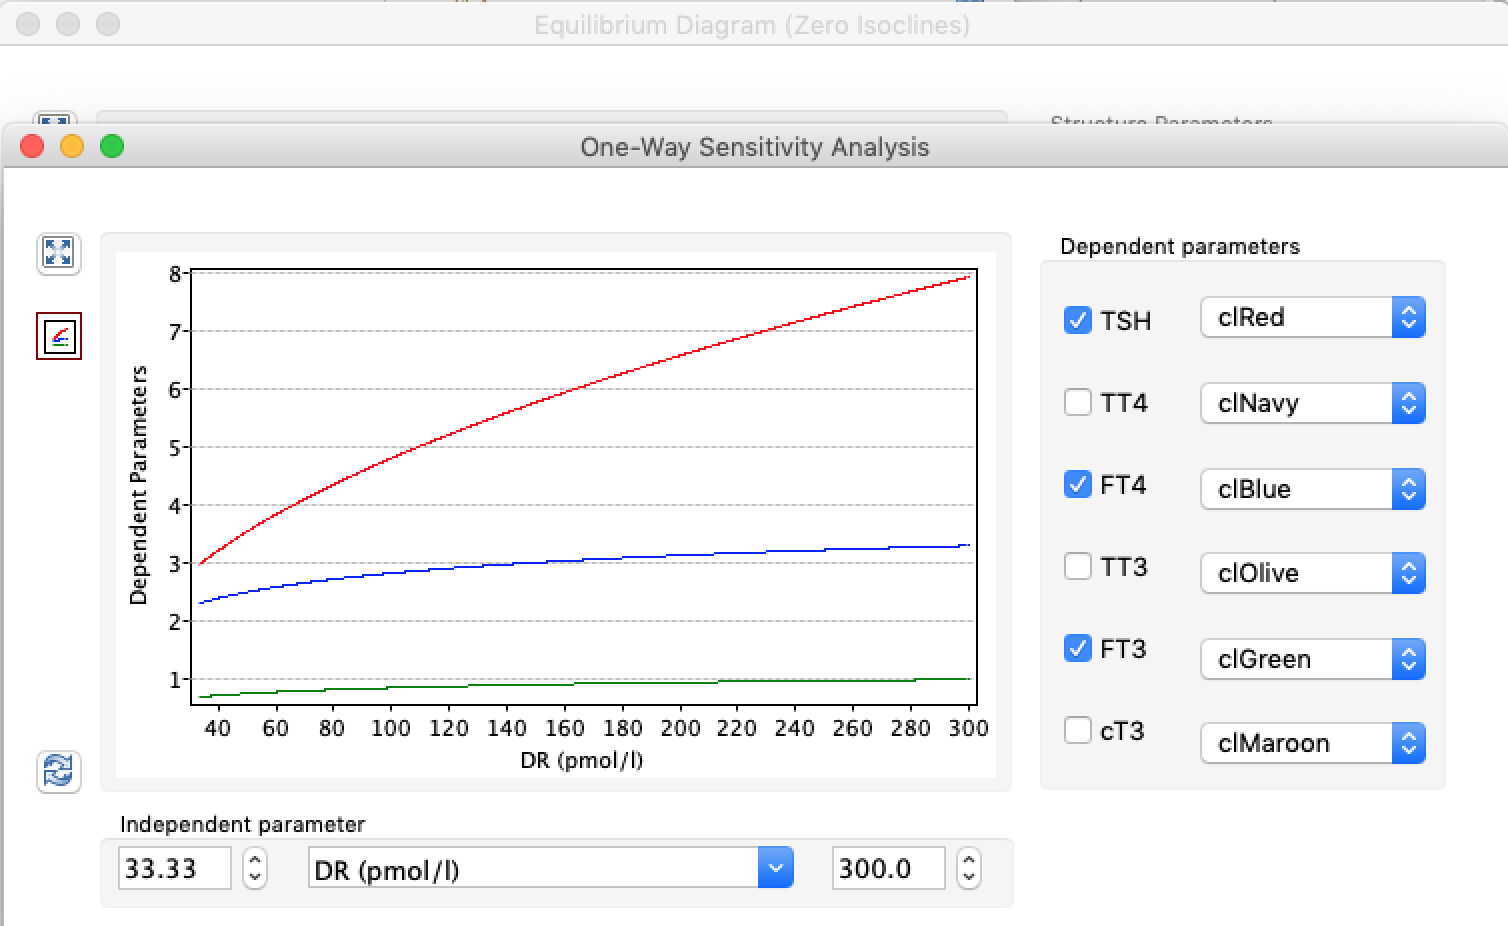
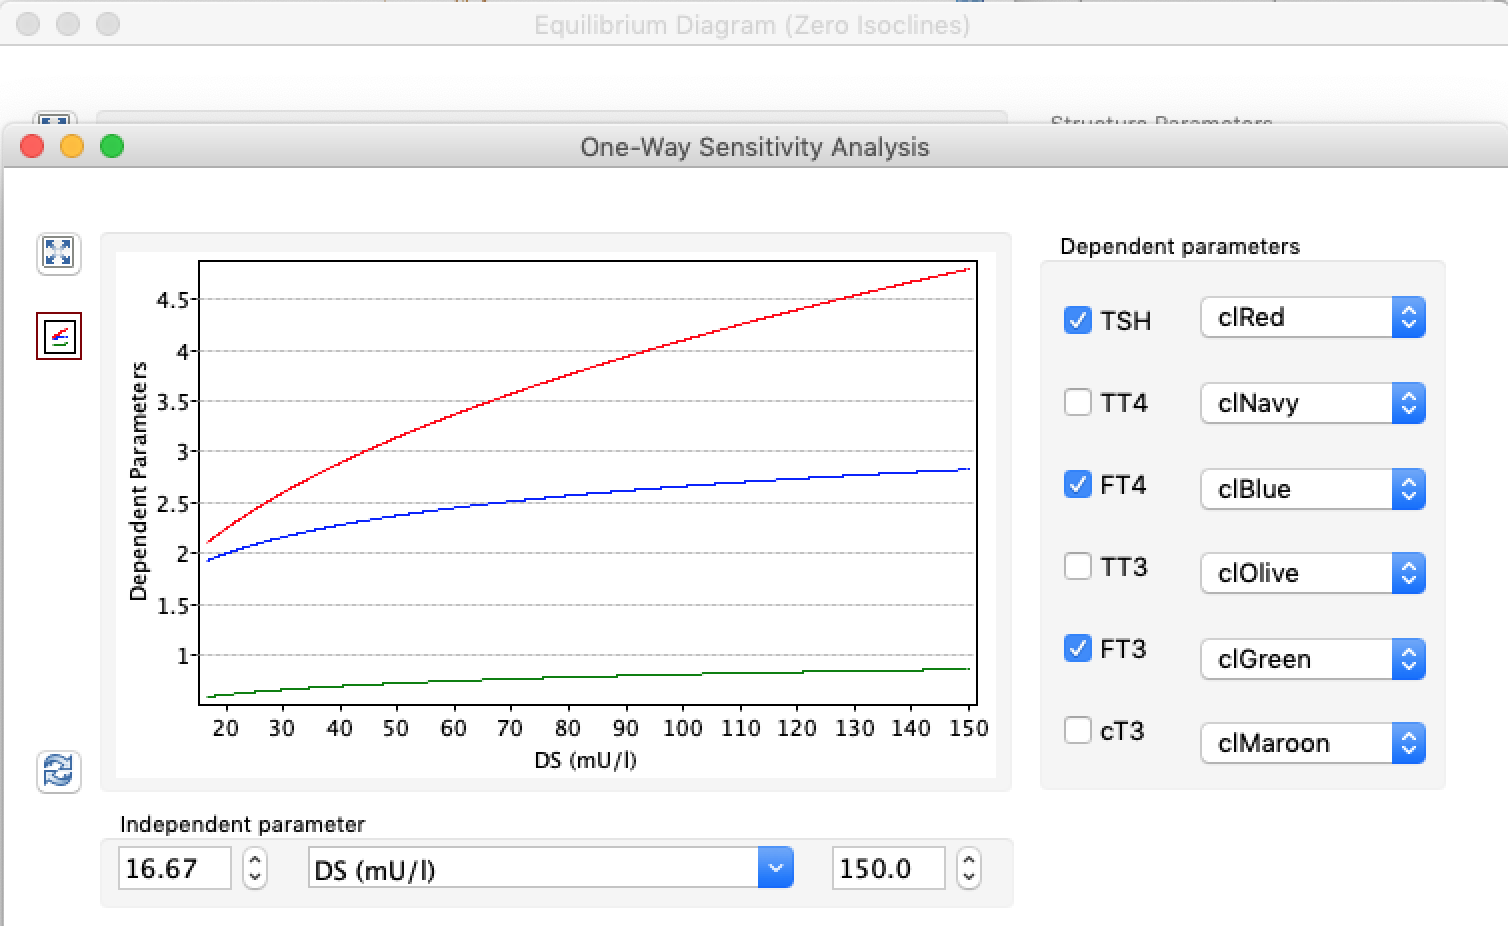
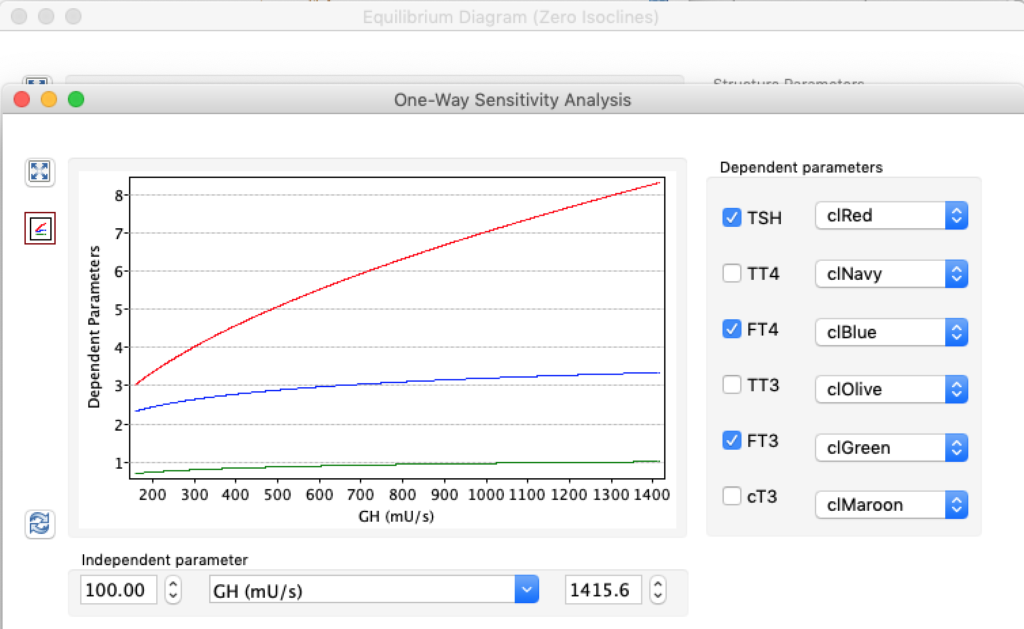
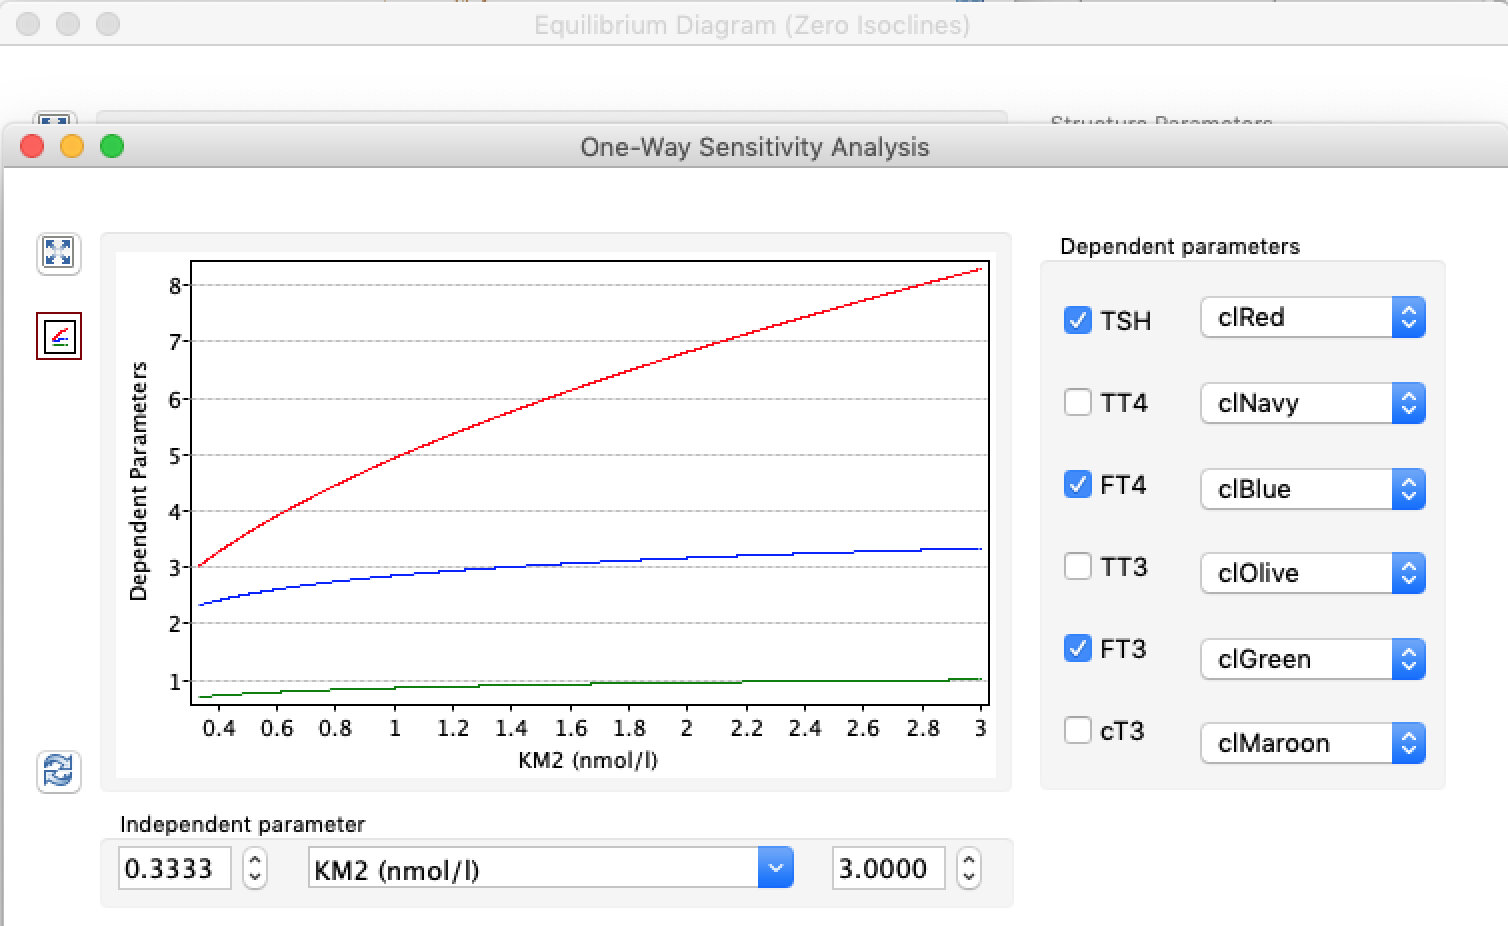
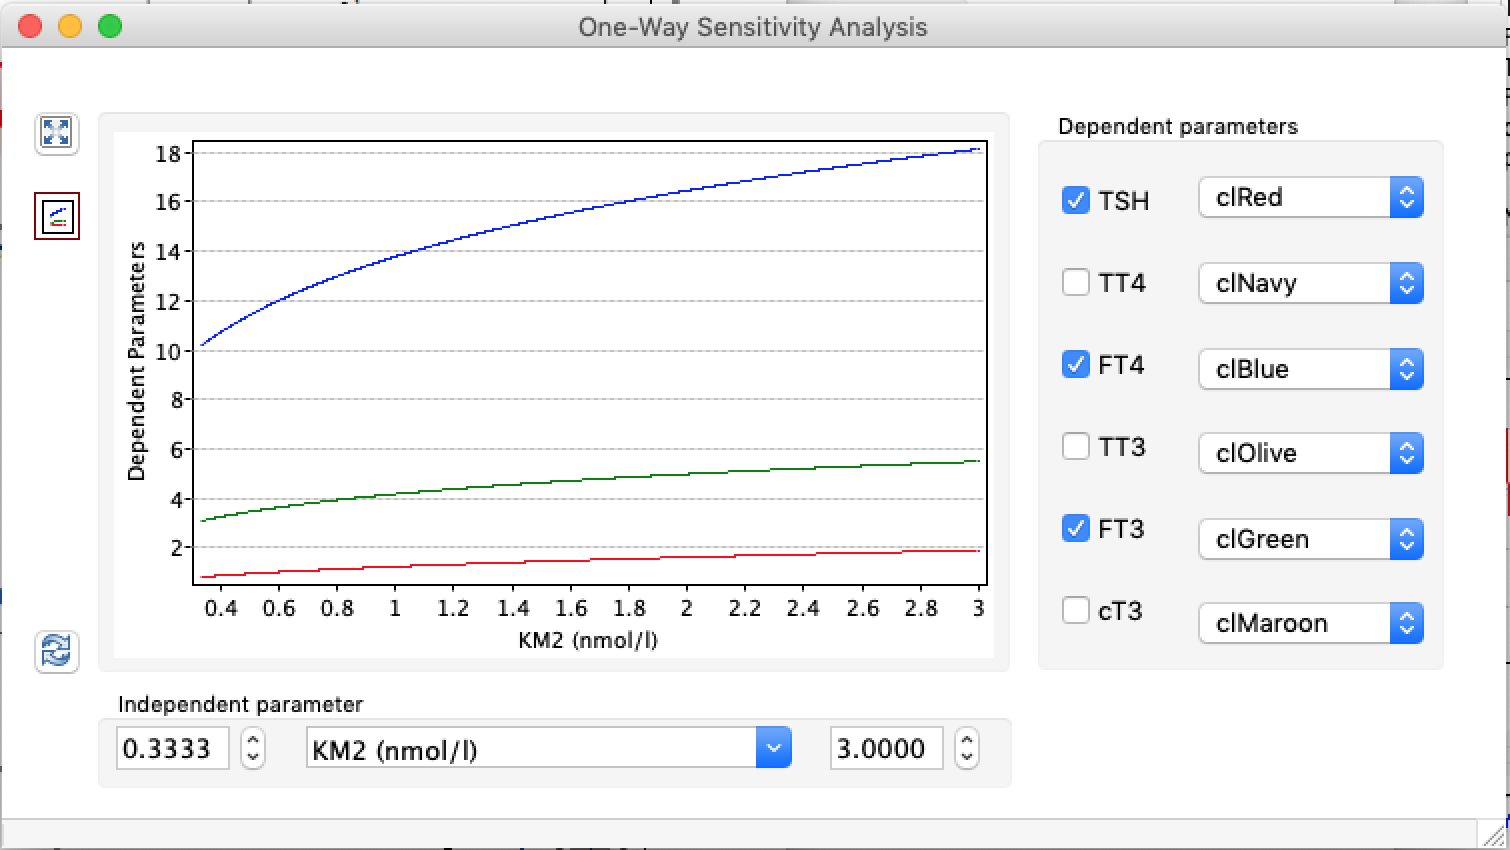
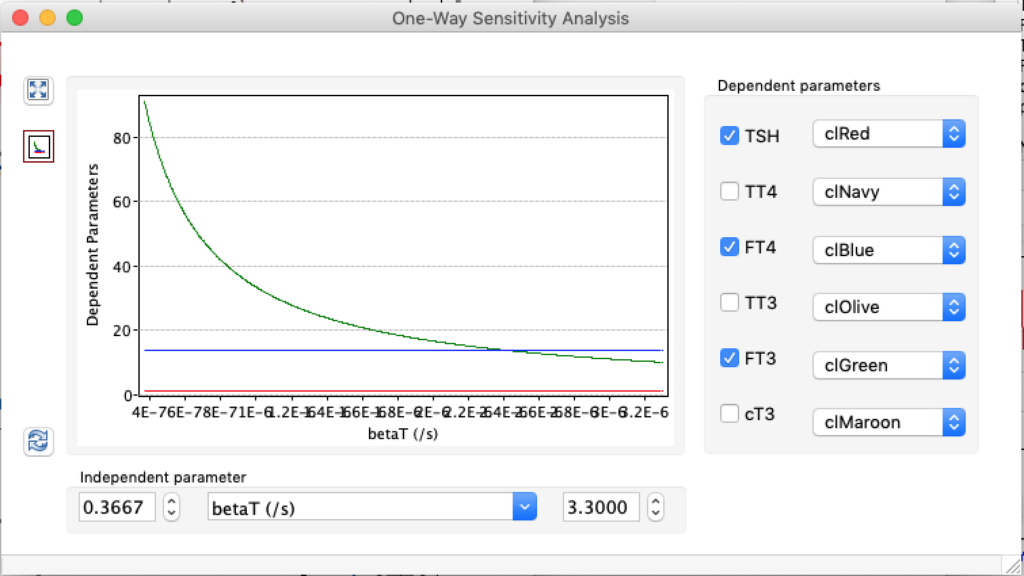
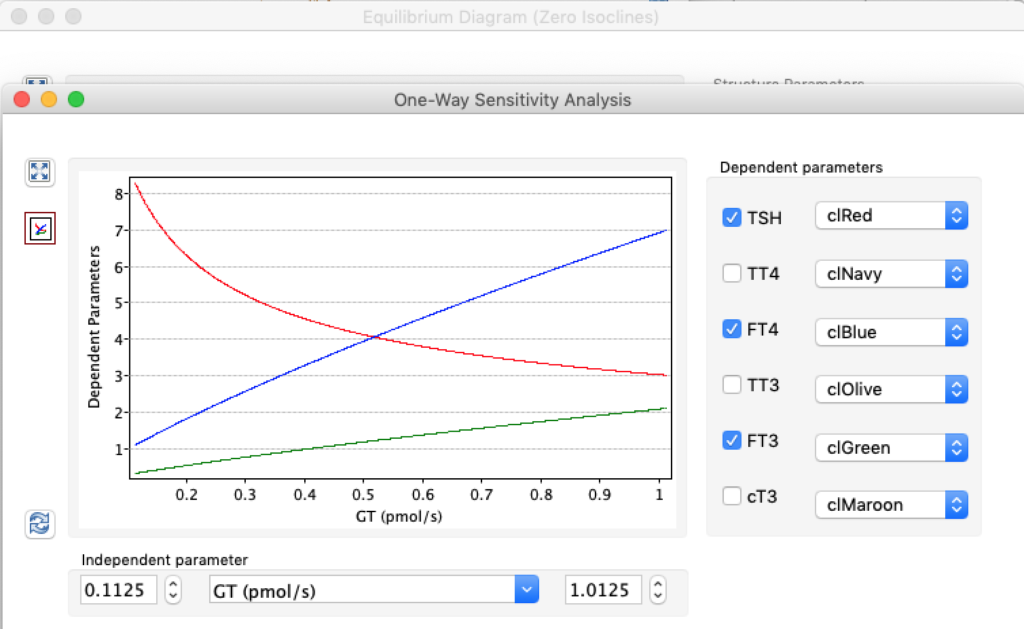
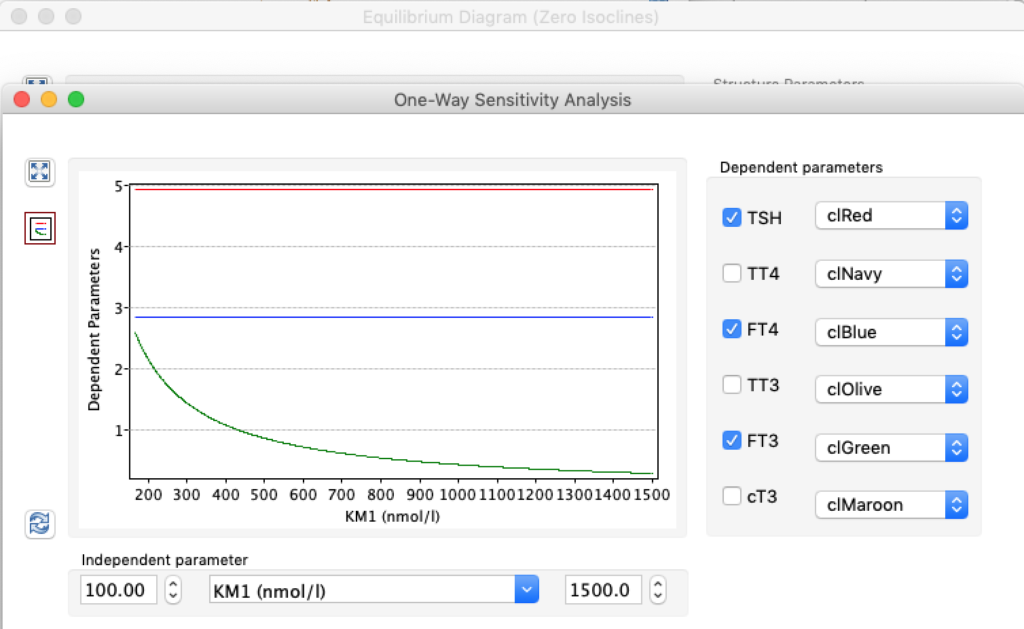
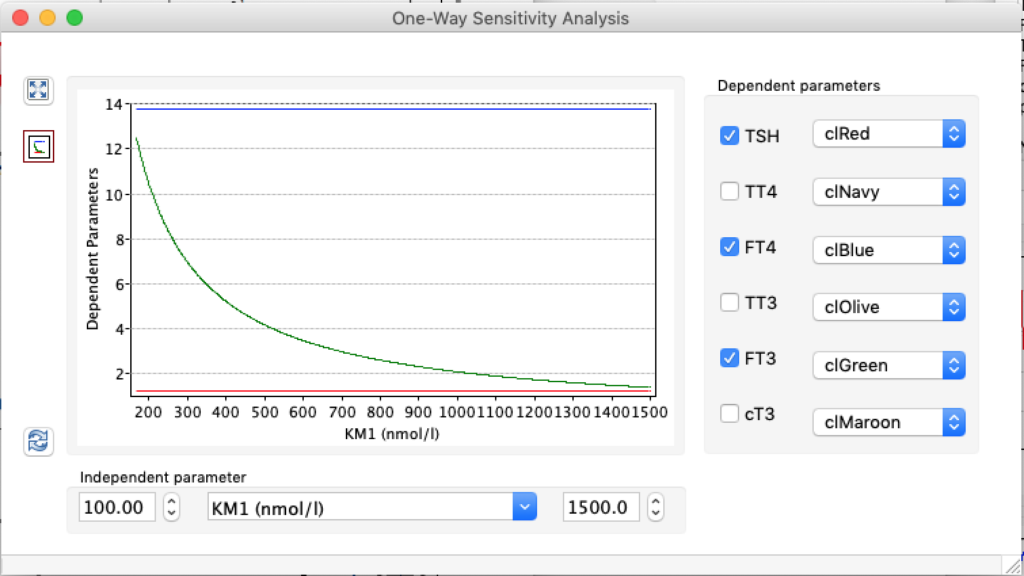
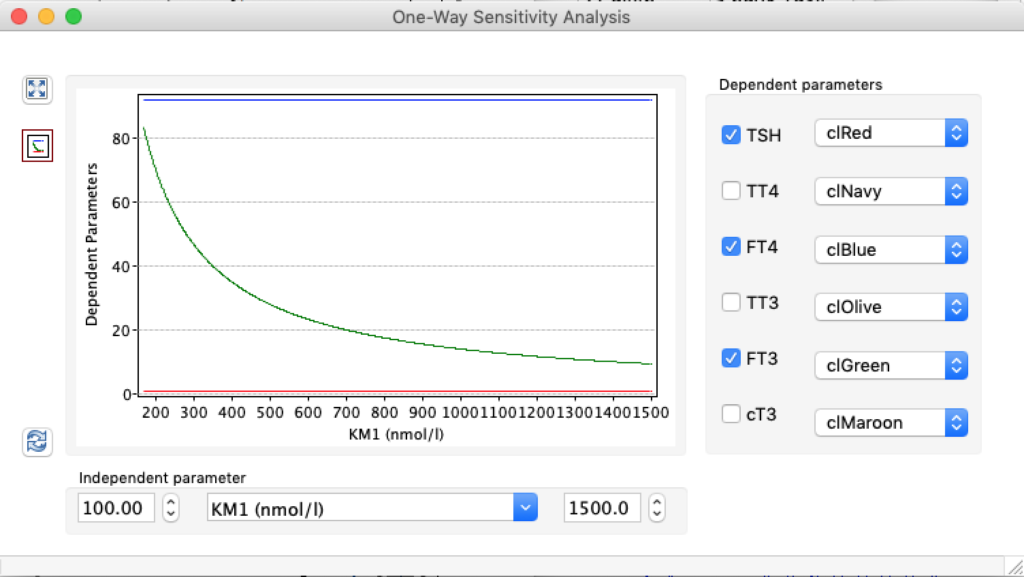
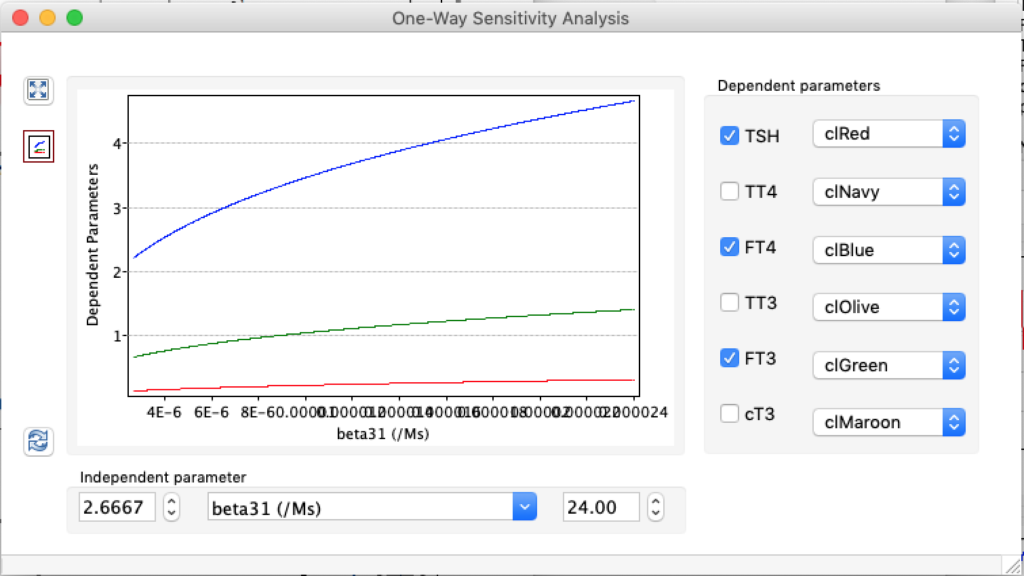
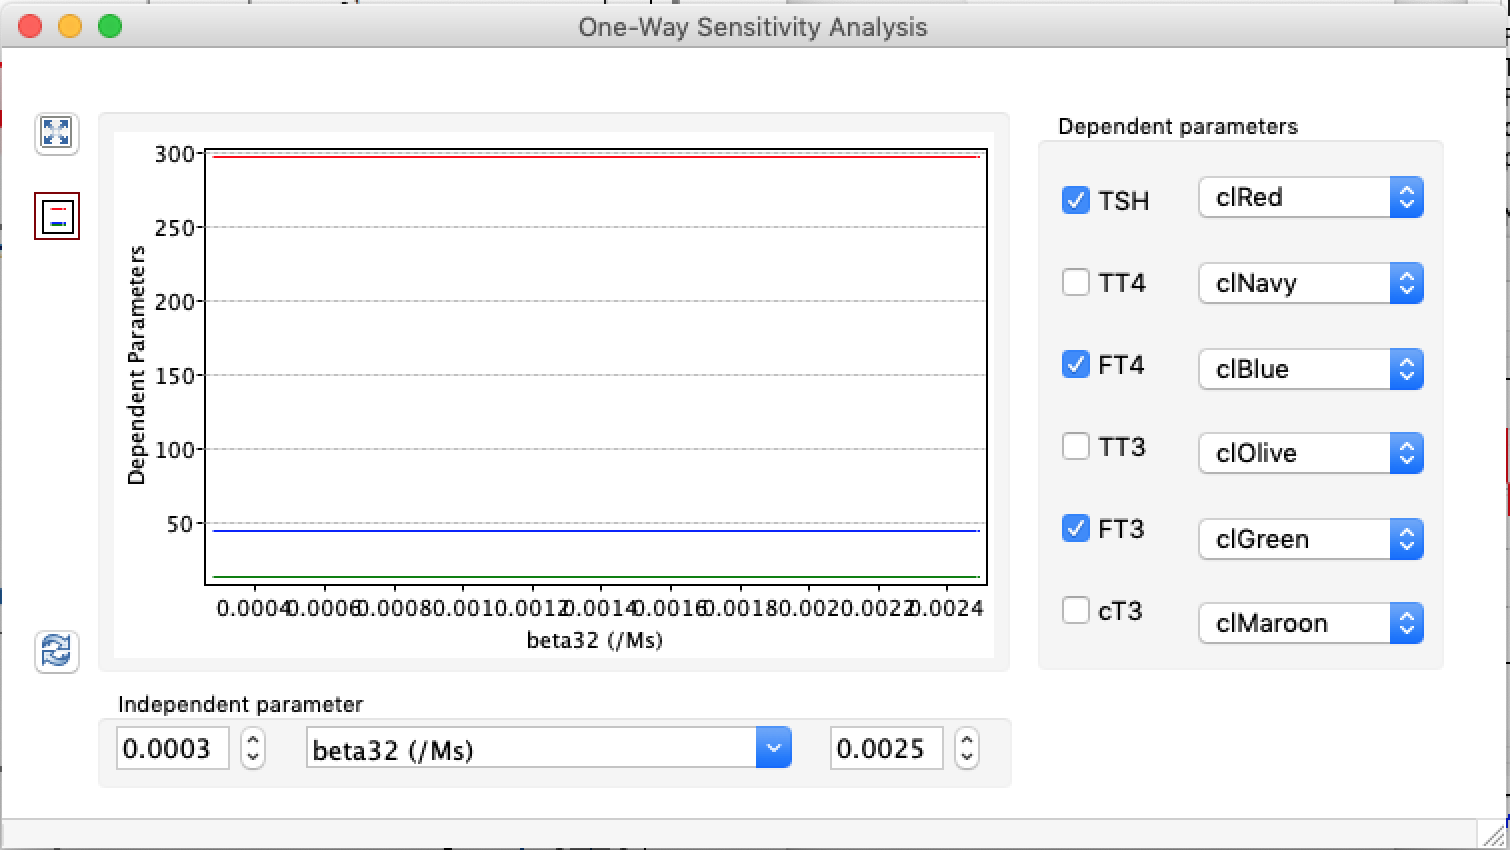
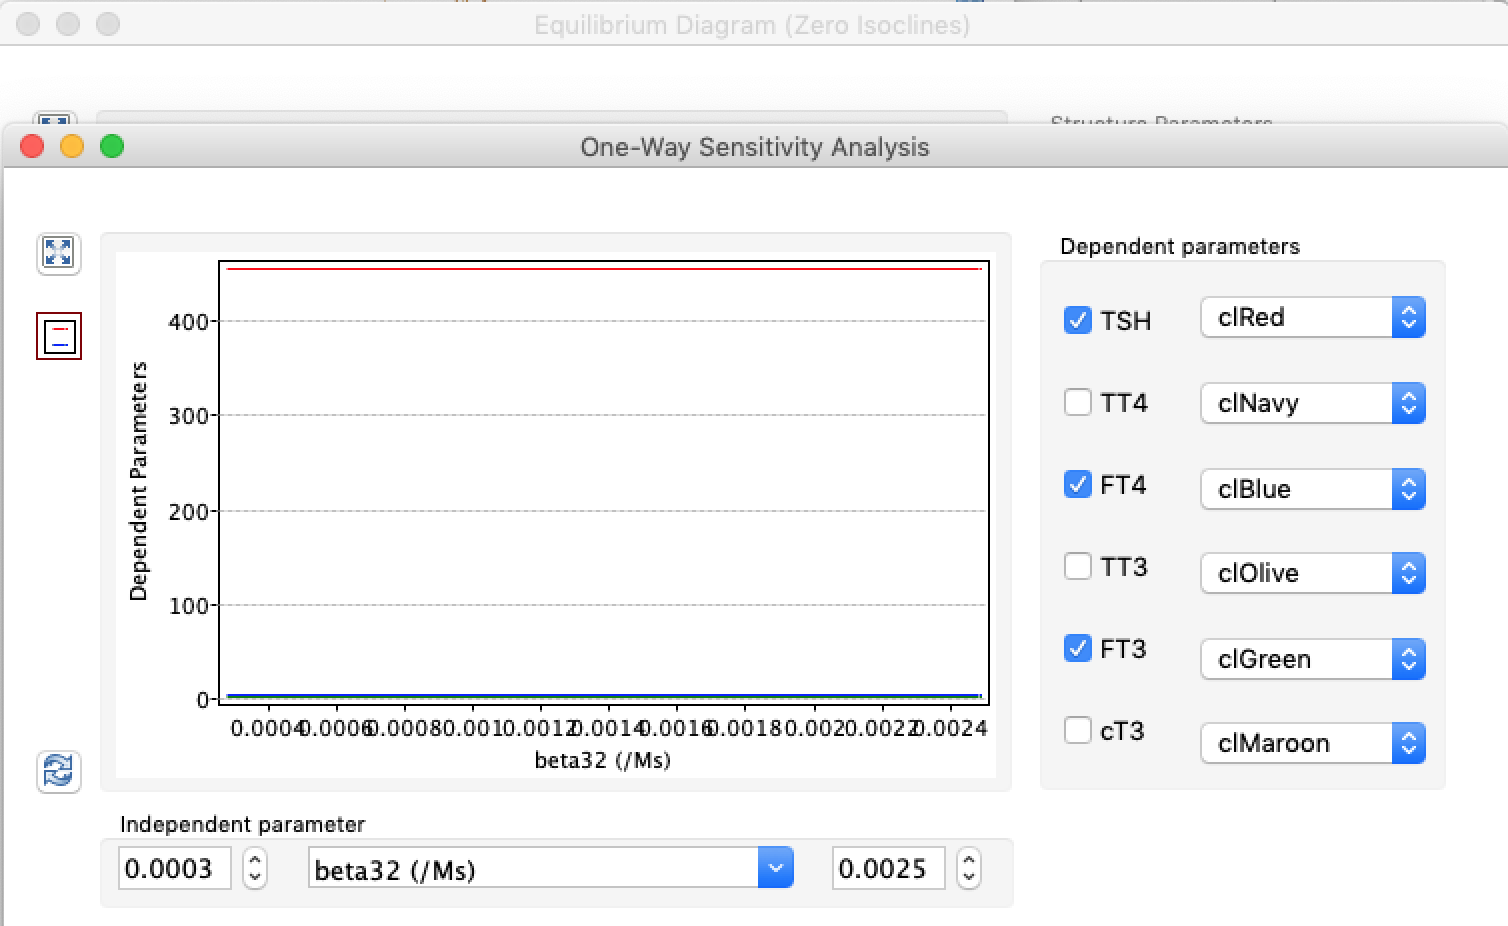
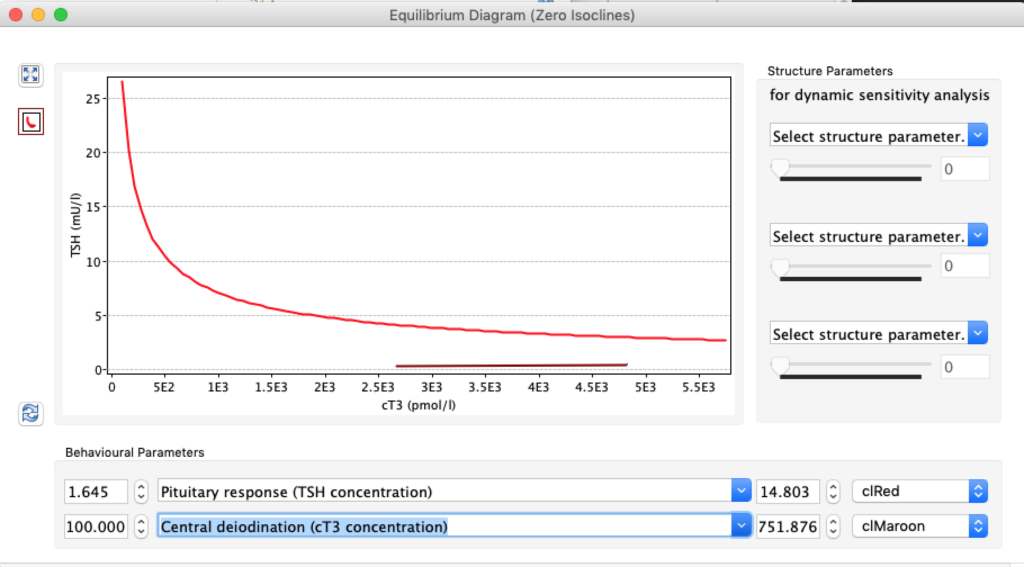
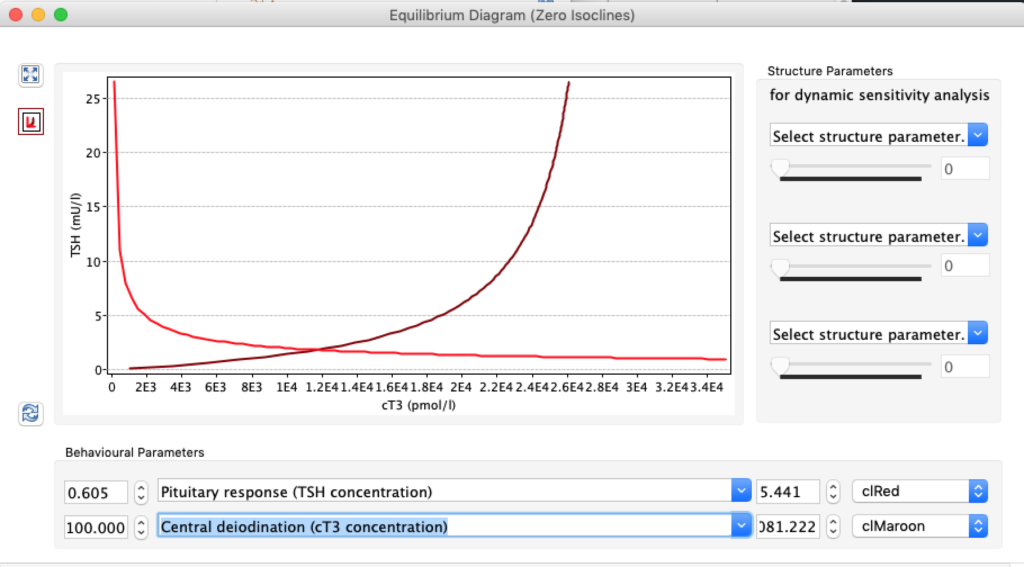
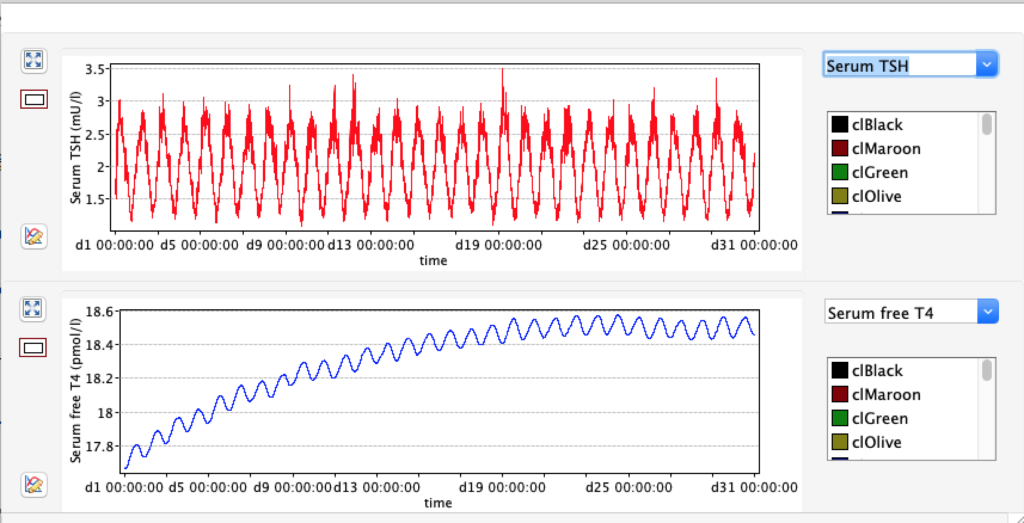
When the thyroid capacity is reduced we see changes in the thyroid hormones. Visualised below:

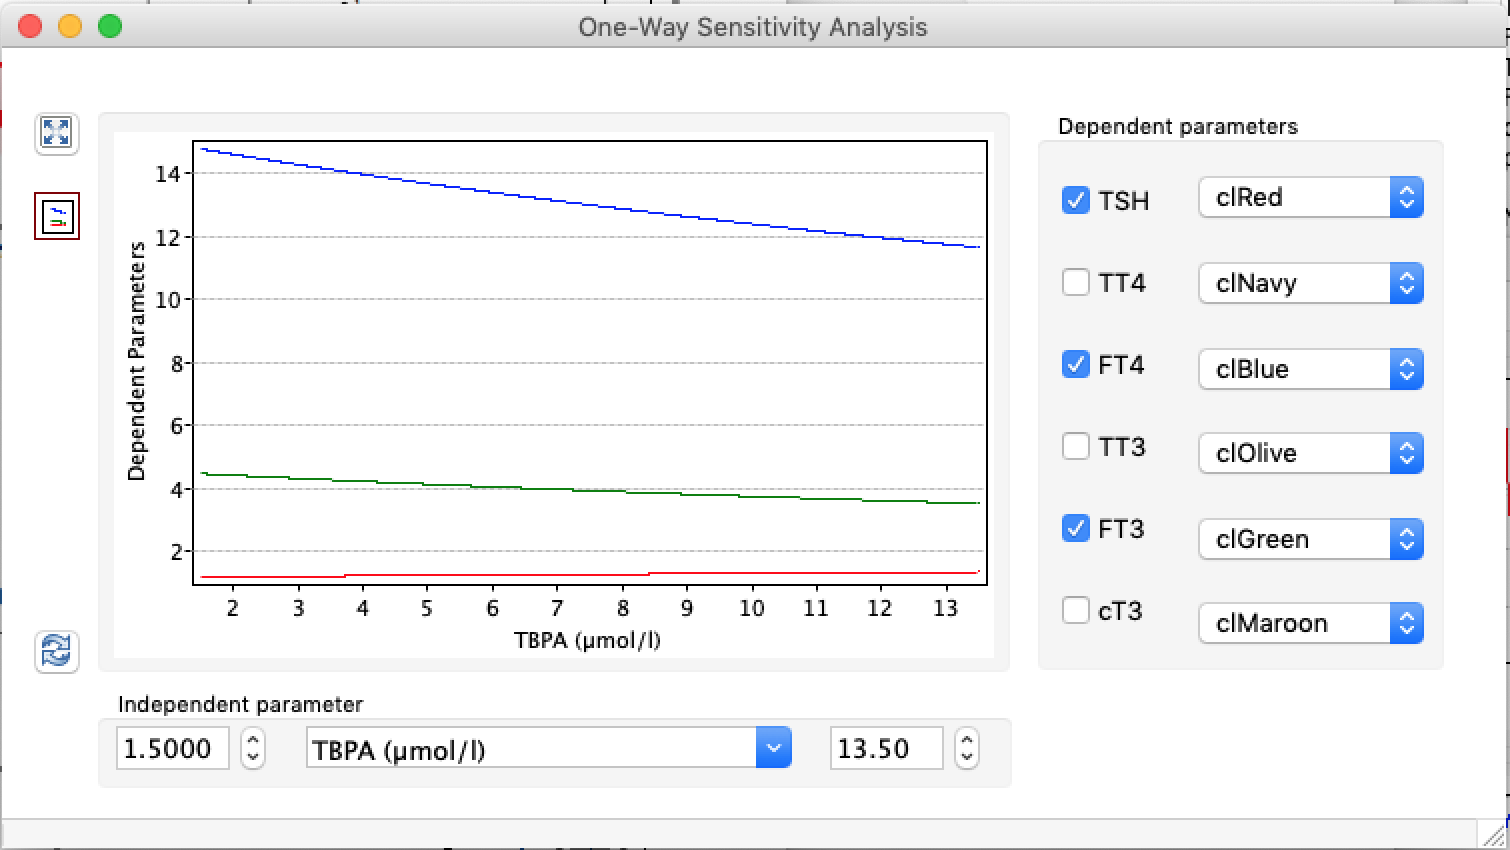
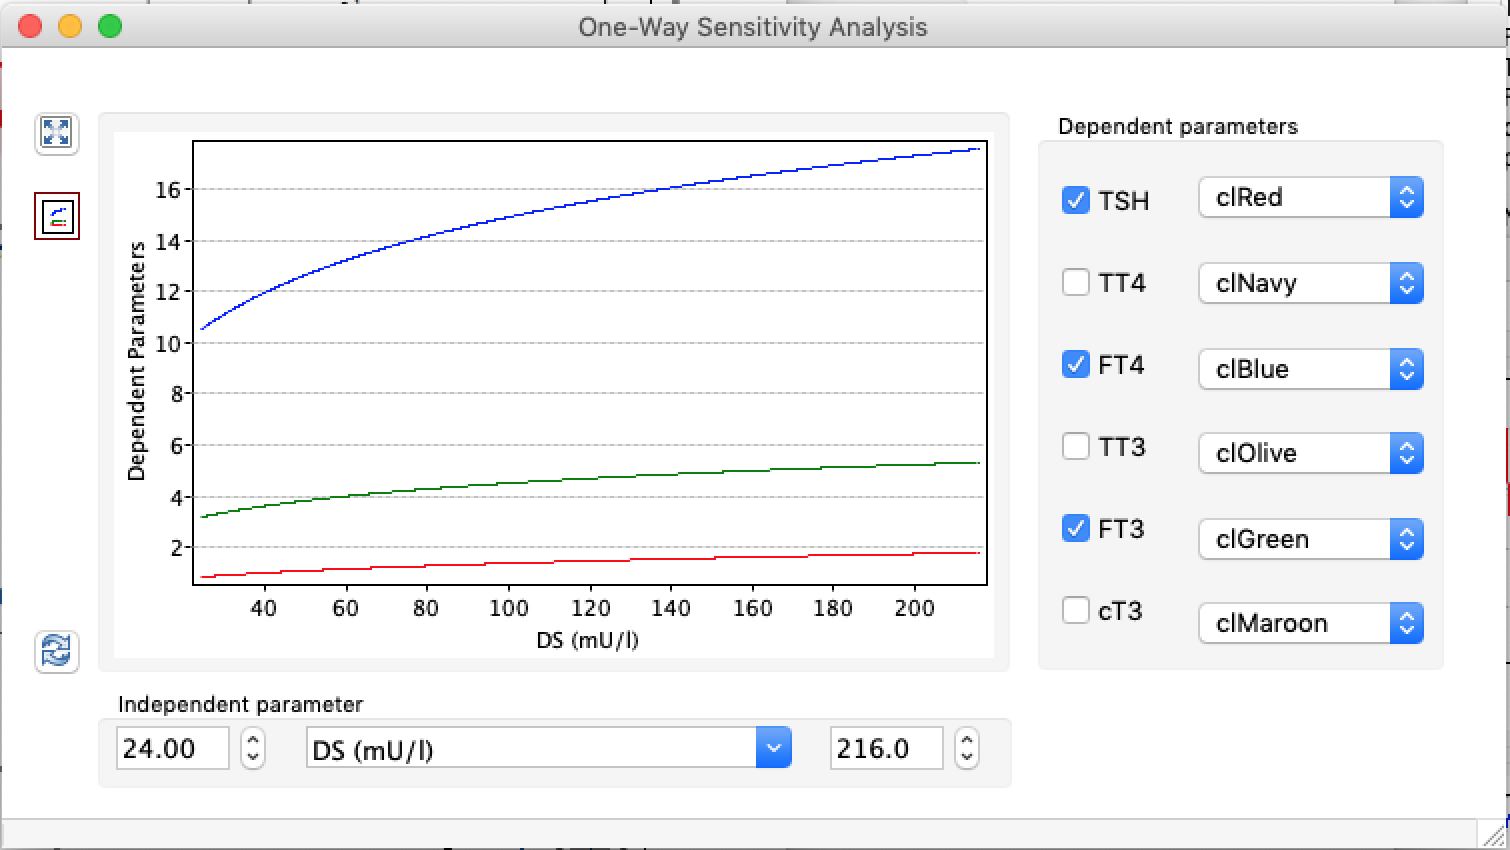
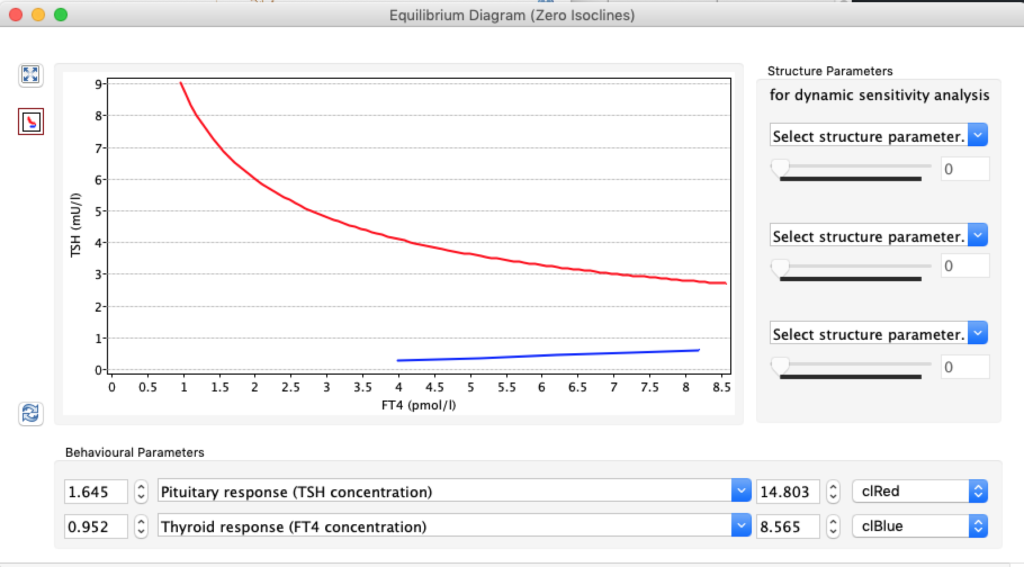
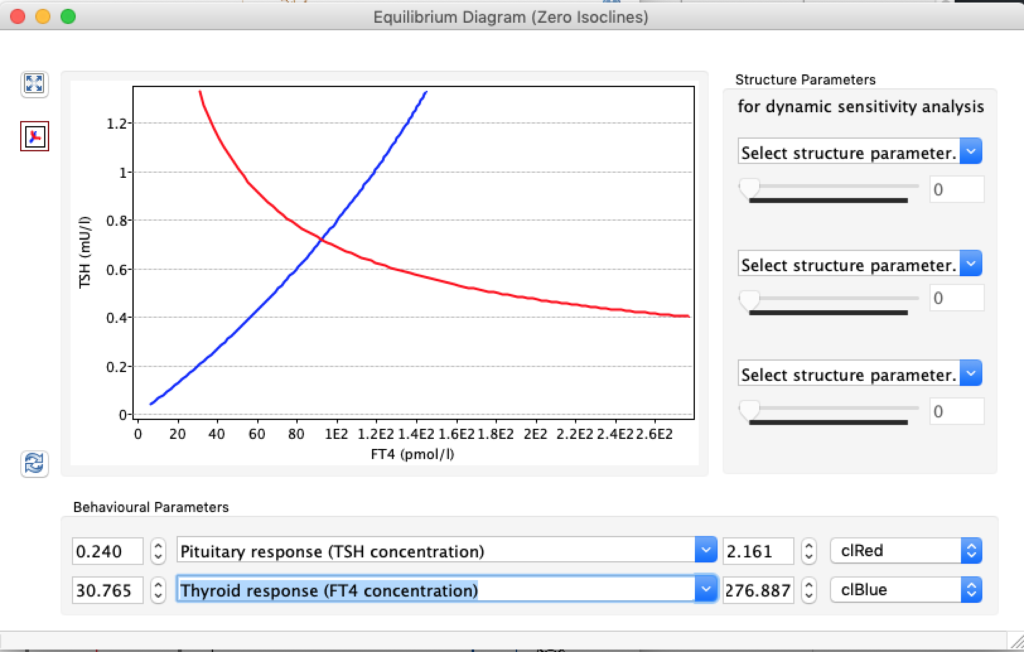
These are the standard curves:

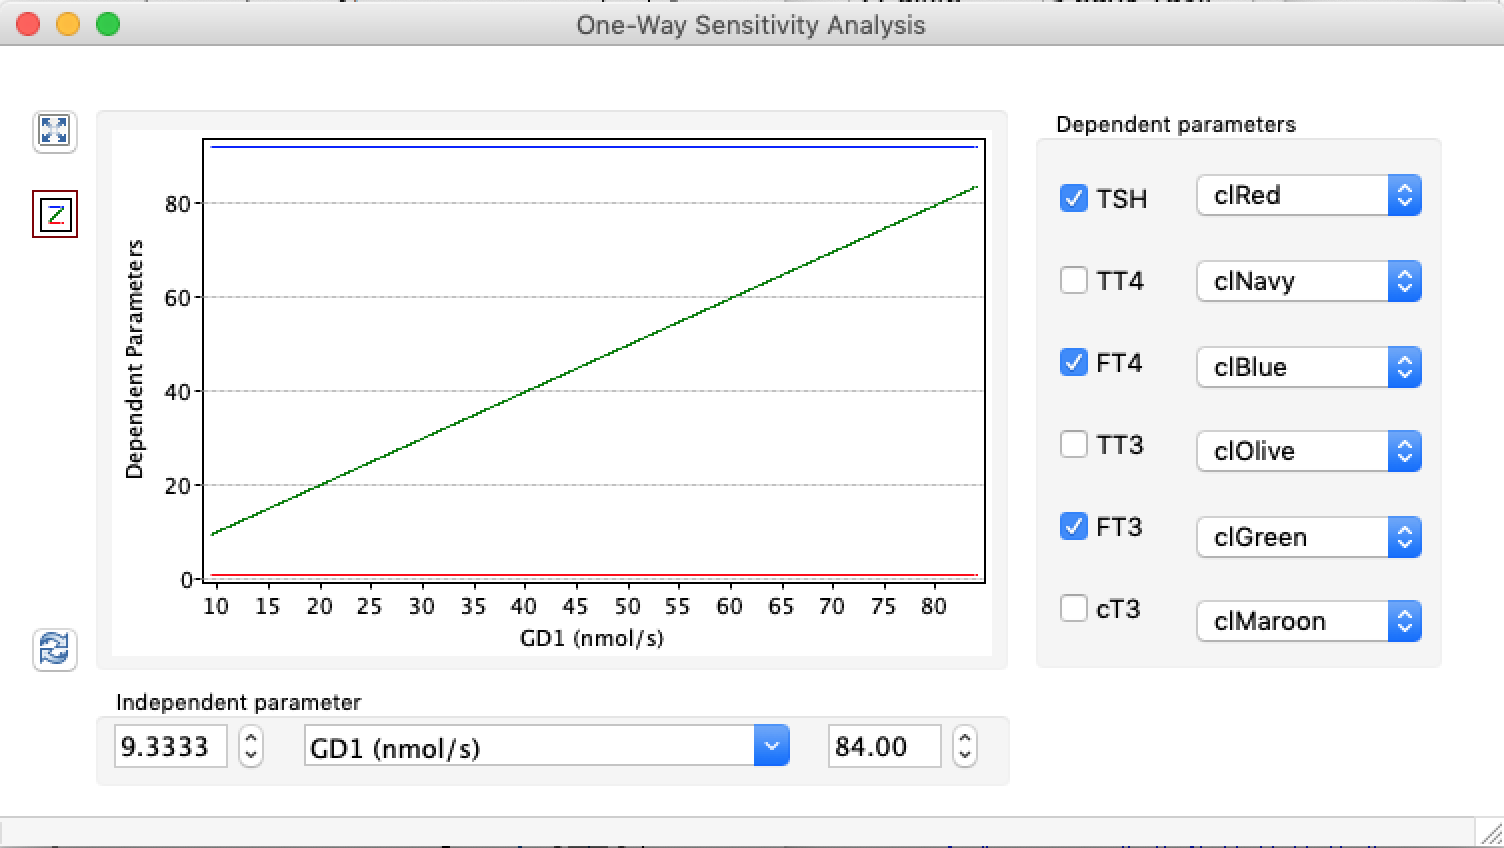
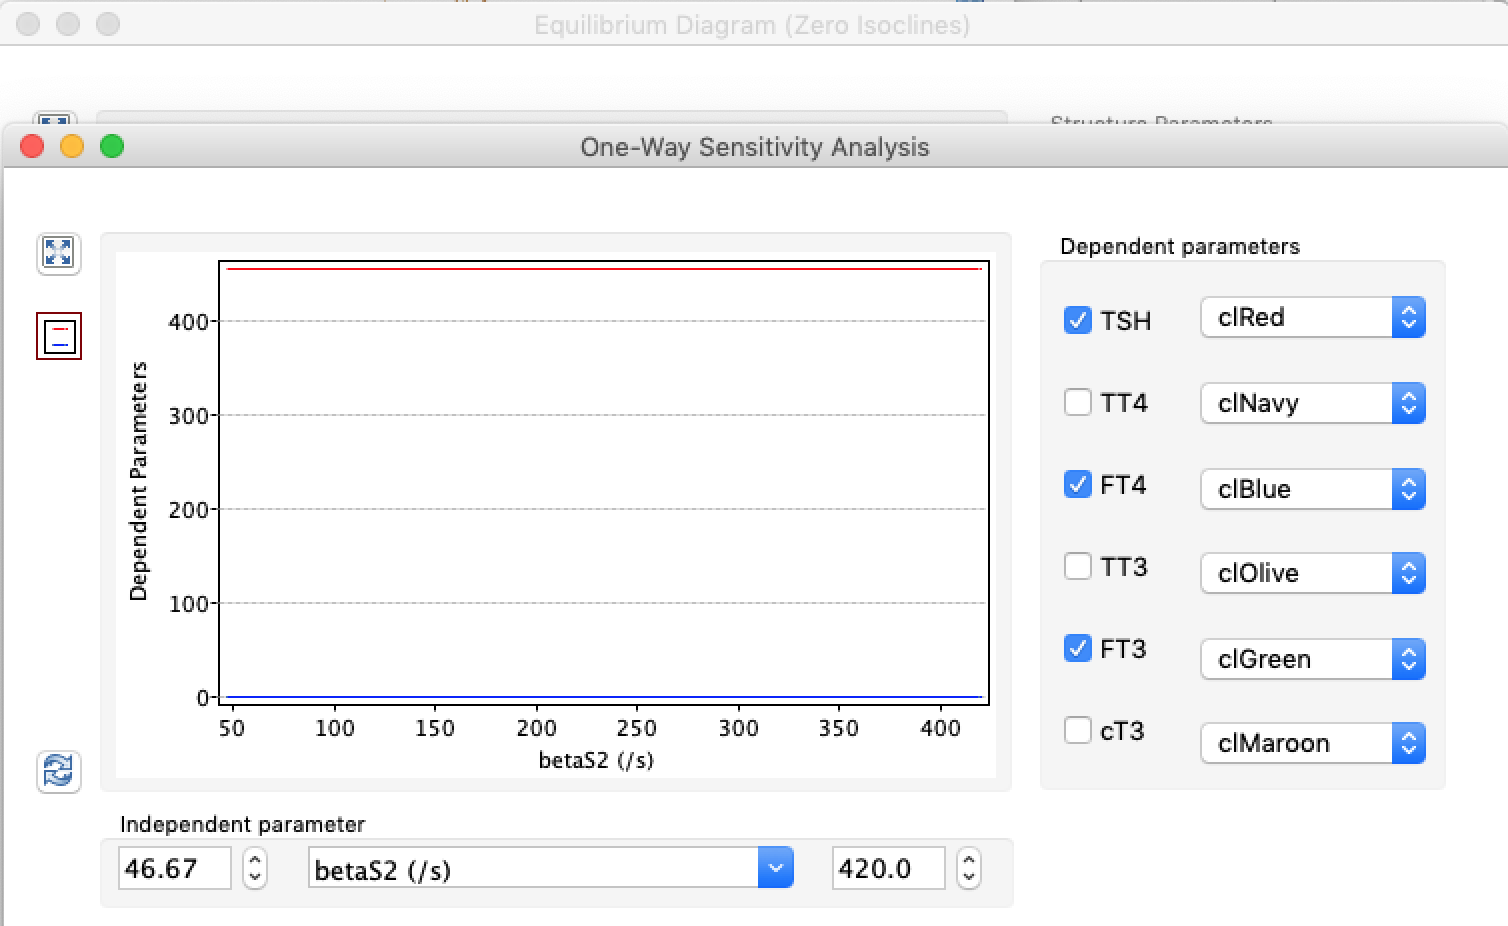
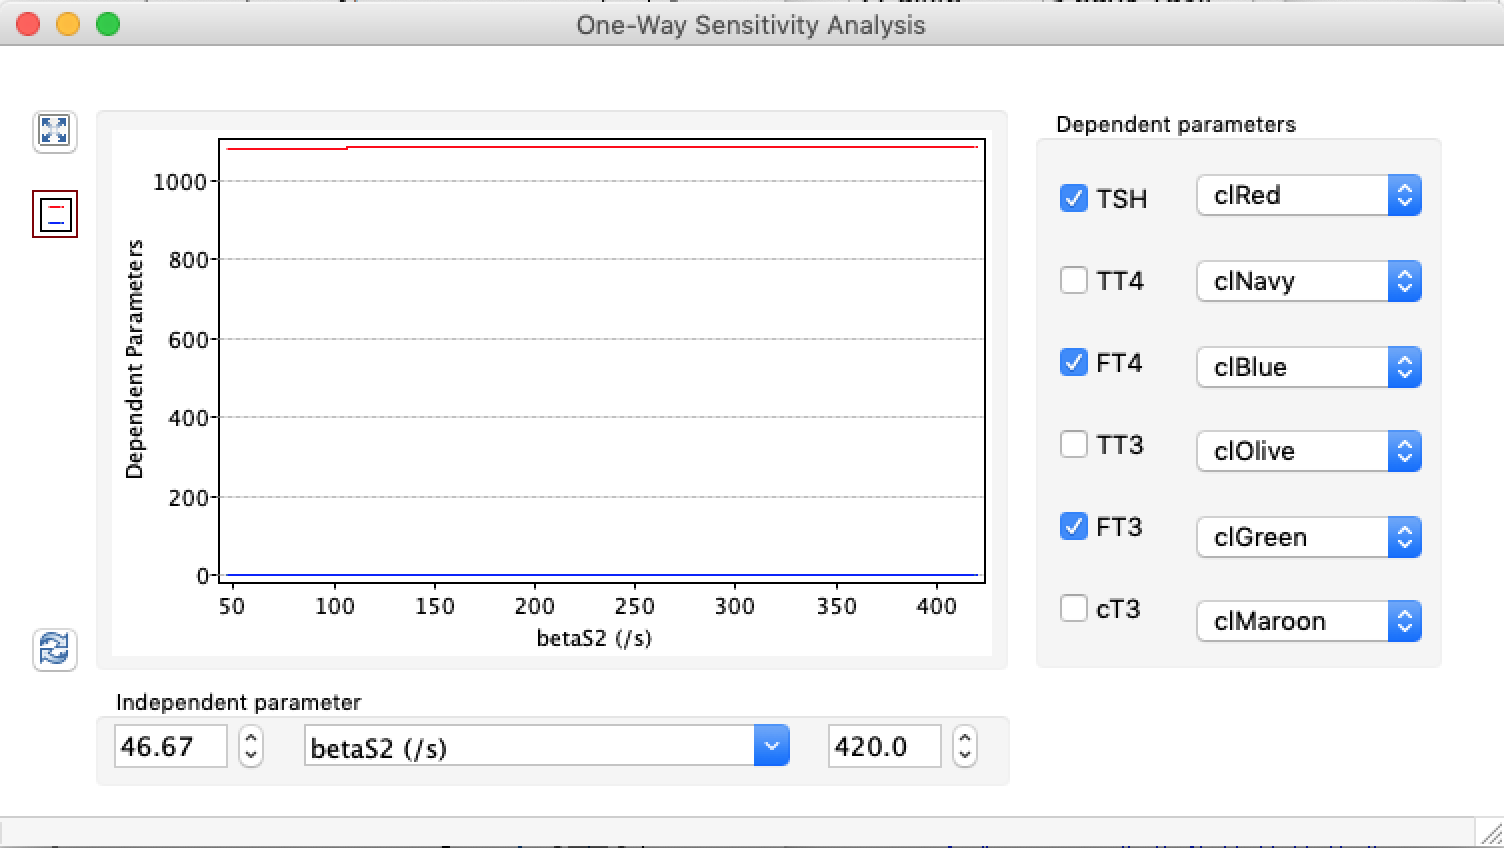
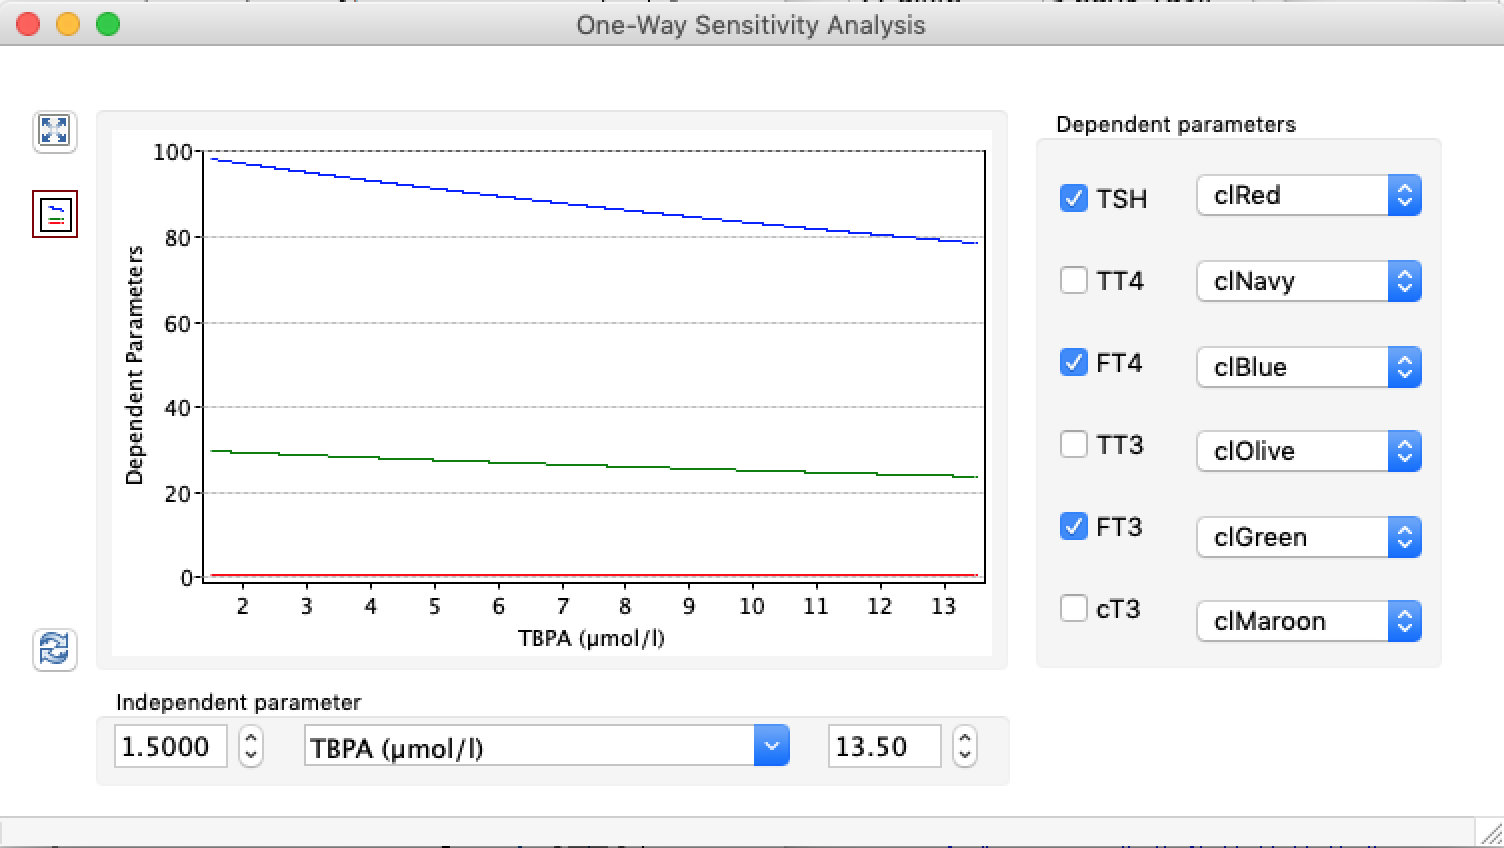
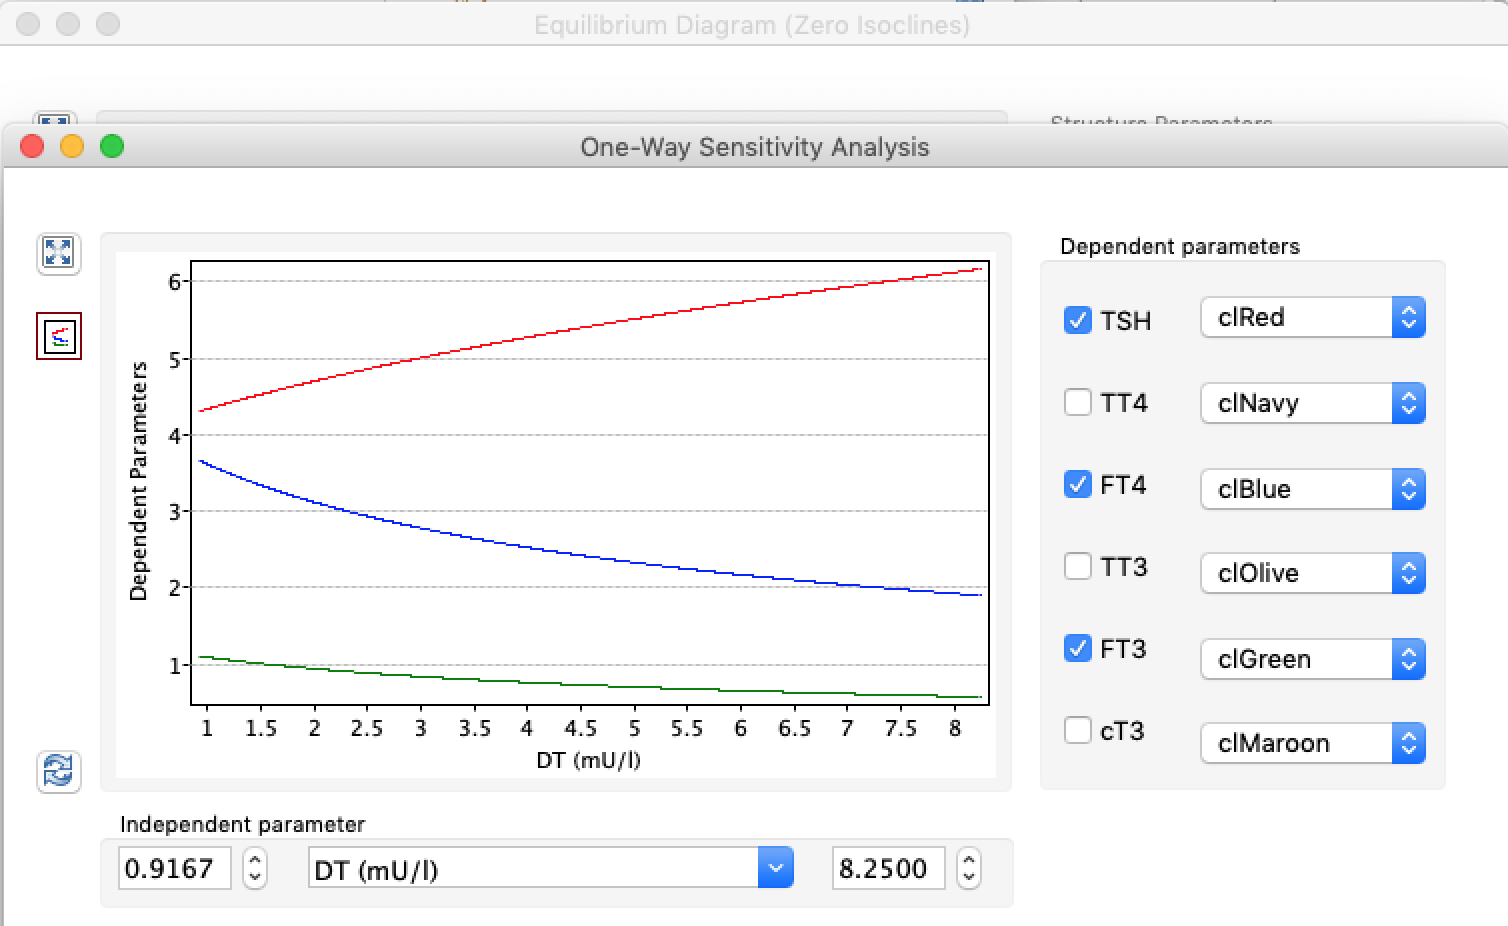
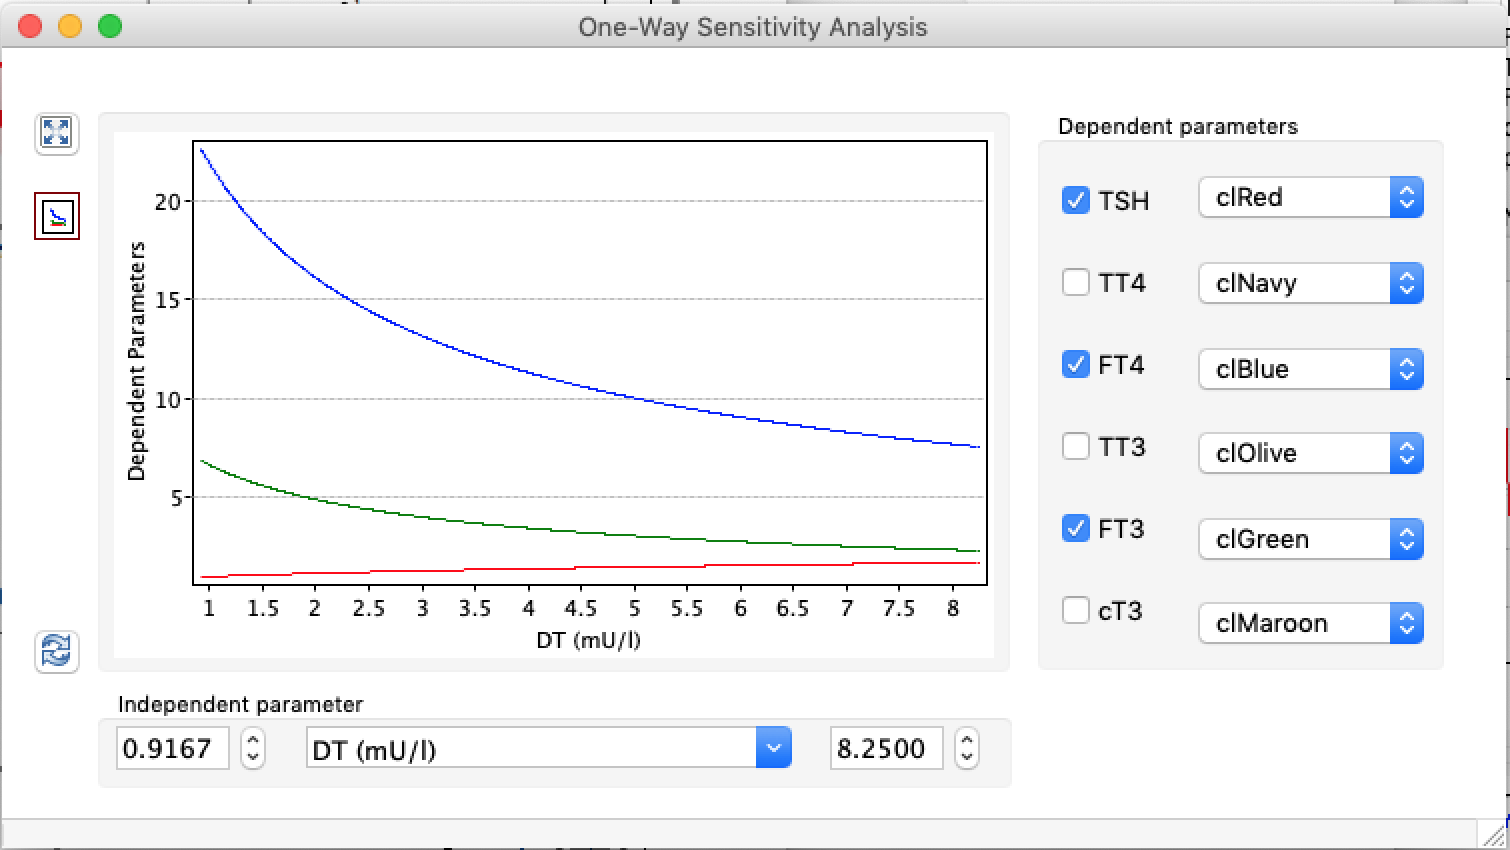
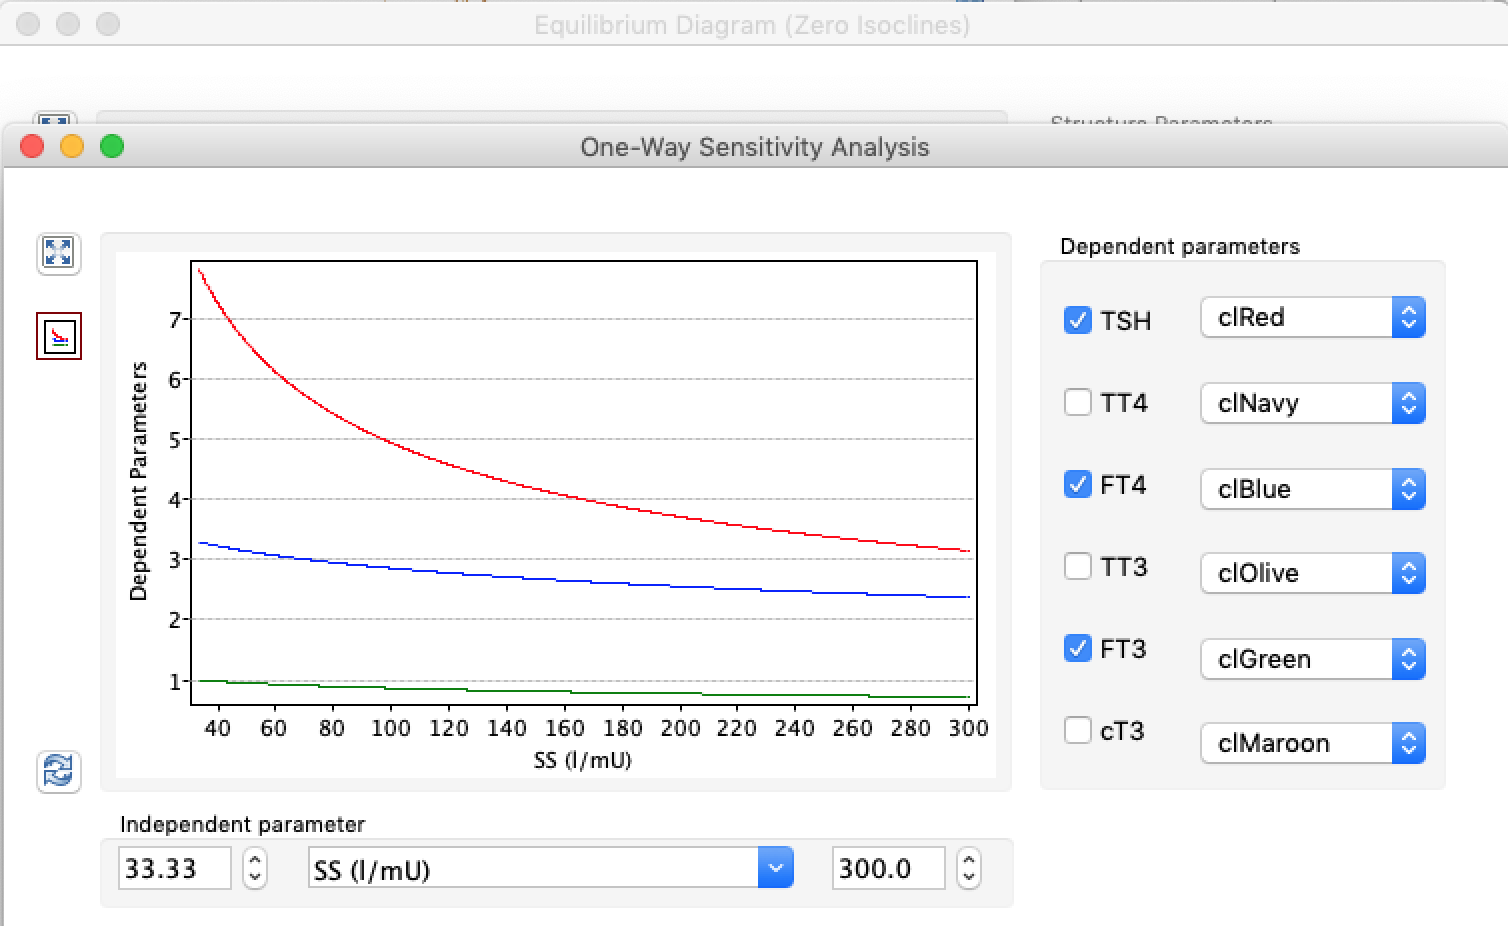
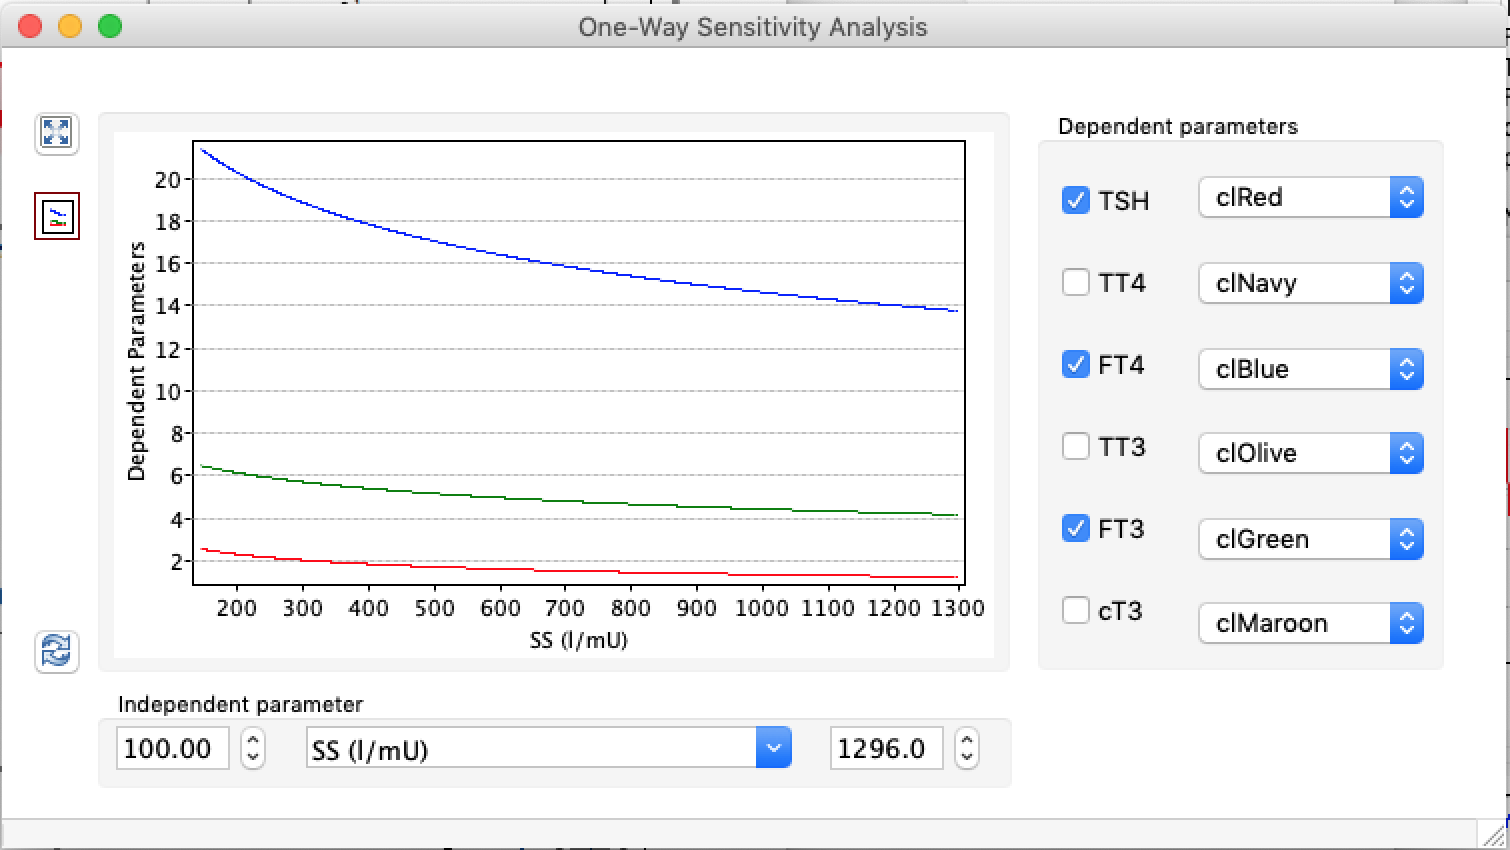
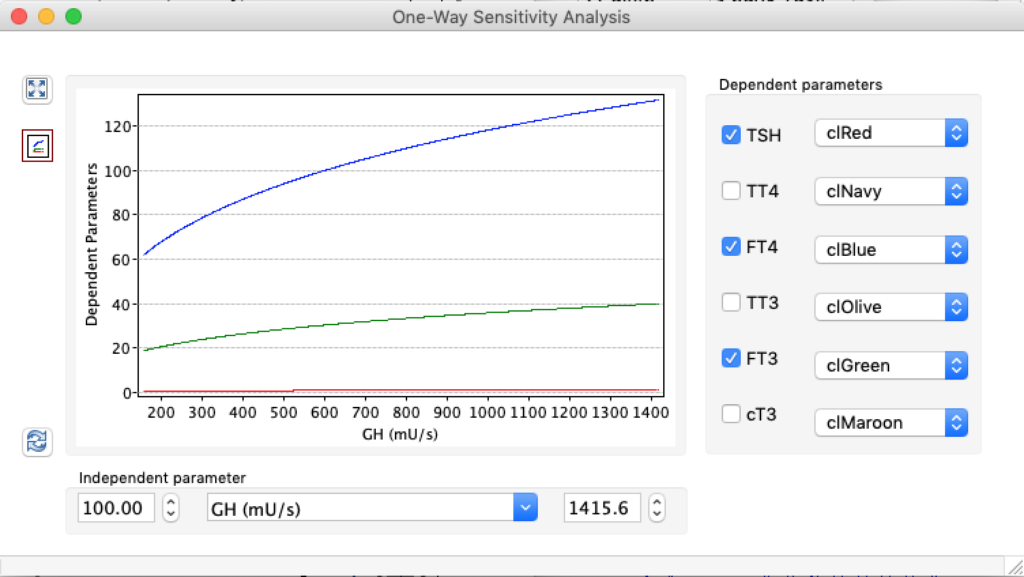
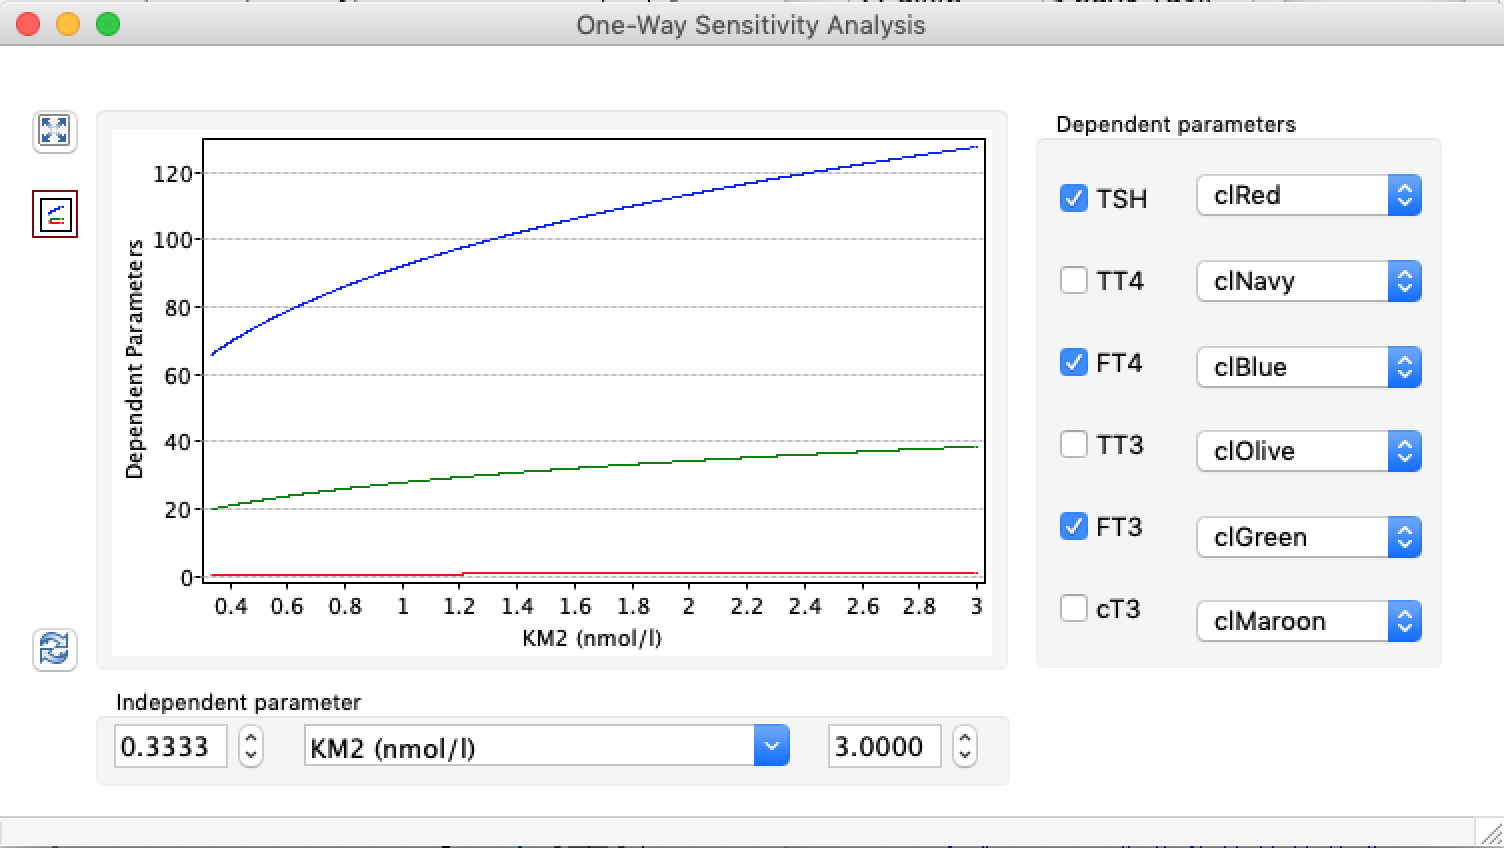
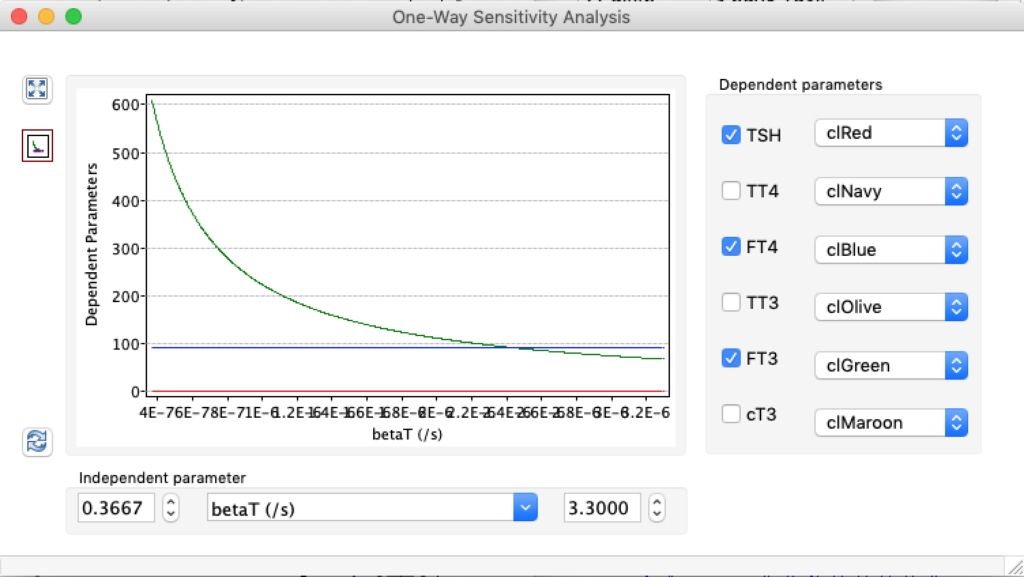
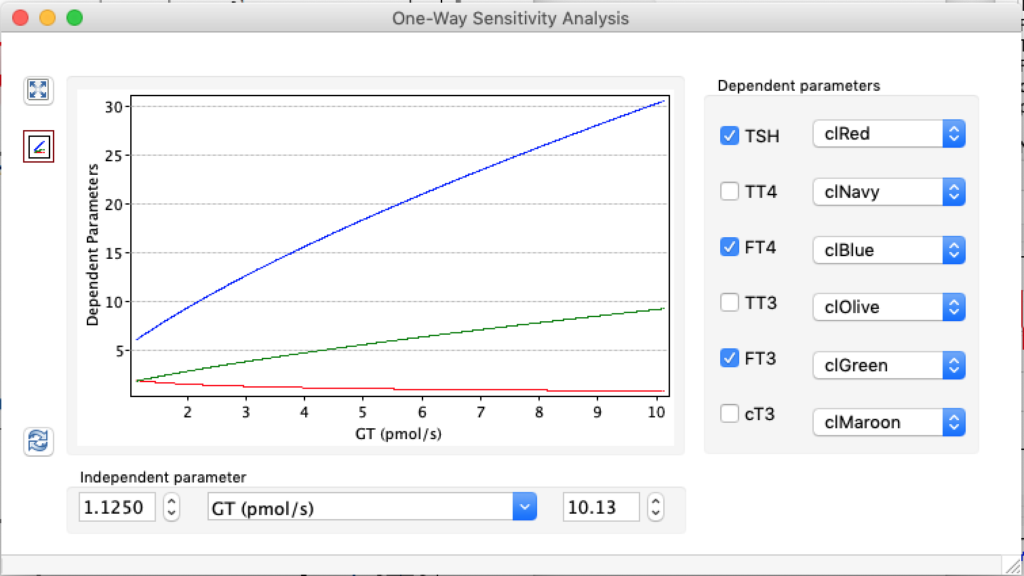
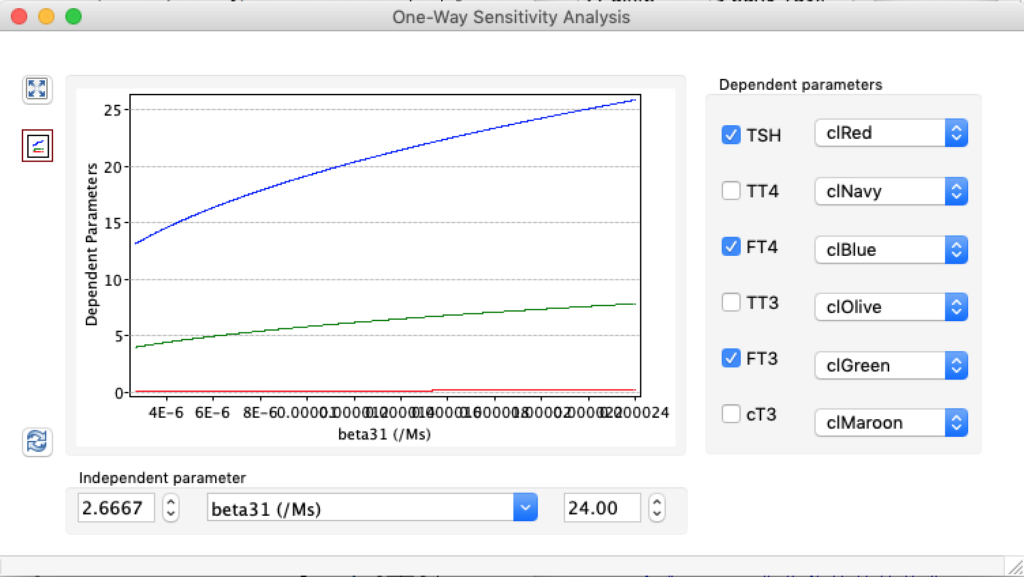
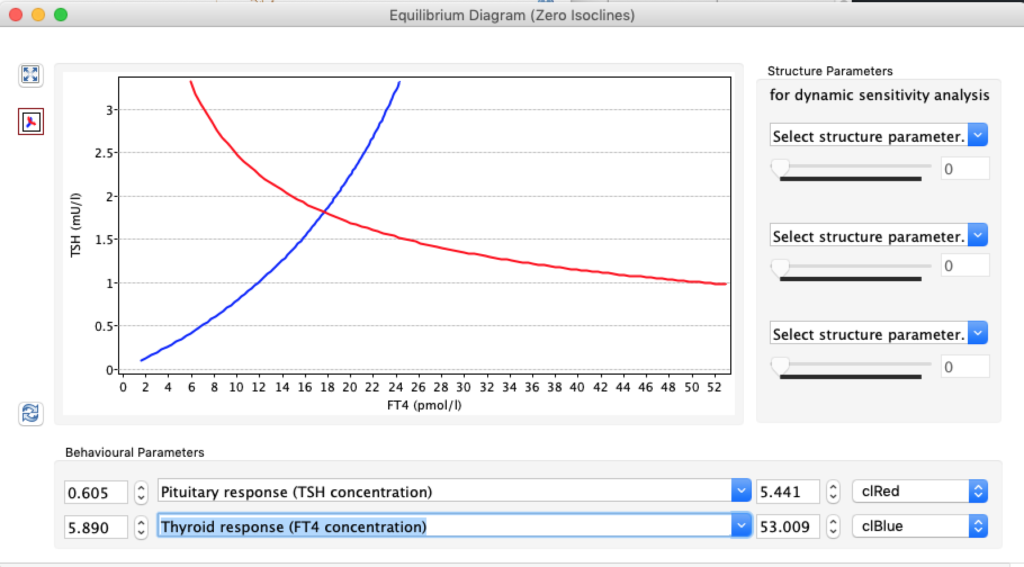
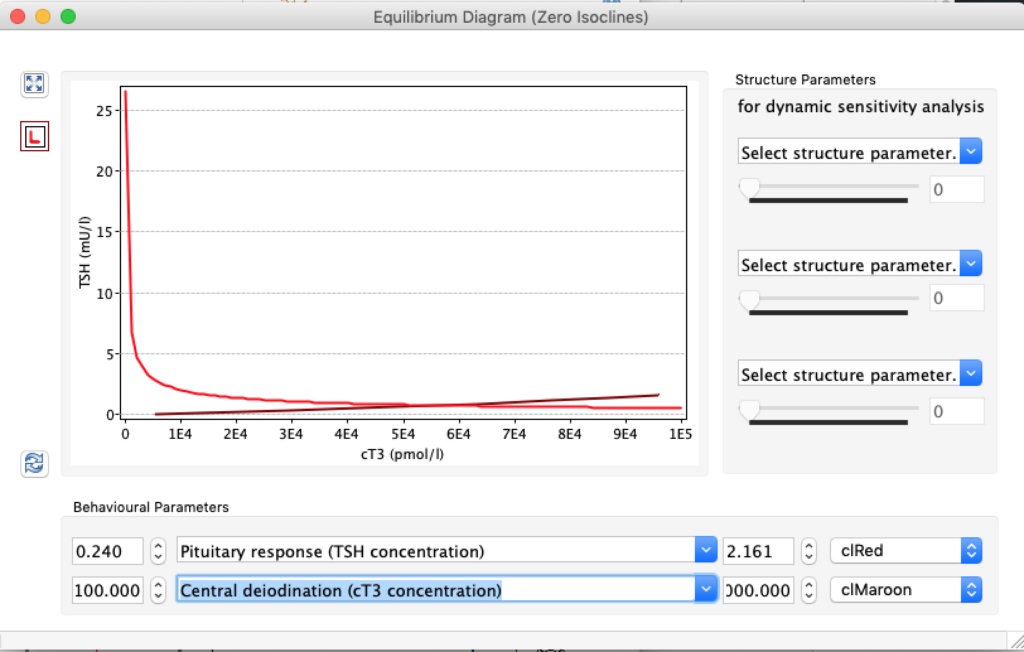
When the thyroid capacity is increased we see changes in the thyroid hormones. Visualised below:

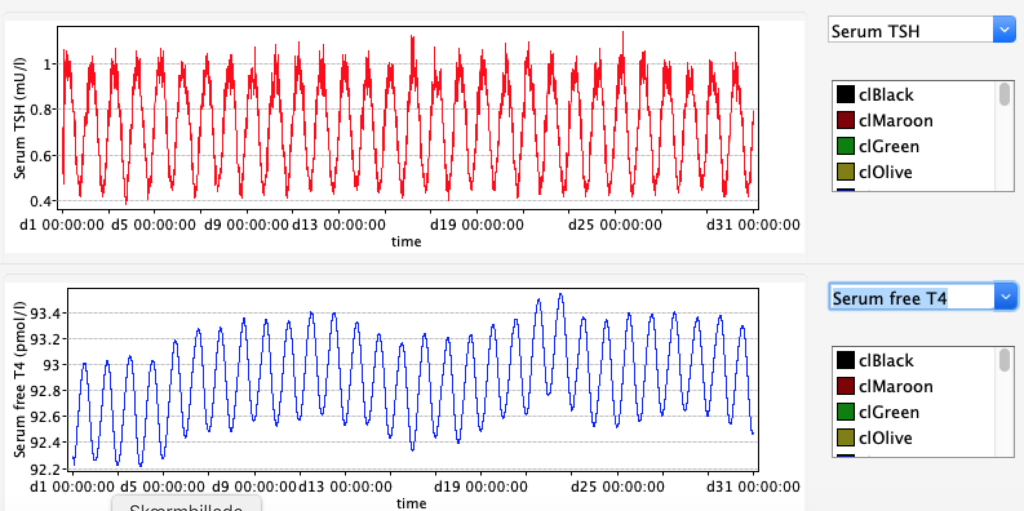
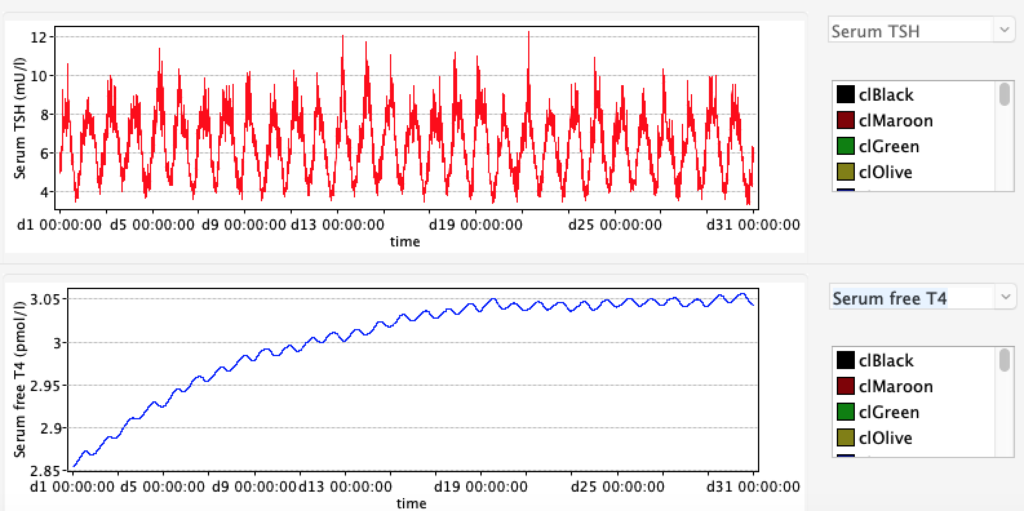
Patterns of developing hypothyroidism or hyperthyroidism.

One-Way Sensitivity Analysis – GT

GD 1: Sum activity of peripheral type 1 deiodinase (D1).
As can be seen, TSH and fT4 are horizontal and fT3 levels increase with increased GD1 level. Reflecting that increase and decrease of GD1 only affects T3/fT3 values. The green area is the reference range for GD

GD1 Decreased
GD1 Increased
GD1 Decreased
GD Increased
BetaS Decreased
BetaS Standard
BetaS Increased
Beta S2 Decreased
Beta S2 Standard
Beta S2 Increased
TBG Decreased
TBG Standard
TBG Increased
TBPA Decreased
TBPA Standard
TBPA Increased
DH Decreased
DH Standard
DH Increased
DT Decreased
DT Standard

DT Increased
GD2 Decreased
GD2 Standard
GD2 Increased
GR Decreased
GR Standard
GR Increased
LS Decreased
LS Standard
LS Increased
SS Decreased
SS Standard
SS Increased
Beta31 Decreased
Beta31 Standard
Beta31 Increased
DR Decreased
DR Standard
DR Increased
DS Decreased
DS Standard
DS Increased
GH Decreased
GH Standard
GH Increased
KM2 Decreased
KM2 Standard
KM2 Increased
BetaT Decreased
BetaT Standard
BetaT Increased
GT Decreased
GT Standard
GT Increased
KM1 Decreased
KM1 Standard
KM1 Increased
Beta31 Decreased
Beta31 Standard
Beta31 Increased
Beta32 Decreased
Beta32 Standard
Beta32 Increased

HER

In the euthyroid state, others and we have observed a considerable interindividual variability in FT4, TSH and their regulatory set points.15 39 40

Diversity:
Possible molecular mechanisms may include either different individual concentrations and affinities of TRs, variations in the distribution of iodothyronine transporters or a polymorphism in the type 2 deiodinase, which in the presence of a homozygous allele weakens the negative feedback of FT4 on TSH in humans.40 41

Tornado plot – GT

Decreased GT

3.375E-13 -TSH
3.375E-13 – FT3
3.375E-13 – FT4

Standard GT

Standard -TSH
Standard – FT3
Standard – FT4

Increased GT

3.375E-11 – TSH
3.375E-11 – FT3
3.375E-11 – FT4

Accordingly, hypothyroidism and hyperthyroidism present adaptive challenges to the homeostatic system to restore euthyroidism or at least ameliorate the dysfunctional state.

Resulting tornado plots show that the influence of various structure parameters on TSH level also depends on the overall function of the feedback loop, suggesting a distorted reaction in hypothyroidism or hyperthyroidism (see above). The overall relation appears to be modulated by additional regulatory loops other than the classical feedback control in the different functional states. Both the log TSH-FT4 analysis and the alternate model based on non-competitive divisive inhibition, while different in their methodological approach, yield comparable results.

Of notice:
For TSH – betaS is the most sensitive parameter

Clearance exponent for peripheral TSH is 2,3 x 10⁻⁴s-1 Calculated from plasma half-life of 50 min ([11 : Therefore, the elevated plasma TSH levels found in hypothyroidism are a result of both slower degradation and increase in rate of secretion.), 12])

Equilibrium Diagram

The Equilibrium Diagram offers an excellent overview of which parameters influences TSH and fT4 and cT3 (note that there is thousands of combinations as you can choose from three behavioural parameters and 16 structure parameters):


The application is based on the underlying assumption that pituitary TSH in equilibrium at all times provides an accurate mirror image of the peripheral hormones. However, recent evidence has challenged this simplistic tenet suggesting that the HPT axis is a much more dynamic system than has been previously thought (5, 22). In particular, the interrelationships between FT3, FT4, and TSH are less constantly fixed, rather conditional and contextualy adaptive (5, 22). (Berberich J, Dietrich JW, Hoermann R and Müller MA (2018) Mathematical Modeling of the Pituitary–Thyroid Feedback Loop: Role of a TSH-T3-Shunt and Sensitivity Analysis. Front. Endocrinol. 9:91. doi: 10.3389/fendo.2018.00091)

Our results suggest that the decreased serum T3 is a major cause of impaired TSH-thyroid hormone feedback control in hypothyroidism treated with LT4. D&M Solter https://doi.org/10.1016/j.ando.2017.11.003