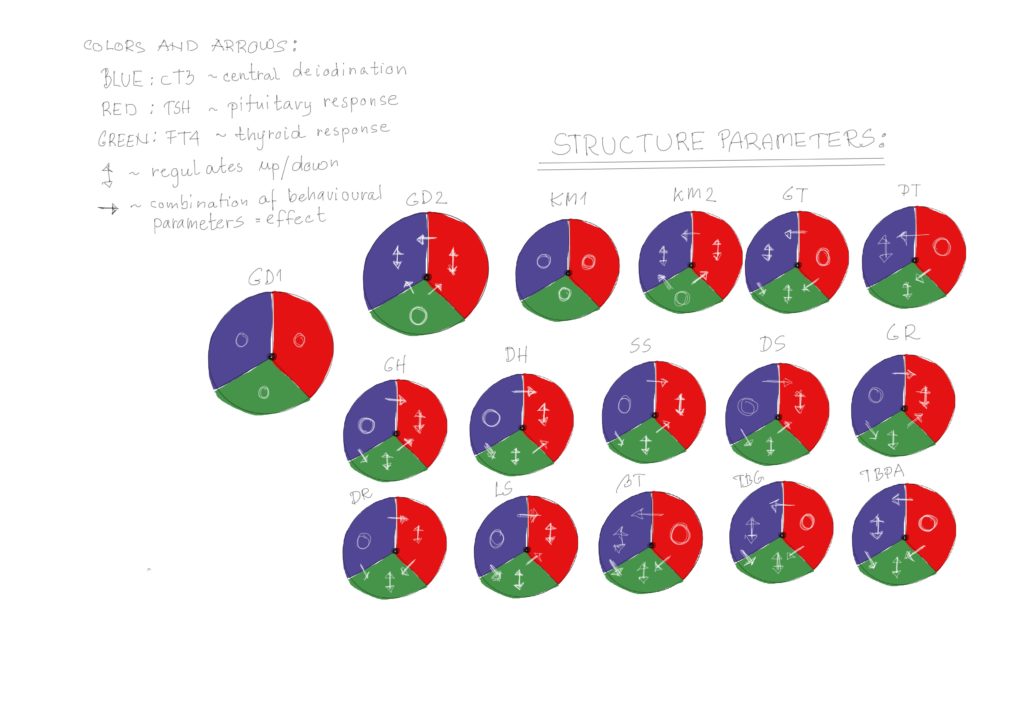
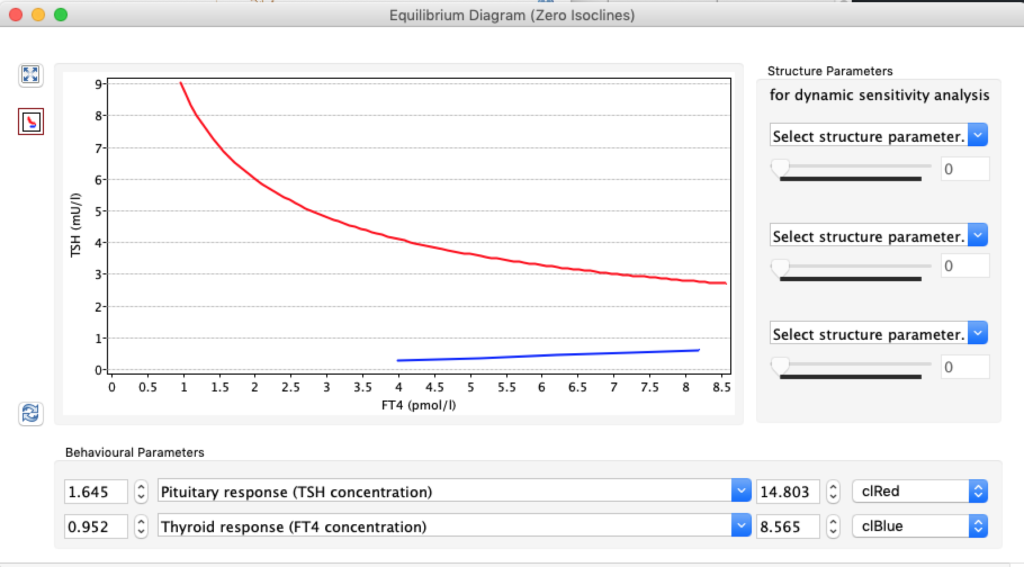
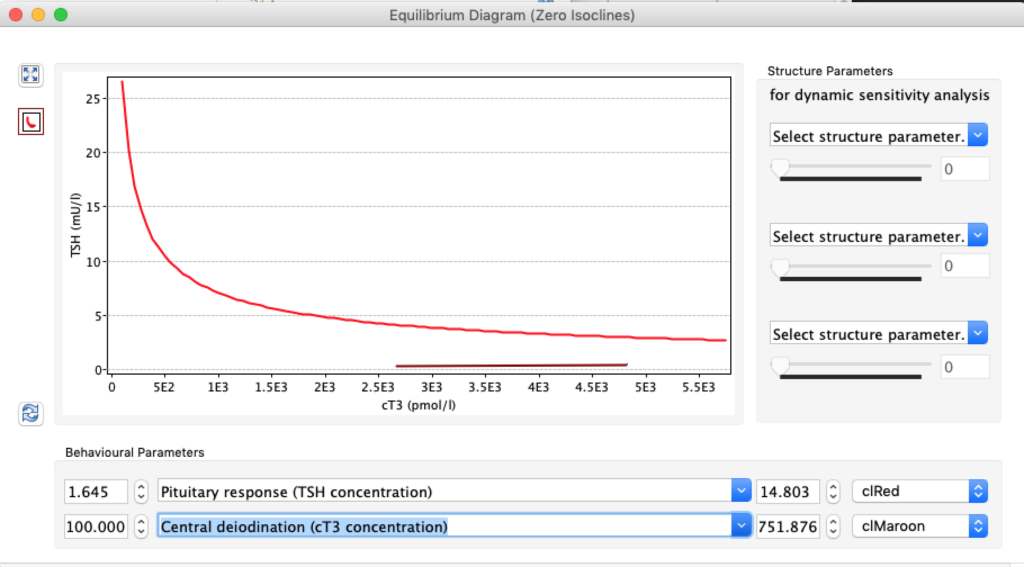
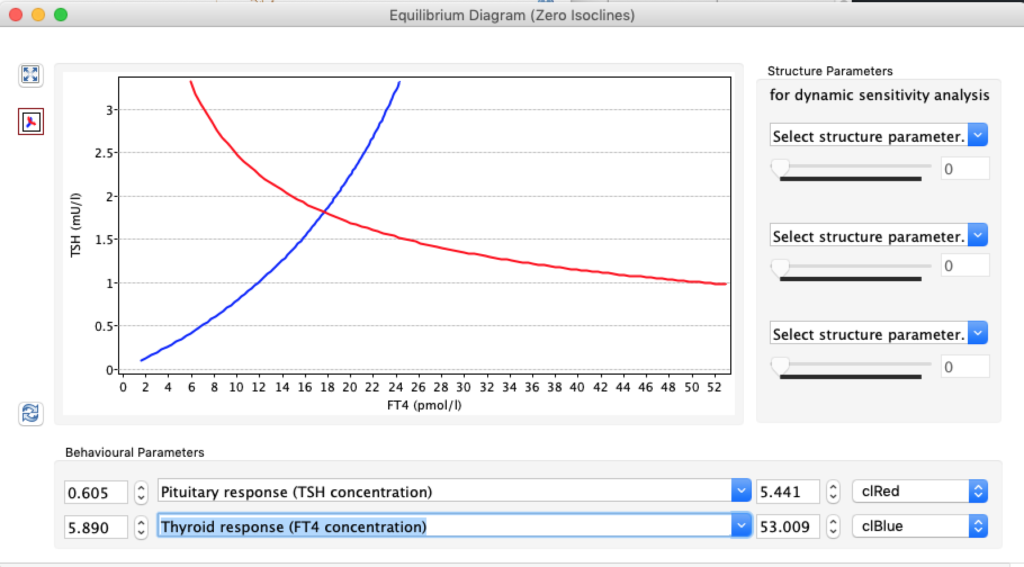
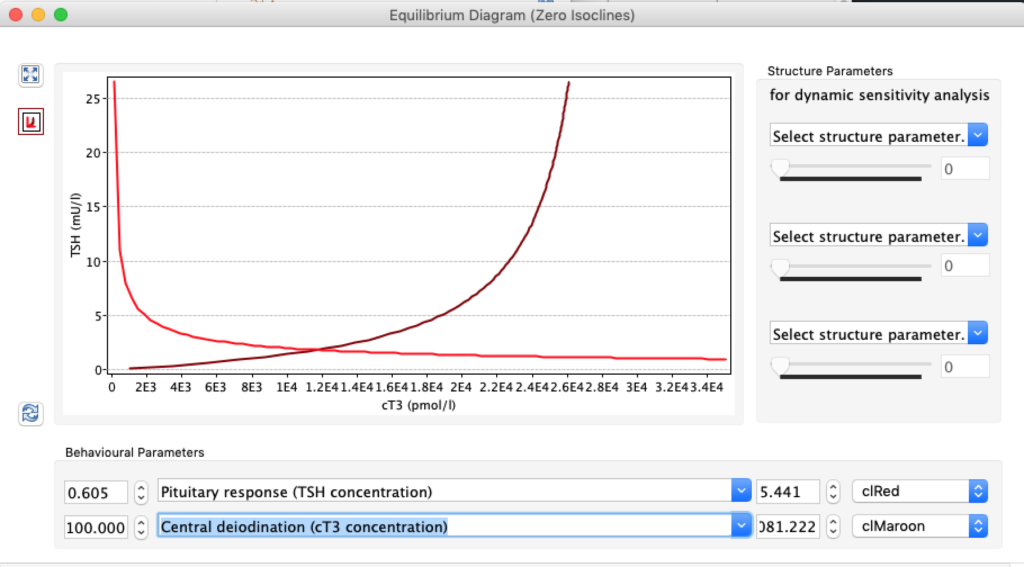
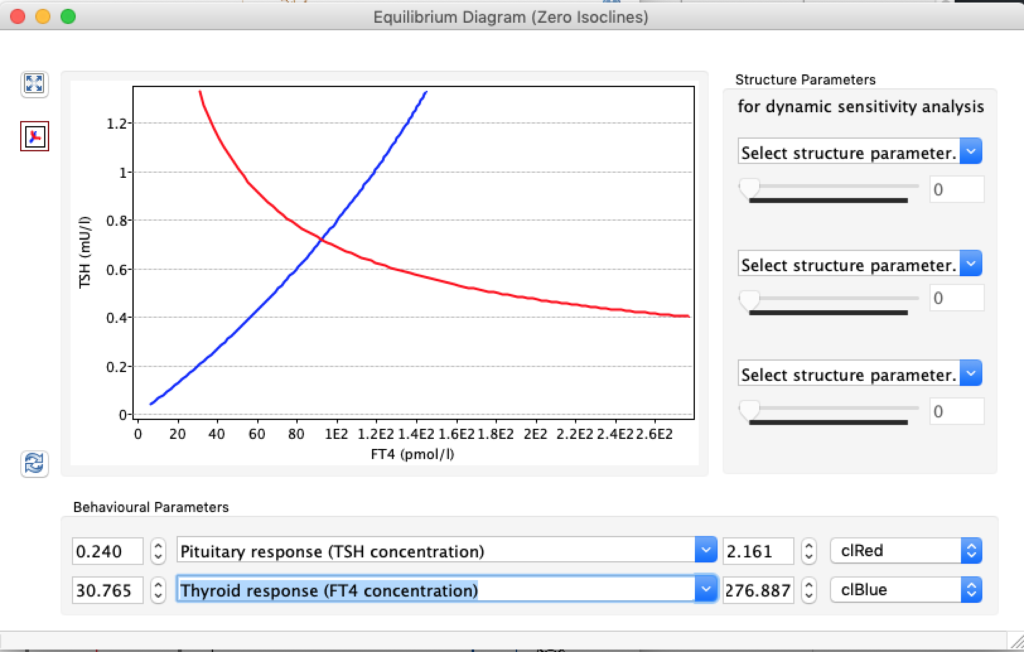
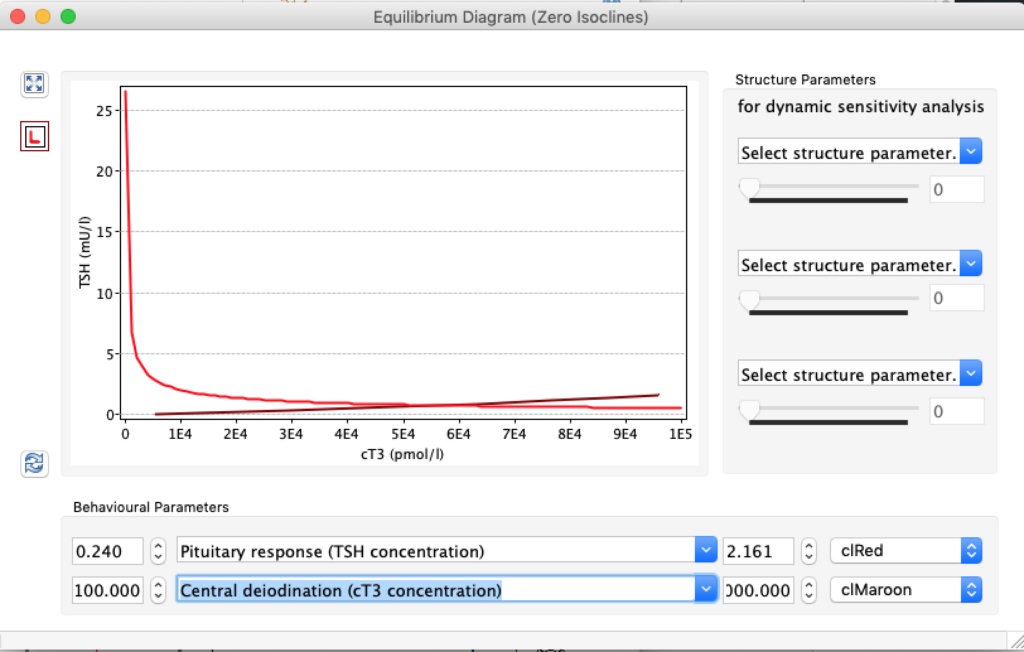
The Equilibrium Diagram offers an excellent overview of which parameters influences TSH and fT4 and cT3 (note that there is thousands of combinations as you can choose from three behavioural parameters and 16 structure parameters):
The application is based on the underlying assumption that pituitary TSH in equilibrium at all times provides an accurate mirror image of the peripheral hormones. However, recent evidence has challenged this simplistic tenet suggesting that the HPT axis is a much more dynamic system than has been previously thought (5, 22). In particular, the interrelationships between FT3, FT4, and TSH are less constantly fixed, rather conditional and contextualy adaptive (5, 22). (Berberich J, Dietrich JW, Hoermann R and Müller MA (2018) Mathematical Modeling of the Pituitary–Thyroid Feedback Loop: Role of a TSH-T3-Shunt and Sensitivity Analysis. Front. Endocrinol. 9:91. doi: 10.3389/fendo.2018.00091)
Our results suggest that the decreased serum T3 is a major cause of impaired TSH-thyroid hormone feedback control in hypothyroidism treated with LT4. D&M Solter https://doi.org/10.1016/j.ando.2017.11.003