Scenarios – observations 1

Pilo (1) and Kobuta (2) are different scenarios and here we have looked into TSH, FT3 and FT4 from the Simthyr model.

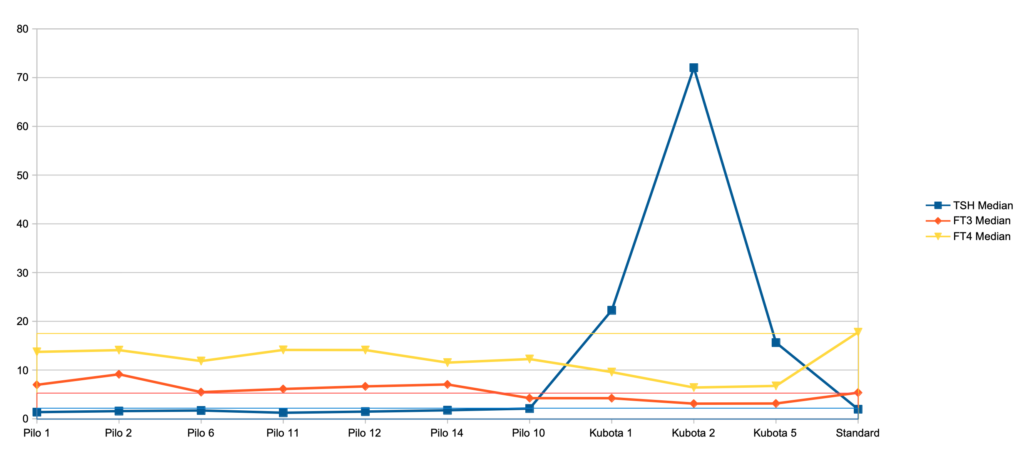
Below you find the description of the Pilo scenarios (The Kubota scenarios will follow later in the text) – The last entry is the figures for the standard scenario in SimThyr:

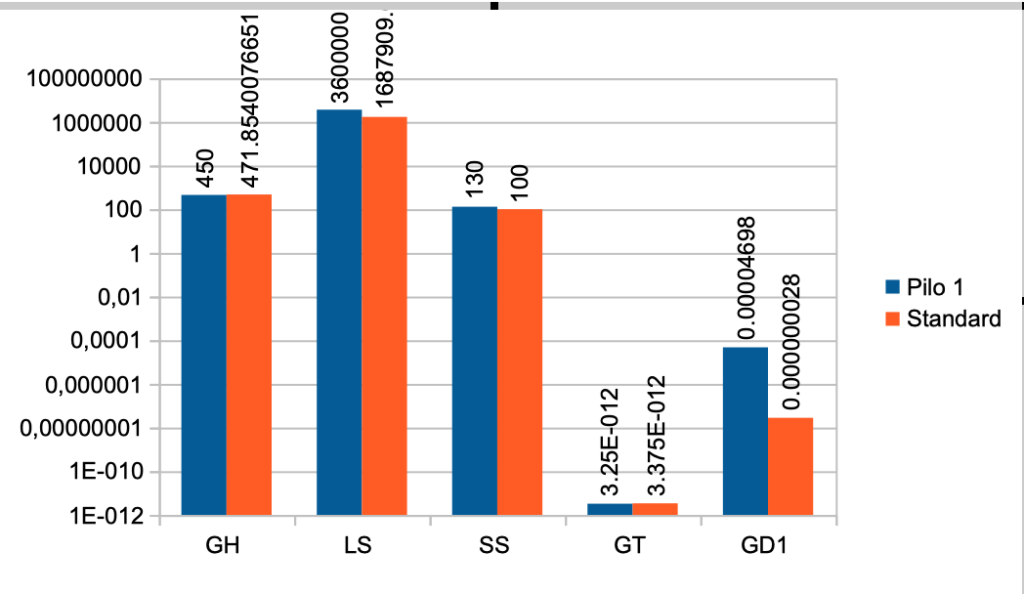
Case No. 1 from Pilo et al. showing slight hyperdeiodination and high conversion rate
The FT3 value is 6,97 a little higher than the standard value (5,36)
The FT4 value is lower than the standard value (17,76) – Pilo 1 (13,72)
The TSH value is 1,36 and the standard value is 1,96
Pilo 1 GH < (lower than) standard. See the effect of GH here
Pilo 1 LS > (higher than) standard. See the effect of LS here
Pilo 1 SS > standard. See the effect of SS here
Pilo 1 GT < standard. See the effect of GT here
Pilo 1 GD1 > standard. See the effect of GD1 here
(Diagram)
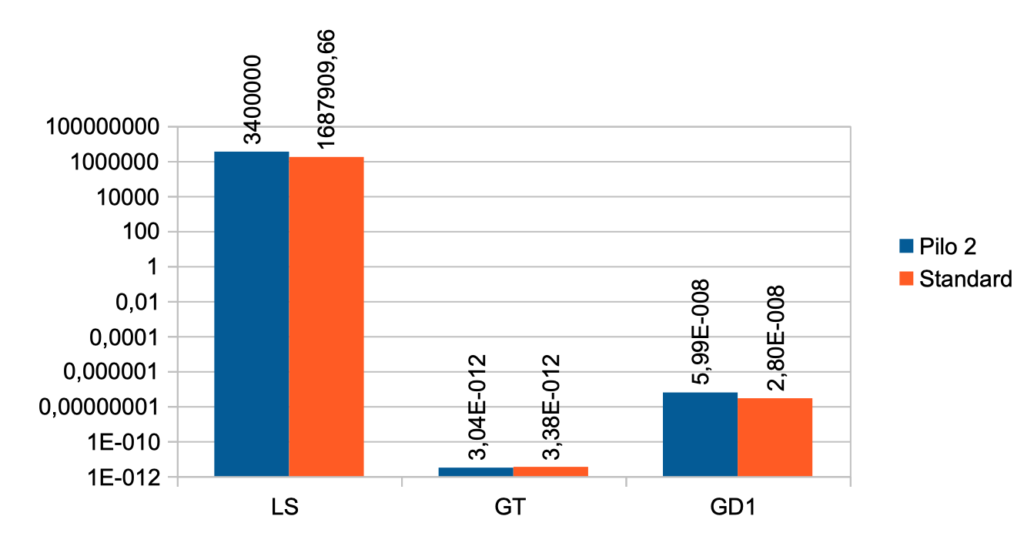
Case No. 2 from Pilo et al. showing slight hyperdeiodination
The FT3 value is 9,13 a little higher than the standard value (5,36)
The FT4 value is lower than the standard value (17,76) – Pilo 2 (14,08)
The TSH value is 1,57 and the standard value is 1,96
Pilo 2 LS > standard. See the effect of LS here
Pilo 2 GT < standard. See the effect of GT here
Pilo 2 GD1 > standard. See the effect of GD1 here
(Diagram)
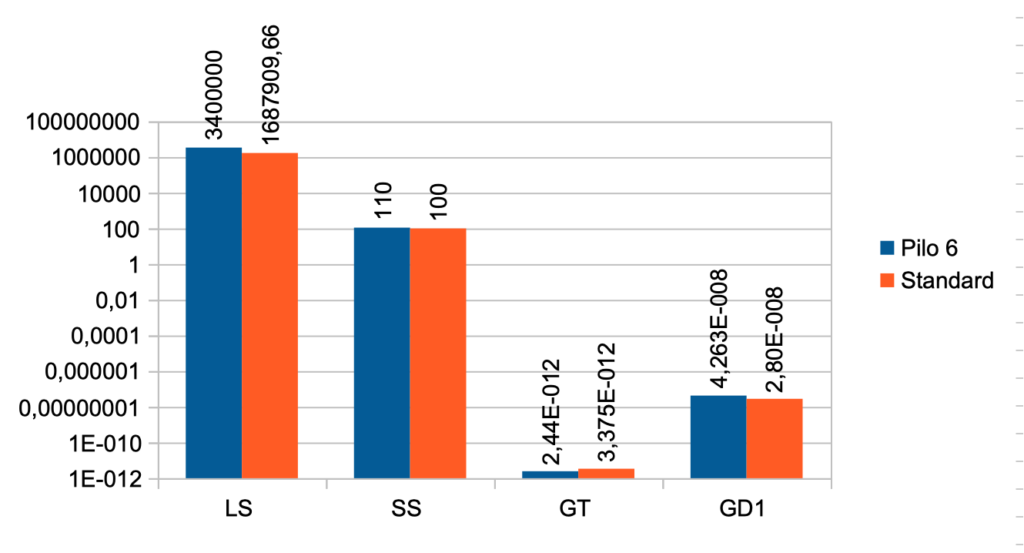
Case No. 6 from Pilo et al. with low secretion rate for T4
The FT3 value is 5,46 a little higher than the standard value (5,36)
The FT4 value is lower than the standard value (17,76) – Pilo 6 (11,84)
The TSH value is 1,70 and the standard value is 1,96
Pilo 6 LS > (higher than) standard. See the effect of LS here
Pilo 6 SS > standard. See the effect of SS here
Pilo 6 GT < standard. See the effect of GT here
Pilo 6 GD1 > standard. See the effect of GD1 here
(Diagram)
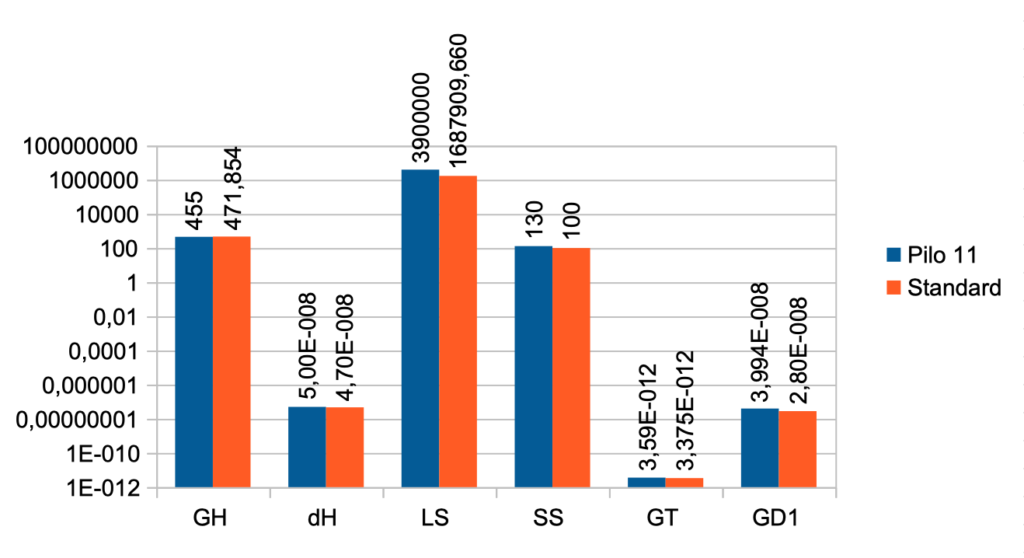
Case No. 11 from Pilo et al. with high secretion rate for T4
The FT3 value is 6,11 a little higher than the standard value (5,36)
The FT4 value is lower than the standard value (17,76) – Pilo 11 (11,84)
The TSH value is 1,23 and the standard value is 1,96
Pilo 11 GH < standard. See the effect of GH here
Pilo 11 dH < standard. See the effect of GH here
Pilo 11 LS > standard. See the effect of LS here
Pilo 11 SS > standard. See the effect of SS here
Pilo 11 GT < standard. See the effect of GT here
Pilo 11 GD1 > standard. See the effect of GD1 here
(Diagram)
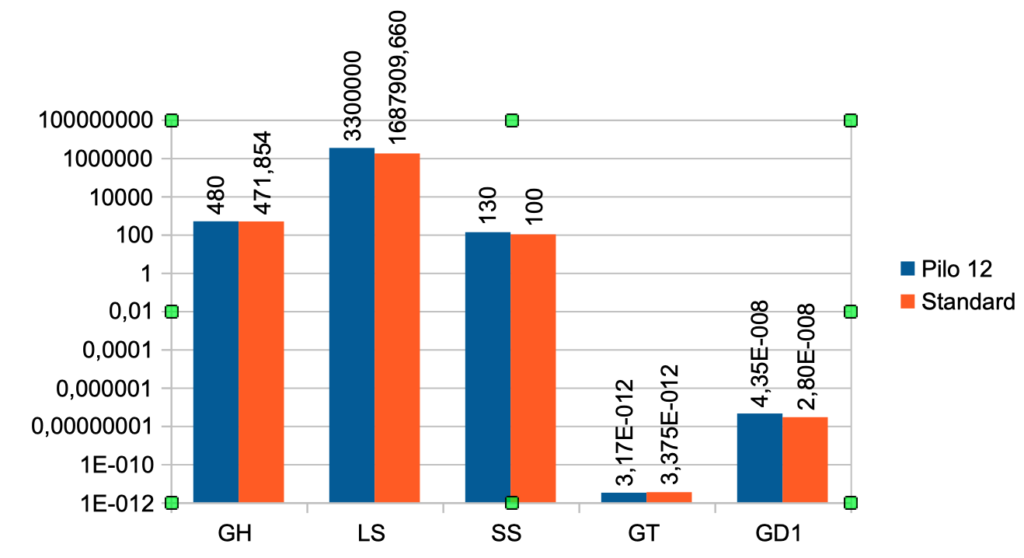
Case No. 12 from Pilo et al. with high production rate for T3
The FT3 value is 6,64 a little higher than the standard value (5,36)
The FT4 value is lower than the standard value (17,76) – Pilo 12 (14,1)
The TSH value is 1,47 and the standard value is 1,96
Pilo 12 GH < standard. See the effect of GH here
Pilo 12 LS > standard. See the effect of LS here
Pilo 12 SS > standard. See the effect of SS here
Pilo 12 GT < standard. See the effect of GT here
Pilo 12 GD1 > standard. See the effect of GD1 here
(Diagram)
Case No. 14 from Pilo et al. with low production rate for T3 Coming soon
Case No. 10 from Pilo et al. with normal values for SPINA-GT and SPINA-GD
Case No. 1 from Kubota et al. showing latent (subclinical) hypothyroidism
Case No. 2 from Kubota et al. showing overt hypothyroidism
Case No. 5 from Kubota et al. showing overt hypothyroidism

Look hypophyseal secretory capacity (GH) up – LINK

  1. Pilo A, Iervasi G, Vitek F, Ferdeghini M, Cazzuola F, Bianchi R. Thyroidal and peripheral production of 3,5,3′-triiodothyronine in humans by multicompartmental analysis. Am J Physiol. 1990 Apr;258(4 Pt 1):E715-26. PubMed PMID: 2333963.
  2. Kubota S, Fujiwara M, Hagiwara H, Tsujimoto N, Takata K, Kudo T, Nishihara E, Ito M, Amino N, Miyauchi A. Multiple thyroid cysts may be a cause of hypothyroidism in patients with relatively high iodine intake. Thyroid. 2010 Feb;20(2):205-8. doi: 10.1089/t

Pilo 1 and 10

Observations from the Pilo scenarios
The figures are derived from Simthyr – based on the laboratory values for the persons in the Pilo study(1). The figures mimic what may be seen in humans with this condition.

Pilo 1 (showing slight hyperdeiodination and high conversion rate)Pilo 10 (with normal values for SPINA-GT and SPINA-GD)
These are the figures entered into SimThyr, as can be seen, these values are changed:
GH, LS, SS, GT, GD1
These are the figures entered into SimThyr, as can be seen, these values are changed:
LS, GT, GD1
alphaR = 0.4

betaR = 0.0023105

GR = 1

dR = 1E-10

alphaS = 0.4

betaS = 0.00023

alphaS2 = 260000

betaS2 = 140

GH = 450

dH = 4.7E-8

LS = 3600000

SS = 130

DS = 50

alphaT = 0.1

betaT = 1.1E-6

GT = 3.25E-12

dT = 2.75

alpha31 = 0.026

beta31 = 8E-6

GD1 = 4.698E-8

KM1 = 5E-7

alpha32 = 130000

beta32 = 0.00083

GD2 = 4.3E-15

KM2 = 1E-9

K30 = 2000000000

K31 = 2000000000

K41 = 20000000000

K42 = 200000000

Tau0R = 1800

Tau0S = 120

Tau0S2 = 3240

Tau0T = 300

Tau03z = 3600
alphaR = 0.4

betaR = 0.0023105


GR = 1


dR = 1E-10


alphaS = 0.4


betaS = 0.00023


alphaS2 = 260000


betaS2 = 140


GH = 471.85

dH = 4.7E-8

LS = 2500000 (std:1.6879E6)

SS = 100

DS = 50

alphaT = 0.1

betaT = 1.1E-6

GT = 2.22E-12 (std:3.375-12)

dT = 2.75

alpha31 = 0.026

beta31 = 8E-6

GD1 = 3.188E-8 (std: 2.8E-8)

KM1 = 5E-7

alpha32 = 130000

beta32 = 0.00083

GD2 = 4.3E-15

KM2 = 1E-9

K30 = 2000000000

K31 = 2000000000

K41 = 20000000000

K42 = 200000000

Tau0R = 1800

Tau0S = 120

Tau0S2 = 3240

Tau0T = 300

Tau03z = 3600
HeaderPilo 1
xFT3_pmol.l
yTSHI
result_typepredictive power score
pps0.0399161481951055
metricMAE
baseline_score0.228599683756024
model_score0.219471509560077
cv_folds5
seed1
algorithmtree
model_typeregression
HeaderPilo 10
xFT3_pmol.l
yTSHI
result_typepredictive power score
pps0.074013572098316
metricMAE
baseline_score0.229021692772779
model_score0.212073708605622
cv_folds5
seed1
algorithmtree
model_typeregression
TRH_ng.lFT3_pmol.l
pps0.00999382
TRH_ng.lTSH_mU.l
pps0.241326
SPINA_GTTSH_mU.l
pps0.820709
SPINA_GTTT4_nmol.l
pps3.4861e-15
TT3_nmol.lTT4_nmol.l
pps0.734311
TT3_nmol.lFT4_pmol.l
pps0.7343158
SPINA_GDFT4_pmol.l
pps0.2388143
SPINA_GDFT3_pmol.l
pps0.1478555
TSHIFT3_pmol.l
pps0.03991615

More information on the Pilo 1 scenario

FT3_pmol.lTRH_ng.l
pps0.02436586
TRH_ng.lTSH_mU.l
pps0.2460819
SPINA_GTTSH_mU.l
pps0.8224402
SPINA_GTTT4_nmol.l
pps7.704948e-15
TT3_nmol.lTT4_nmol.l
pps0.7880723
TT3_nmol.lFT4_pmol.l
pps0.7880051
SPINA_GDFT4_pmol.l
pps0.3212973
SPINA_GDFT3_pmol.l
pps0.1749449
TSHIFT3_pmol.l
pps0.07401357

More information on the Pilo 10 scenario

  1. 1. Pilo A, Iervasi G, Vitek F, Ferdeghini M, Cazzuola F, Bianchi R. Thyroidal and peripheral production of 3,5,3′-triiodothyronine in humans by multicompartmental analysis. Am J Physiol. 1990 Apr;258(4 Pt 1):E715-26. PubMed PMID: 2333963.

Pilo 10 – DataExplorer

Data Profiling Report

Basic Statistics

Raw Counts

Name Value
Rows 47,520
Columns 12
Discrete columns 0
Continuous columns 12
All missing columns 0
Missing observations 0
Complete Rows 47,520
Total observations 570,240
Memory allocation 4.4 Mb

Percentages

Data Structure

Missing Data Profile

Univariate Distribution

Histogram

QQ Plot

Correlation Analysis

Principal Component Analysis

Pilo 1 – DataExplorer

Data Profiling Report

Basic Statistics

Raw Counts

Name Value
Rows 47,520
Columns 12
Discrete columns 1
Continuous columns 11
All missing columns 0
Missing observations 0
Complete Rows 47,520
Total observations 570,240
Memory allocation 4.4 Mb

Percentages

Data Structure

Missing Data Profile

Univariate Distribution

Histogram

Bar Chart (with frequency)

QQ Plot

Correlation Analysis

## Warning in dummify(data, maxcat = maxcat): Ignored all discrete features since `maxcat`
## set to 20 categories!

Principal Component Analysis

Pilo 2 and 6 further information

Observations from the Pilo scenarios
The figures are derived from Simthyr – based on the laboratory values for the persons in the Pilo study(1). The figures mimic what may be seen in humans with this condition.

Pilo 6 (with low secretion rate for T4)
Pilo 2 (showing slight hyperdeiodination)
These are the figures entered into SimThyr, as can be seen two values are changed:
GT – thyroid activity and GD – deiodinase activity
These are the figures entered into SimThyr, as can be seen two values are changed:
GT – thyroid activity and GD – deiodinase activity
alphaR
0.4
betaR
0.0023105
GR
1
dR
1E-10
alphaS
0.4
betaS
0.00023
alphaS2
260000
betaS2
140
GH
471.85
dH
4.7E-8
LS
3400000
SS
110
DS
50
alphaT
0.1
betaT
1.1E-6
GT
2.44E-12 (standard value 3.375E-12)

dT
2.75
alpha31
0.026
beta31
8E-6
GD1
4.263E-8 (standard value 2.8E-8)

KM1
5E-7
alpha32
130000
beta32
0.00083
GD2
4.3E-15
KM2
1E-9
K30
2000000000
K31
2000000000
K41
20000000000
K42
200000000
Tau0R
1800
Tau0S
120
Tau0S2
3240
Tau0T
300
Tau03z
3600
alphaR
0.4
betaR
0.0023105
GR
1
dR
1E-10
alphaS
0.4
betaS
0.00023
alphaS2
260000
betaS2
140
GH
471.85
dH
4.7E-8
LS
3400000
SS
100
DS
50
alphaT
0.1
betaT
1.1E-6
GT
3.04E-12
dT
2.75
alpha31
0.026
beta31
8E-6
GD1
5.99E-8

KM1
5E-7
alpha32
130000
beta32
0.00083
GD2
4.3E-15
KM2
1E-9
K30
2000000000
K31
2000000000
K41
20000000000
K42
200000000
Tau0R
1800
Tau0S
120
Tau0S2
3240
Tau0T
300
Tau03z
3600
HeaderPilo 6
xFT3_pmol.l
ycT3_pmol.l
result_typepredictive power score
pps0.70645161743448
metricMAE
baseline_score57.7740090792993
model_score16.9589086283796
cv_folds5
seed1
algorithmtree
model_typeregression
TRH_ng.lFT3_pmol.l
pps0.0201538424398612
TRH_ng.lTSH_mU.l
pps0.24198856824132
SPINA_GTTSH_mU.l
pps0.853016404129762
SPINA_GTTT4_nmol.l
pps0
TT3_nmol.lTT4_nmol.l
pps0.786492953457281
TT3_nmol.lFT4_pmol.l
pps0.7864154128002
SPINA_GDFT4_pmol.l
pps0.361281910084329
SPINA_GDFT3_pmol.l
pps0.150538809123081
TSHIFT3_pmol.l
pps0.0817507329667389

More information on the Pilo 6 scenario

HeaderPilo 2
xcT3_pmol.l
yFT3_pmol.l
result_typepredictive power score
pps0.721086815385527
metricMAE
baseline_score0.0649955790187846
model_score0.0181290998271268
cv_folds5
seed1
algorithmtree
model_typeregression
FT3_pmol.lTRH_ng.l
pps0.0158420628677205
TRH_ng.lTSH_mU.l
pps0.245993069890075
SPINA_GTTSH_mU.l
pps0.818806003676958
SPINA_GTTT4_nmol.l
pps9.1038e-16
TT3_nmol.lTT4_nmol.l
pps0.698920862701658
TT3_nmol.lFT4_pmol.l
pps0.698799304223429
SPINA_GDFT4_pmol.l
pps0.285240272027388
SPINA_GDFT3_pmol.l
pps0.124850236180727
TSHIFT3_pmol.l
pps0.0930791220487382

More information on the Pilo 2 scenario

  1. 1. Pilo A, Iervasi G, Vitek F, Ferdeghini M, Cazzuola F, Bianchi R. Thyroidal and peripheral production of 3,5,3′-triiodothyronine in humans by multicompartmental analysis. Am J Physiol. 1990 Apr;258(4 Pt 1):E715-26. PubMed PMID: 2333963.

Pilo 6 – DataExplorer

Data Profiling Report

Basic Statistics

Raw Counts

Name Value
Rows 47,520
Columns 11
Discrete columns 0
Continuous columns 11
All missing columns 0
Missing observations 0
Complete Rows 47,520
Total observations 522,720
Memory allocation 4 Mb

Percentages

Data Structure

Missing Data Profile

Univariate Distribution

Histogram

QQ Plot

Correlation Analysis

Principal Component Analysis

Q-Q plot – explanation: https://stats.stackexchange.com/questions/101274/how-to-interpret-a-qq-plot

Pilo 2 – DataExplorer

Data Profiling Report

Basic Statistics

Raw Counts

Name Value
Rows 47,520
Columns 11
Discrete columns 0
Continuous columns 11
All missing columns 0
Missing observations 0
Complete Rows 47,520
Total observations 522,720
Memory allocation 4 Mb

Percentages

Data Structure

Missing Data Profile

Univariate Distribution

Histogram

QQ Plot

Correlation Analysis

Principal Component Analysis

Q-Q plot – explanation: https://stats.stackexchange.com/questions/101274/how-to-interpret-a-qq-plot