Observations from the Pilo scenarios
The figures are derived from Simthyr – based on the laboratory values for the persons in the Pilo study(1). The figures mimic what may be seen in humans with this condition.
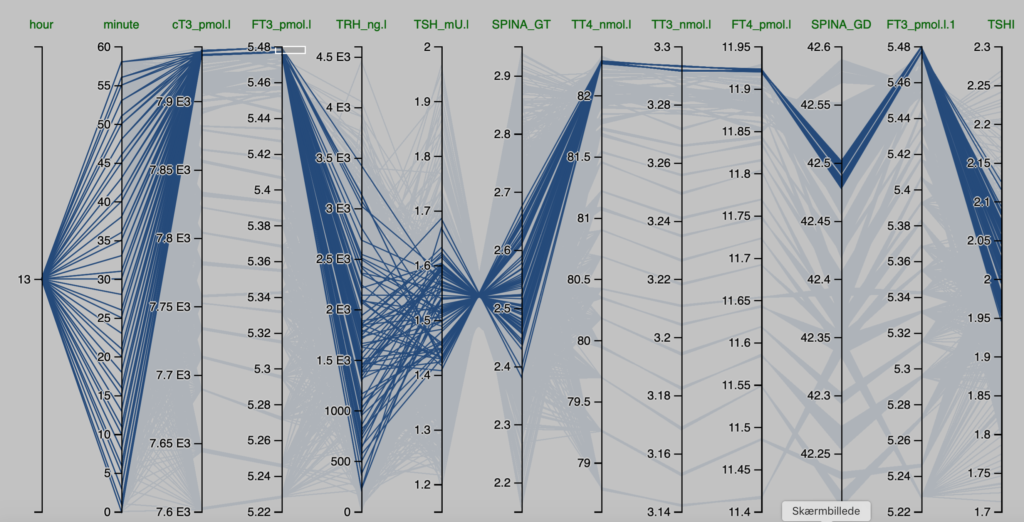
| Pilo 6 (with low secretion rate for T4) | Pilo 2 (showing slight hyperdeiodination) |
| These are the figures entered into SimThyr, as can be seen two values are changed: GT – thyroid activity and GD – deiodinase activity | These are the figures entered into SimThyr, as can be seen two values are changed: GT – thyroid activity and GD – deiodinase activity |
| alphaR 0.4 betaR 0.0023105 GR 1 dR 1E-10 alphaS 0.4 betaS 0.00023 alphaS2 260000 betaS2 140 GH 471.85 dH 4.7E-8 LS 3400000 SS 110 DS 50 alphaT 0.1 betaT 1.1E-6 GT 2.44E-12 (standard value 3.375E-12) dT 2.75 alpha31 0.026 beta31 8E-6 GD1 4.263E-8 (standard value 2.8E-8) KM1 5E-7 alpha32 130000 beta32 0.00083 GD2 4.3E-15 KM2 1E-9 K30 2000000000 K31 2000000000 K41 20000000000 K42 200000000 Tau0R 1800 Tau0S 120 Tau0S2 3240 Tau0T 300 Tau03z 3600 | alphaR 0.4 betaR 0.0023105 GR 1 dR 1E-10 alphaS 0.4 betaS 0.00023 alphaS2 260000 betaS2 140 GH 471.85 dH 4.7E-8 LS 3400000 SS 100 DS 50 alphaT 0.1 betaT 1.1E-6 GT 3.04E-12 dT 2.75 alpha31 0.026 beta31 8E-6 GD1 5.99E-8 KM1 5E-7 alpha32 130000 beta32 0.00083 GD2 4.3E-15 KM2 1E-9 K30 2000000000 K31 2000000000 K41 20000000000 K42 200000000 Tau0R 1800 Tau0S 120 Tau0S2 3240 Tau0T 300 Tau03z 3600 |
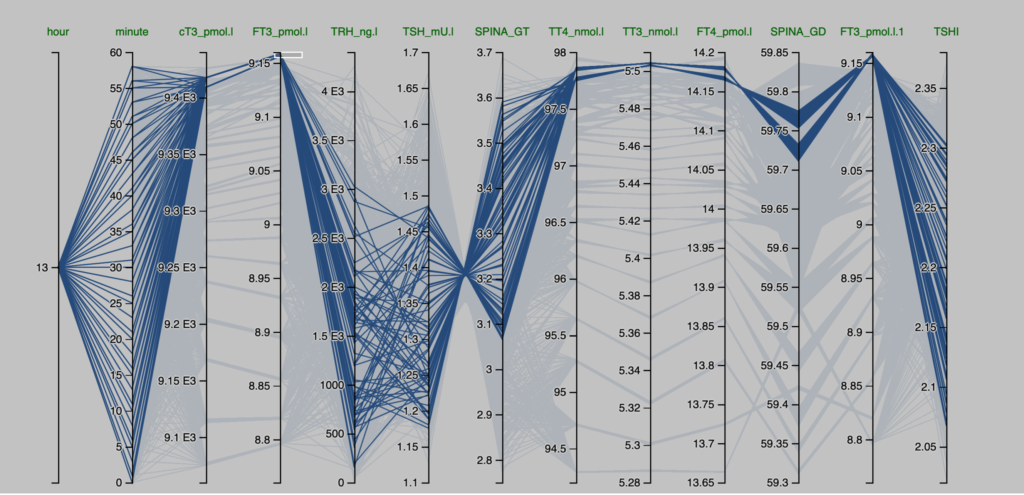
| Header | Pilo 6 | |
| x | FT3_pmol.l | |
| y | cT3_pmol.l | |
| result_type | predictive power score | |
| pps | 0.70645161743448 | |
| metric | MAE | |
| baseline_score | 57.7740090792993 | |
| model_score | 16.9589086283796 | |
| cv_folds | 5 | |
| seed | 1 | |
| algorithm | tree | |
| model_type | regression |
| TRH_ng.l | FT3_pmol.l |
| pps | 0.0201538424398612 |
| TRH_ng.l | TSH_mU.l | |
| pps | 0.24198856824132 |
| SPINA_GT | TSH_mU.l | |
| pps | 0.853016404129762 |
| SPINA_GT | TT4_nmol.l | |
| pps | 0 |
| TT3_nmol.l | TT4_nmol.l | |
| pps | 0.786492953457281 |
| TT3_nmol.l | FT4_pmol.l | |
| pps | 0.7864154128002 |
| SPINA_GD | FT4_pmol.l | |
| pps | 0.361281910084329 |
| SPINA_GD | FT3_pmol.l | |
| pps | 0.150538809123081 |
| TSHI | FT3_pmol.l | |
| pps | 0.0817507329667389 |
| Header | Pilo 2 | |
| x | cT3_pmol.l | |
| y | FT3_pmol.l | |
| result_type | predictive power score | |
| pps | 0.721086815385527 | |
| metric | MAE | |
| baseline_score | 0.0649955790187846 | |
| model_score | 0.0181290998271268 | |
| cv_folds | 5 | |
| seed | 1 | |
| algorithm | tree | |
| model_type | regression |
| FT3_pmol.l | TRH_ng.l | |
| pps | 0.0158420628677205 |
| TRH_ng.l | TSH_mU.l | |
| pps | 0.245993069890075 |
| SPINA_GT | TSH_mU.l | |
| pps | 0.818806003676958 |
| SPINA_GT | TT4_nmol.l | |
| pps | 9.1038e-16 |
| TT3_nmol.l | TT4_nmol.l | |
| pps | 0.698920862701658 |
| TT3_nmol.l | FT4_pmol.l | |
| pps | 0.698799304223429 |
| SPINA_GD | FT4_pmol.l | |
| pps | 0.285240272027388 |
| SPINA_GD | FT3_pmol.l | |
| pps | 0.124850236180727 |
| TSHI | FT3_pmol.l | |
| pps | 0.0930791220487382 |
- 1. Pilo A, Iervasi G, Vitek F, Ferdeghini M, Cazzuola F, Bianchi R. Thyroidal and peripheral production of 3,5,3′-triiodothyronine in humans by multicompartmental analysis. Am J Physiol. 1990 Apr;258(4 Pt 1):E715-26. PubMed PMID: 2333963.