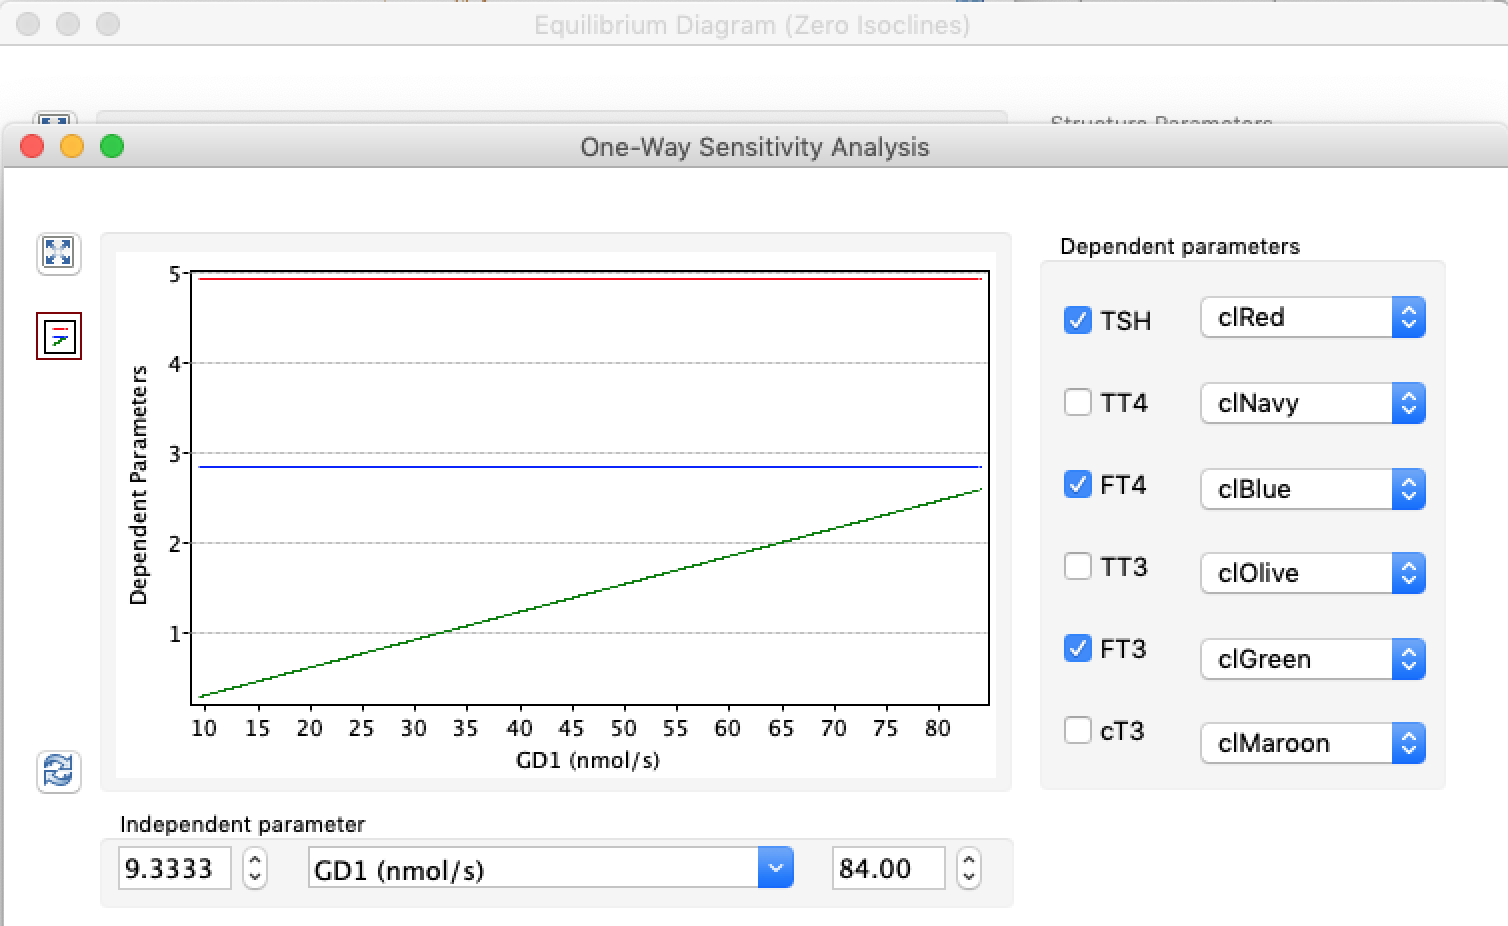
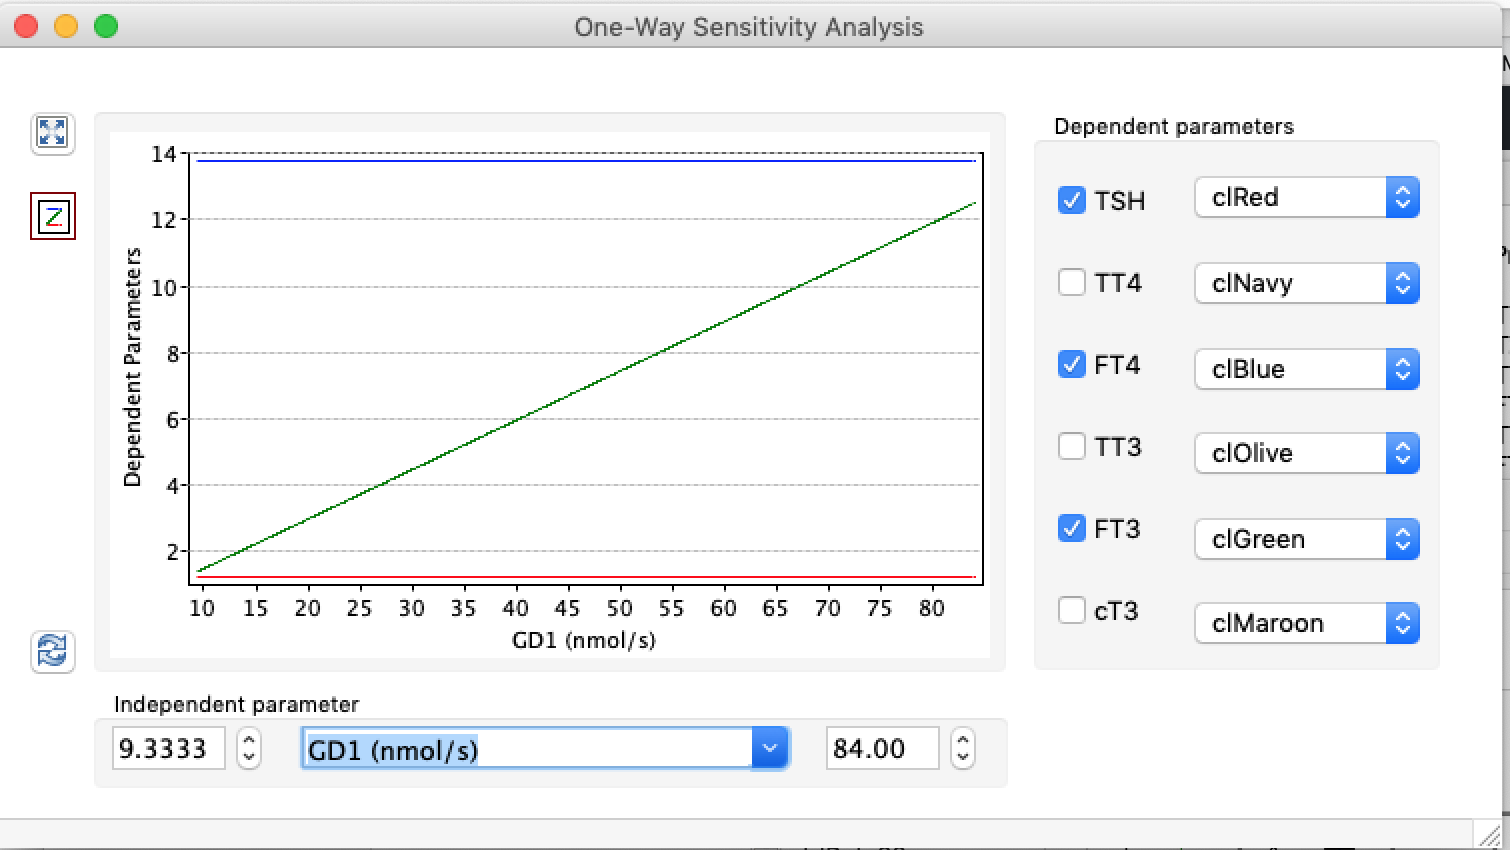
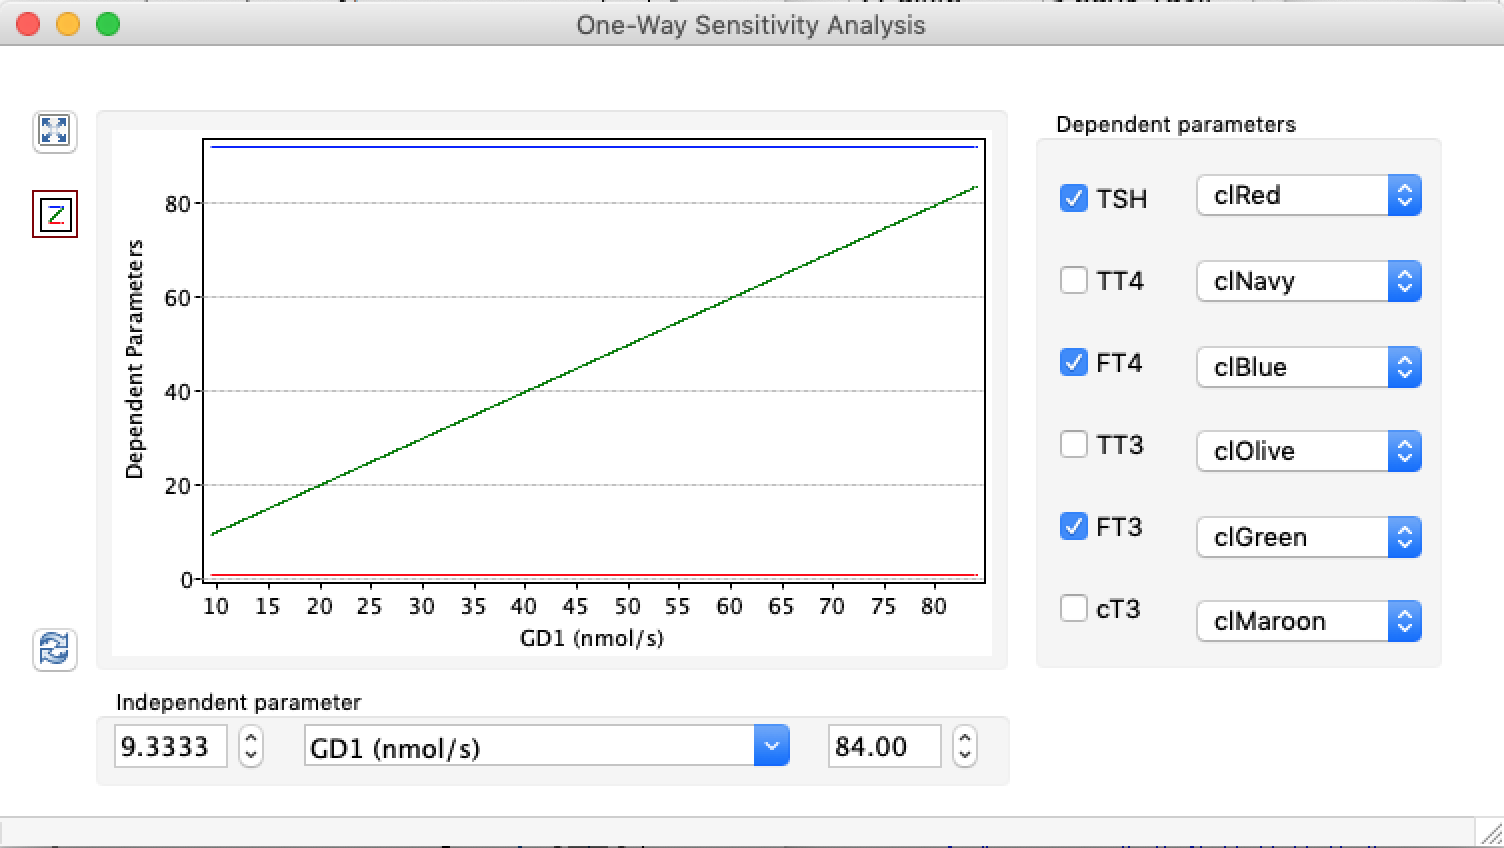
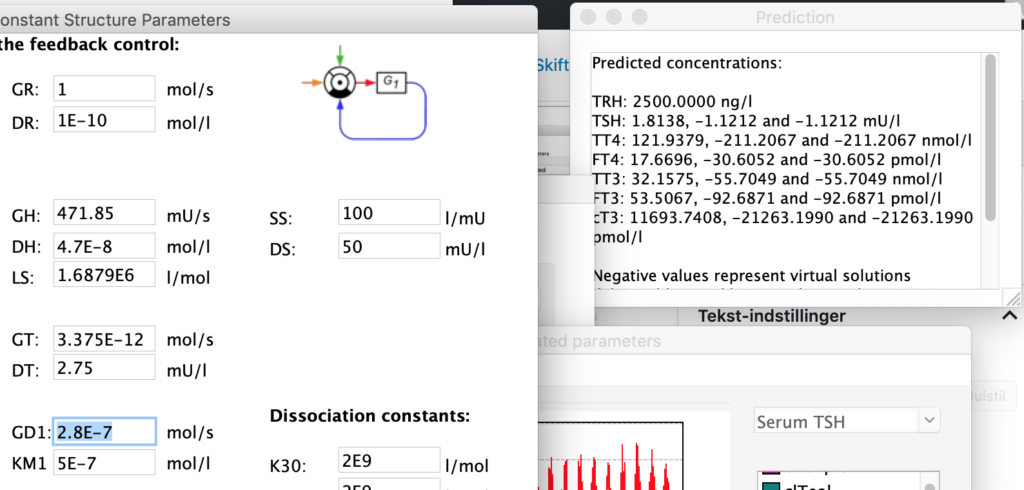
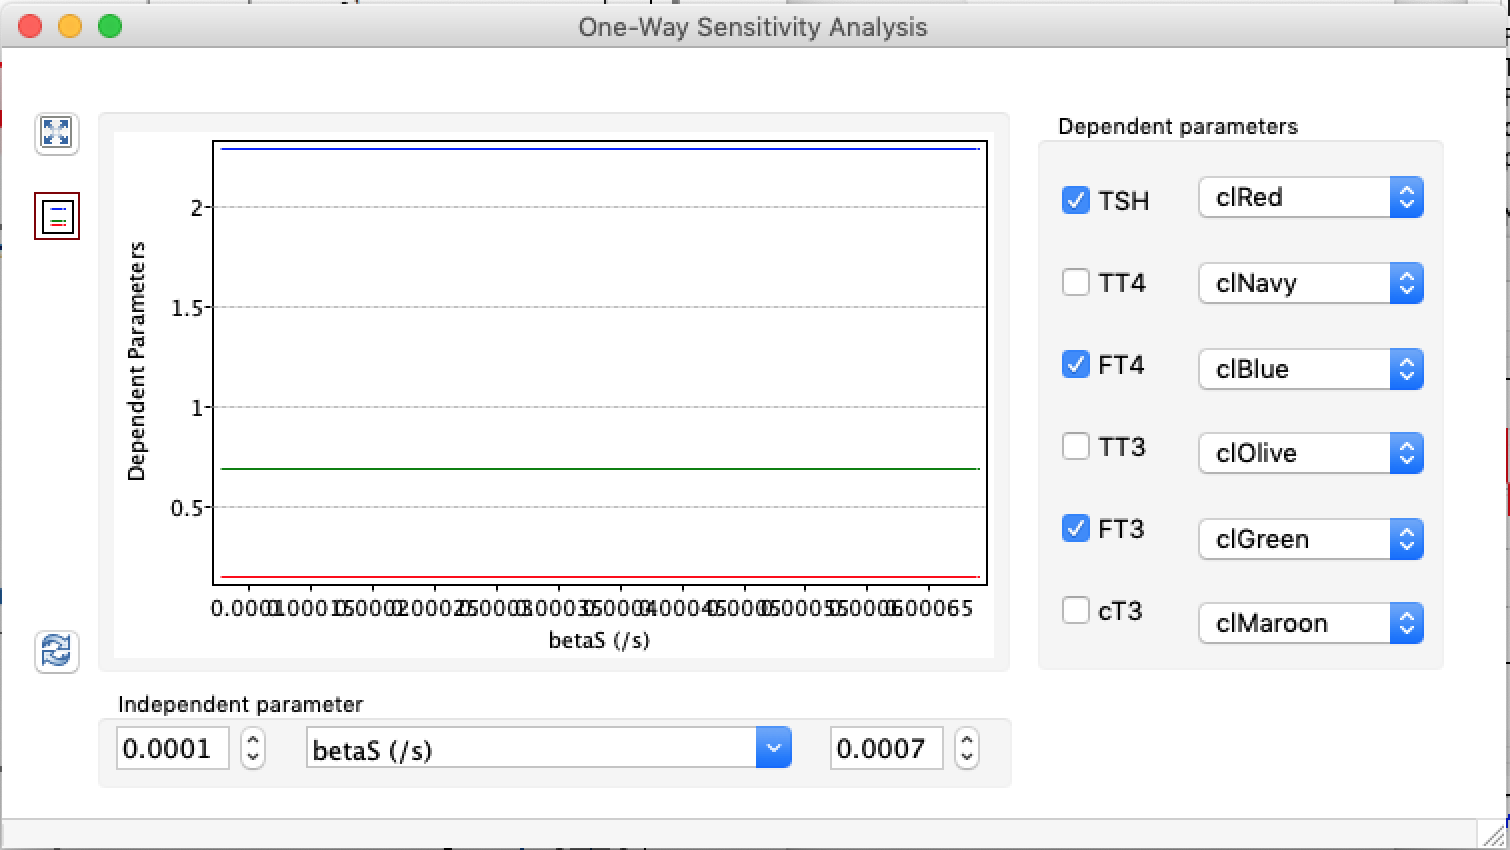
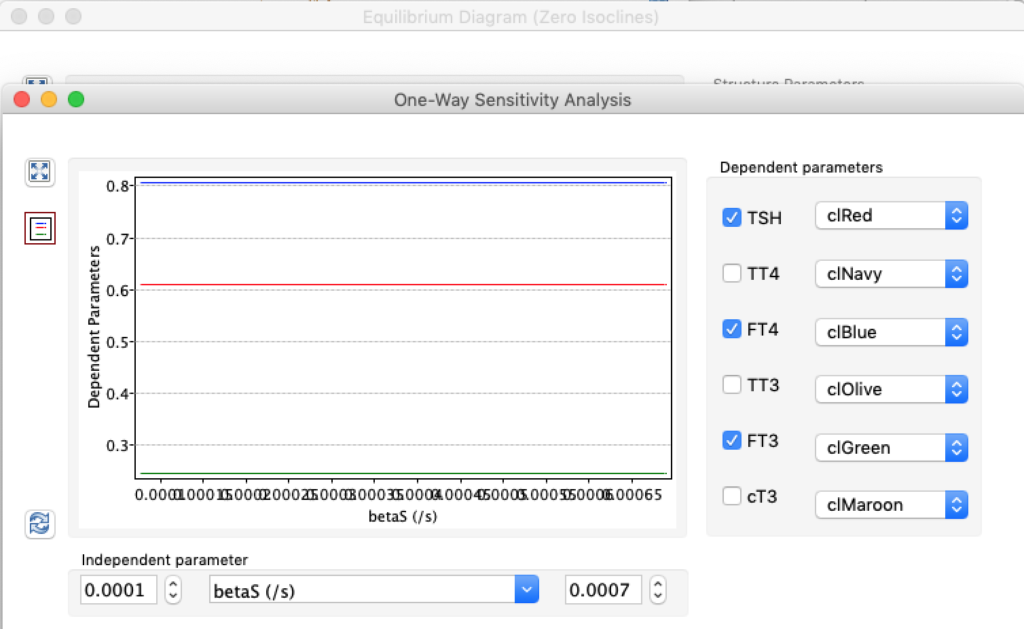
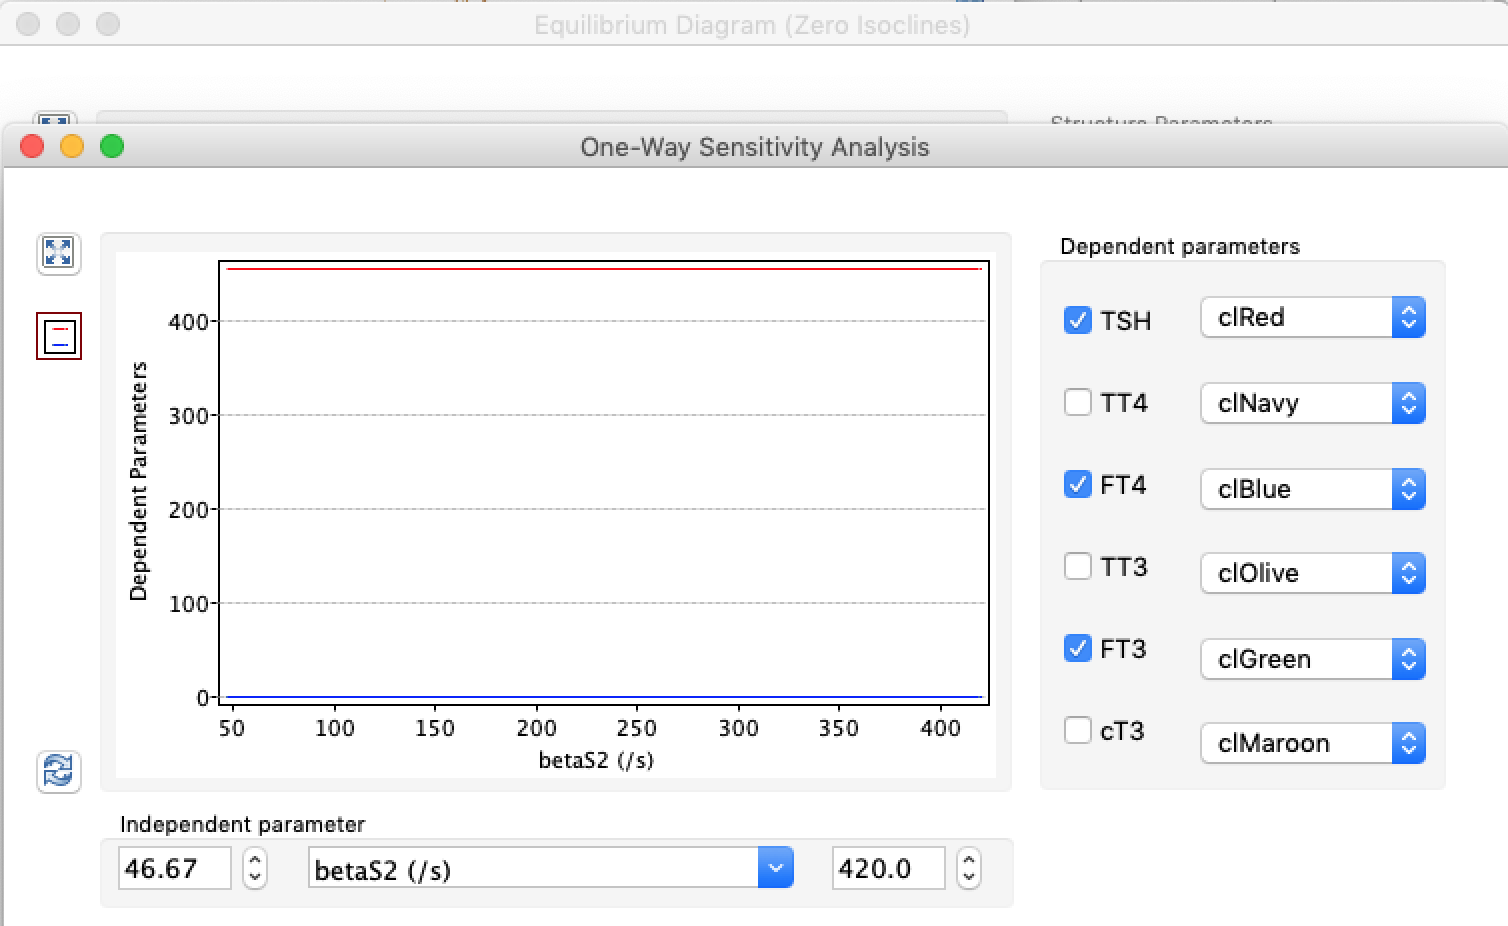
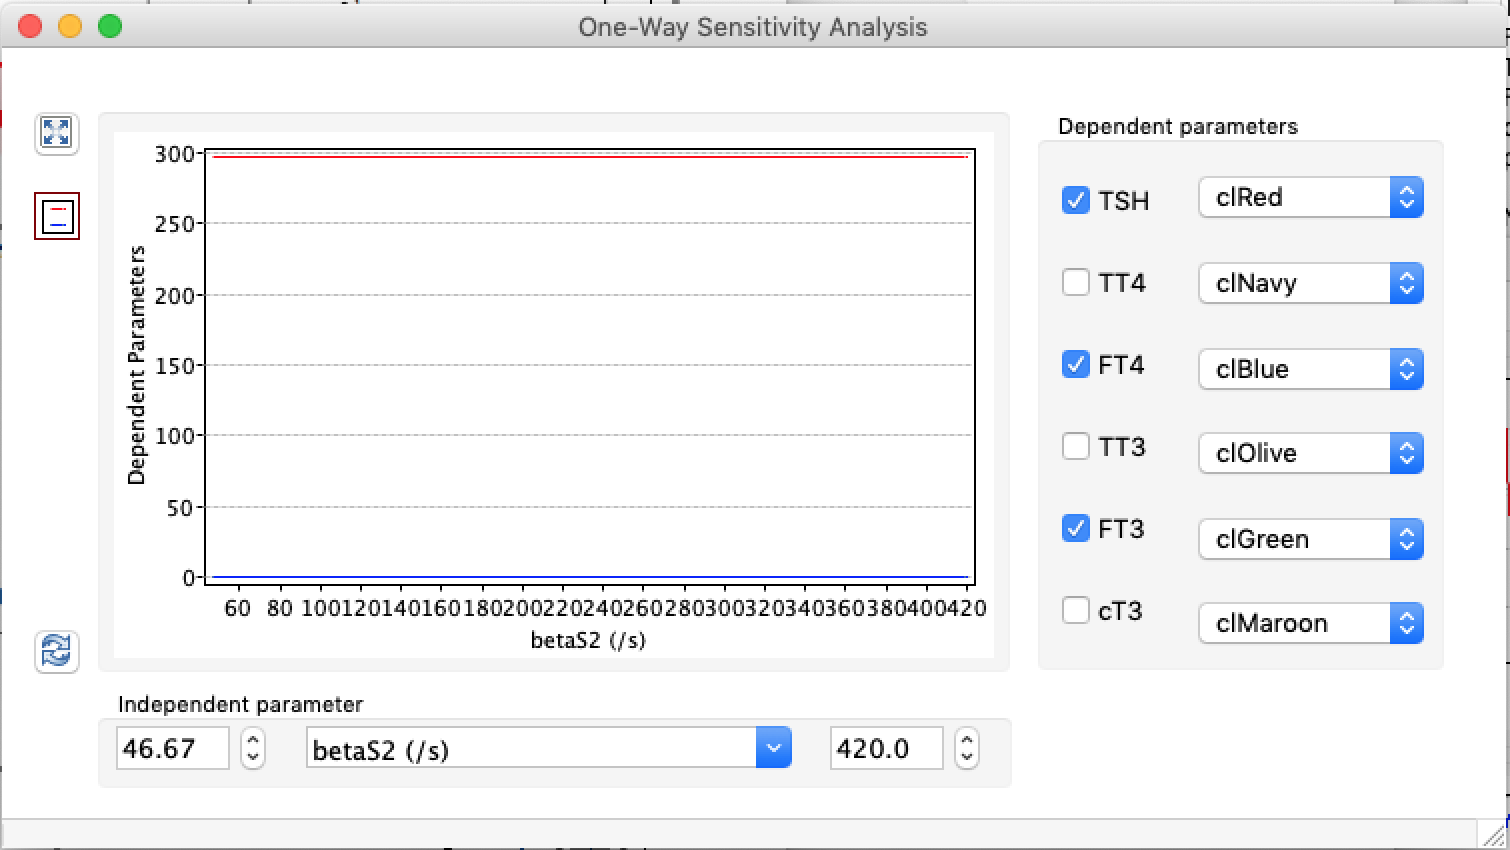
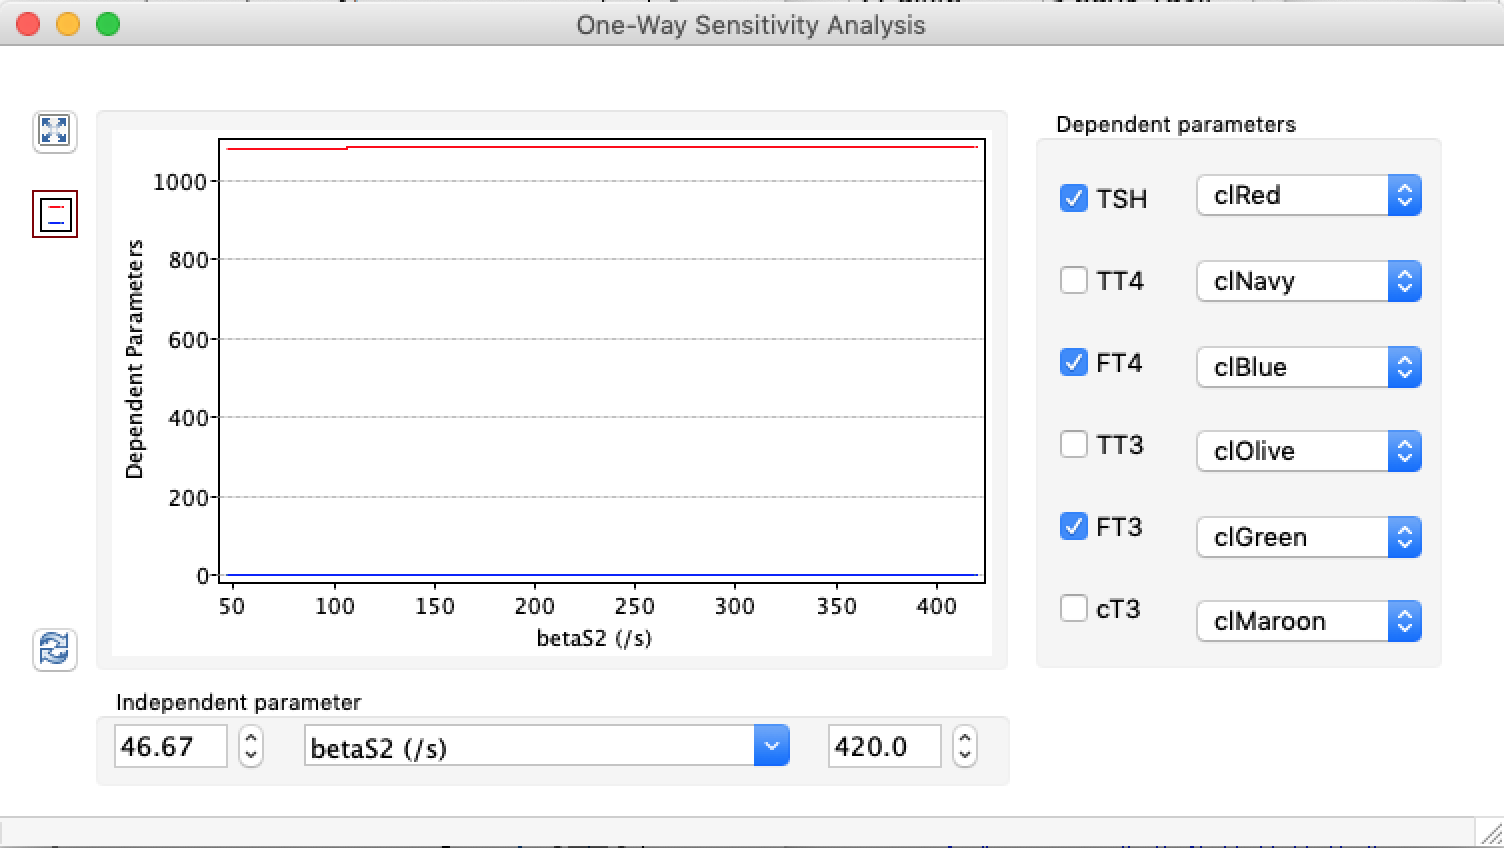
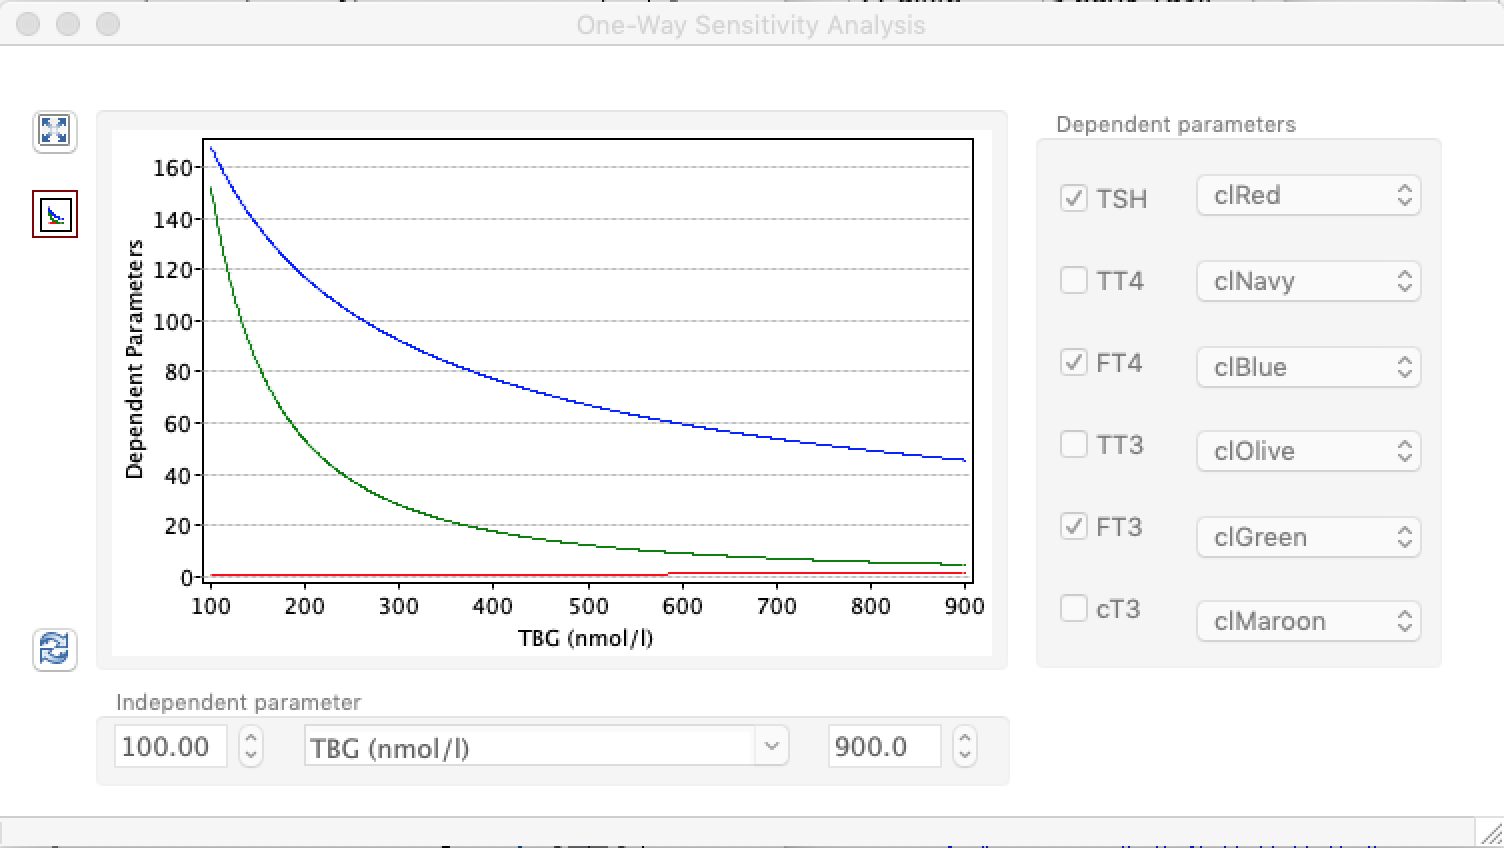
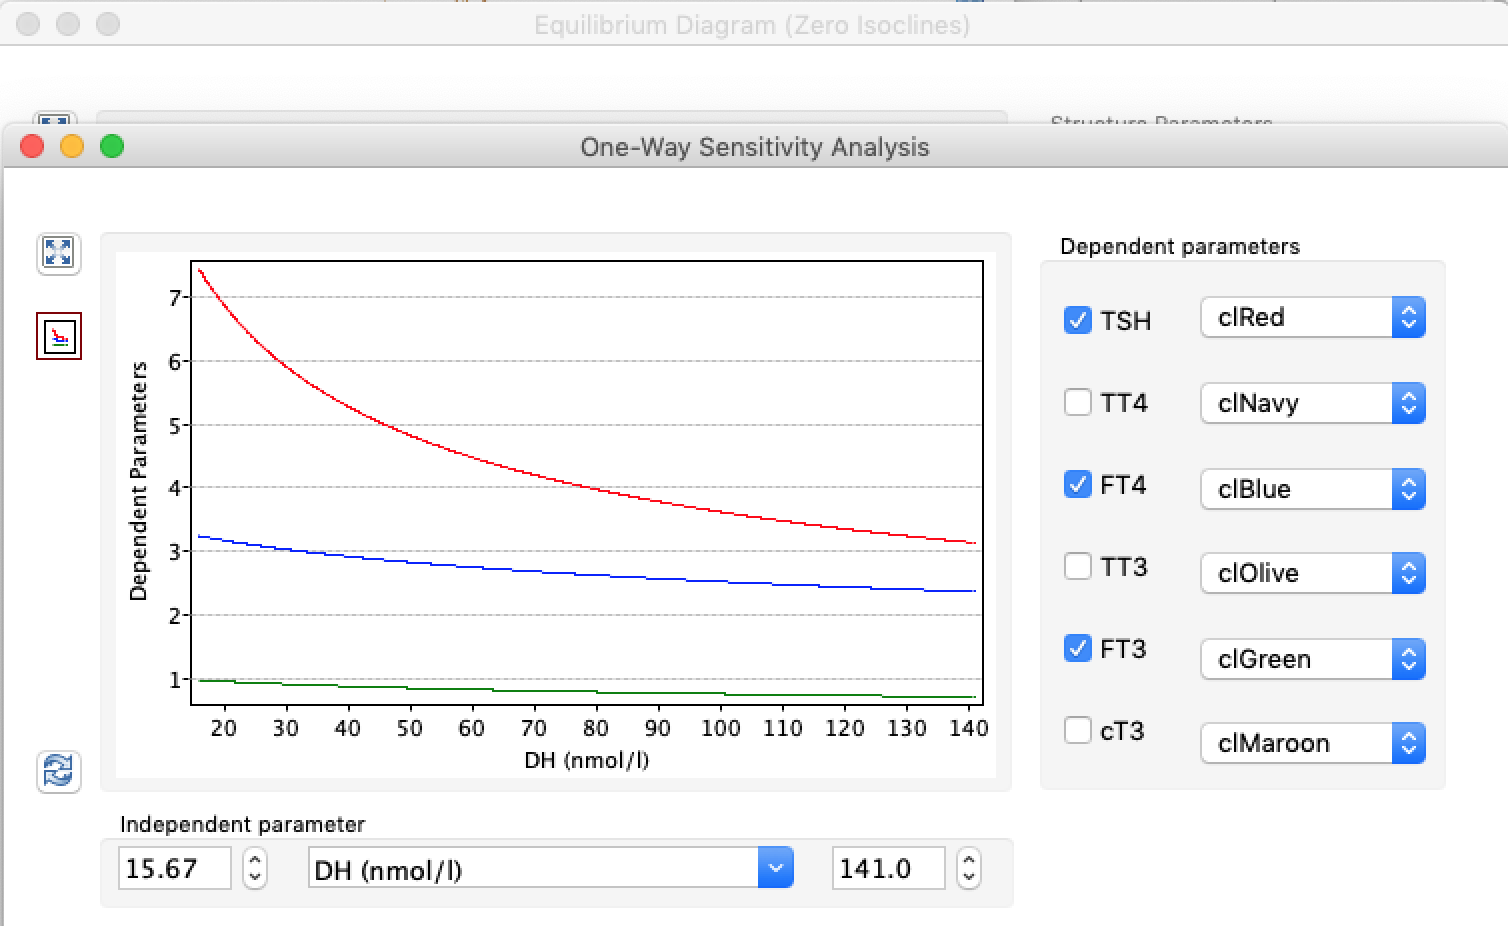
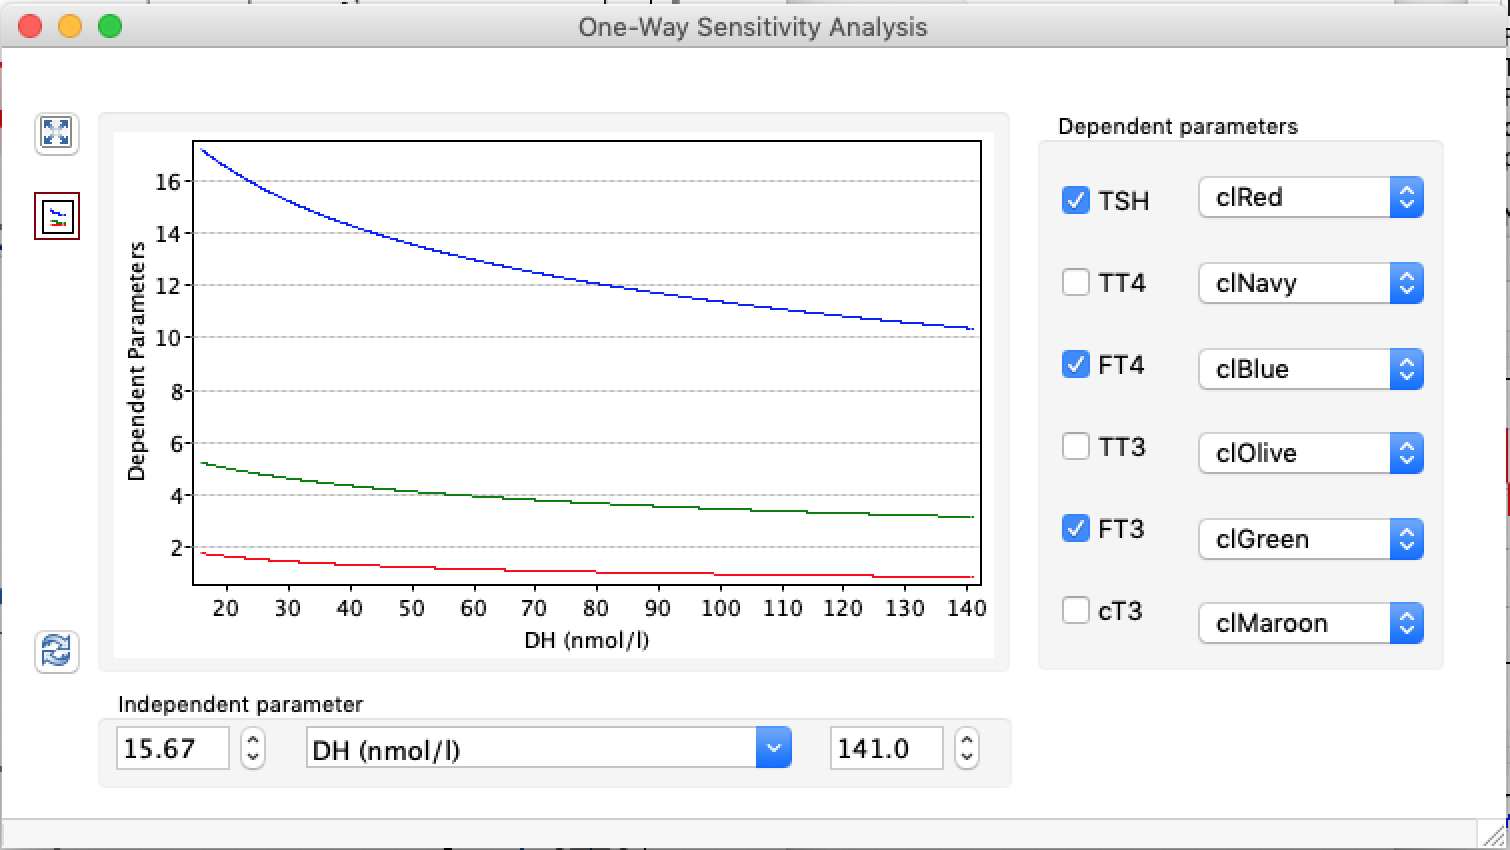
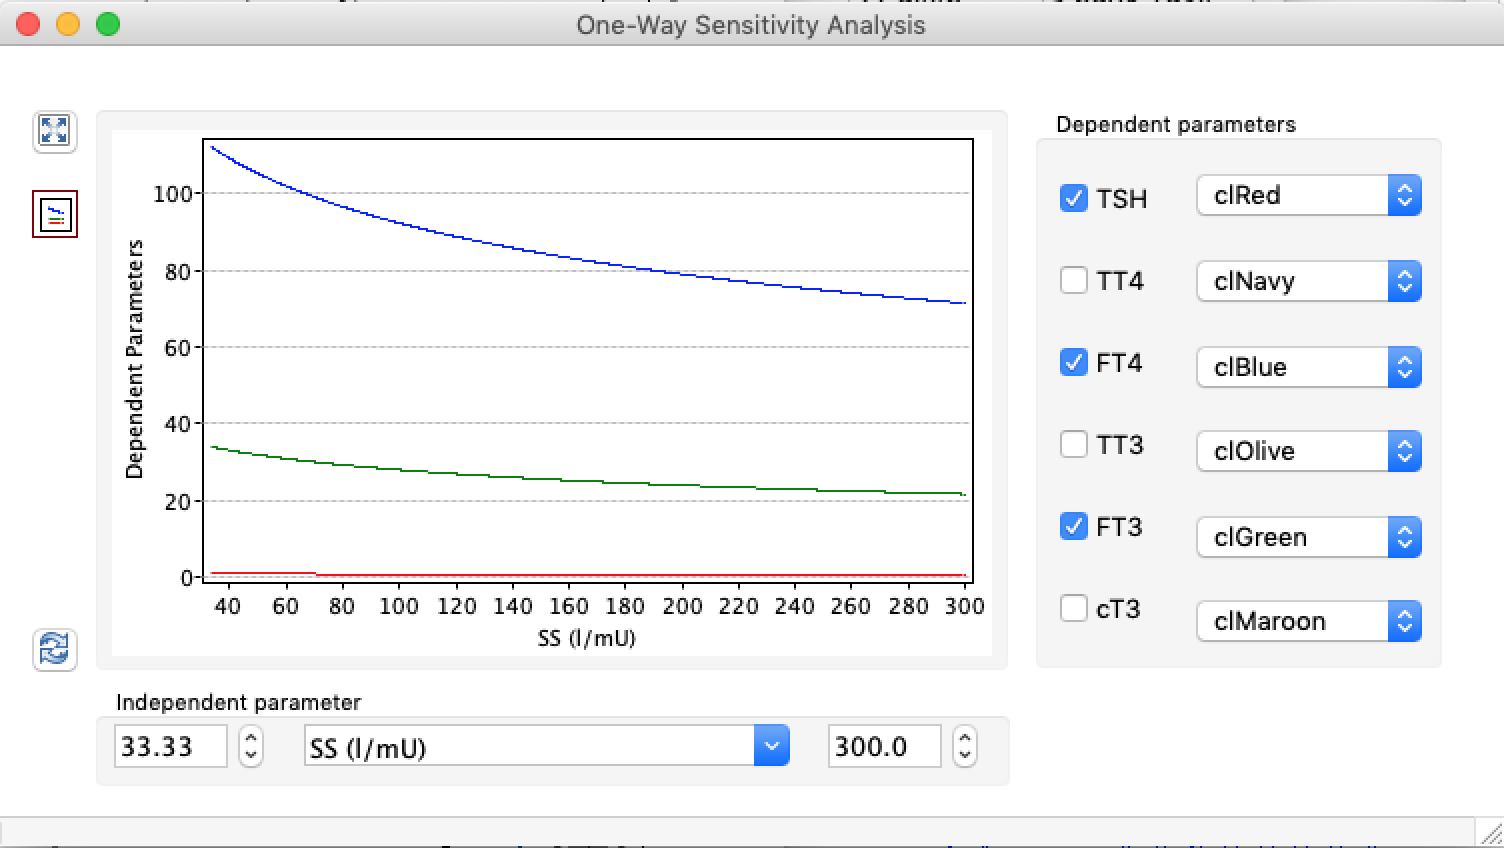
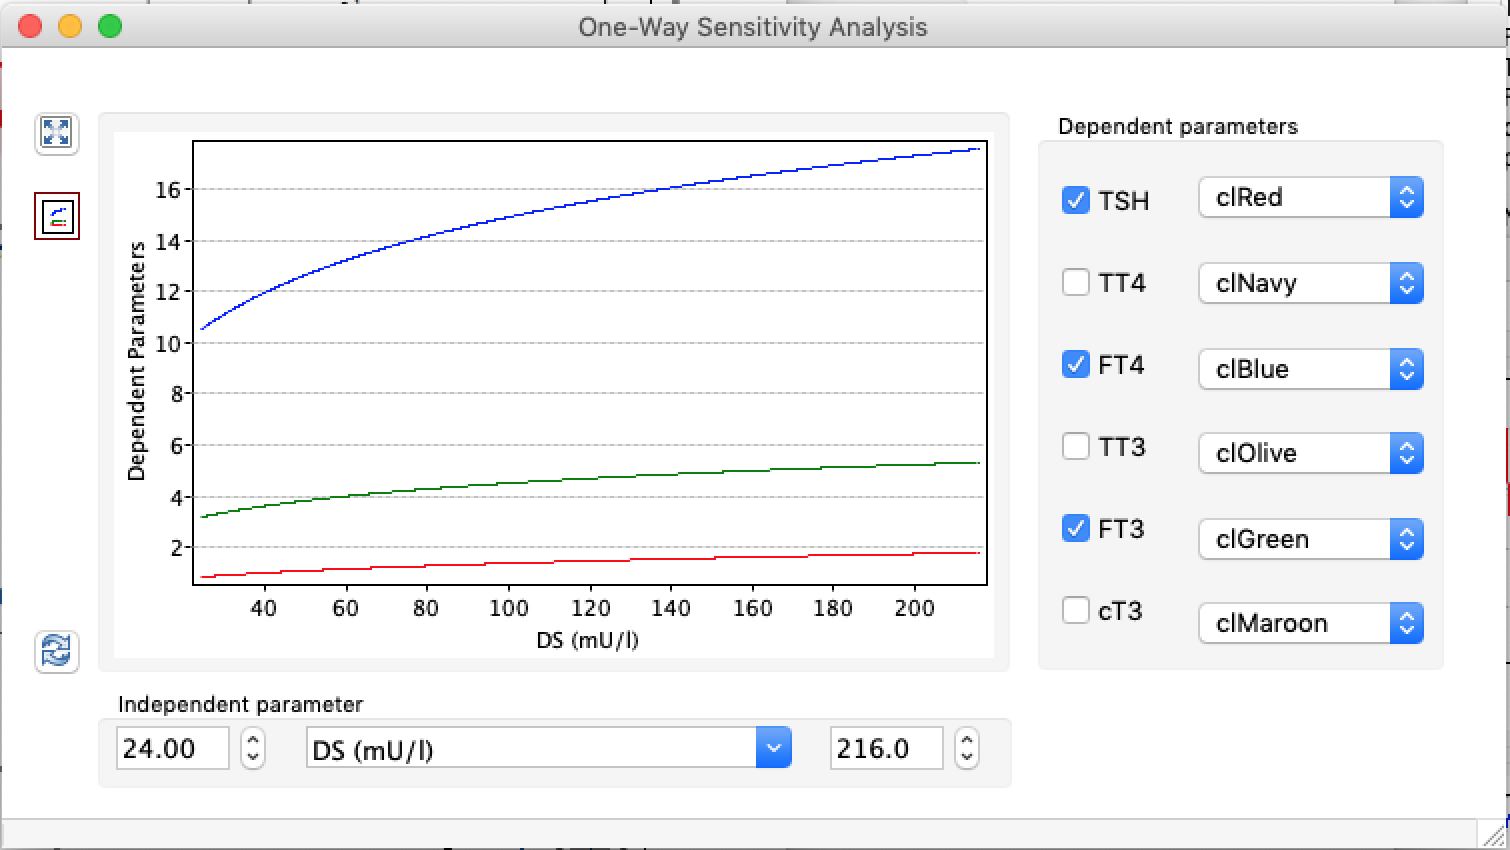
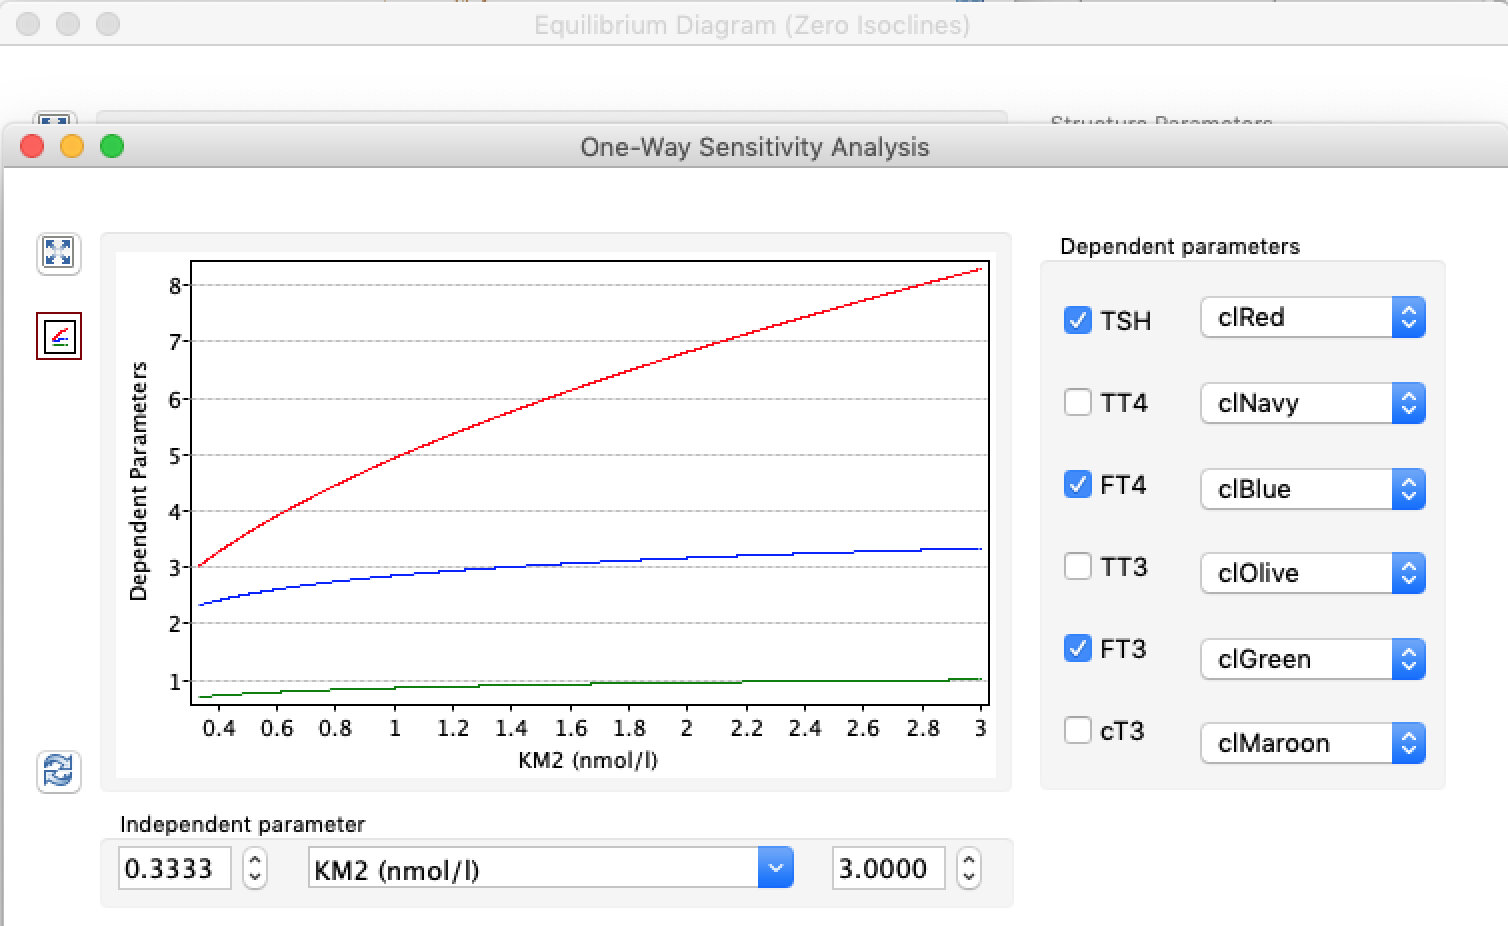
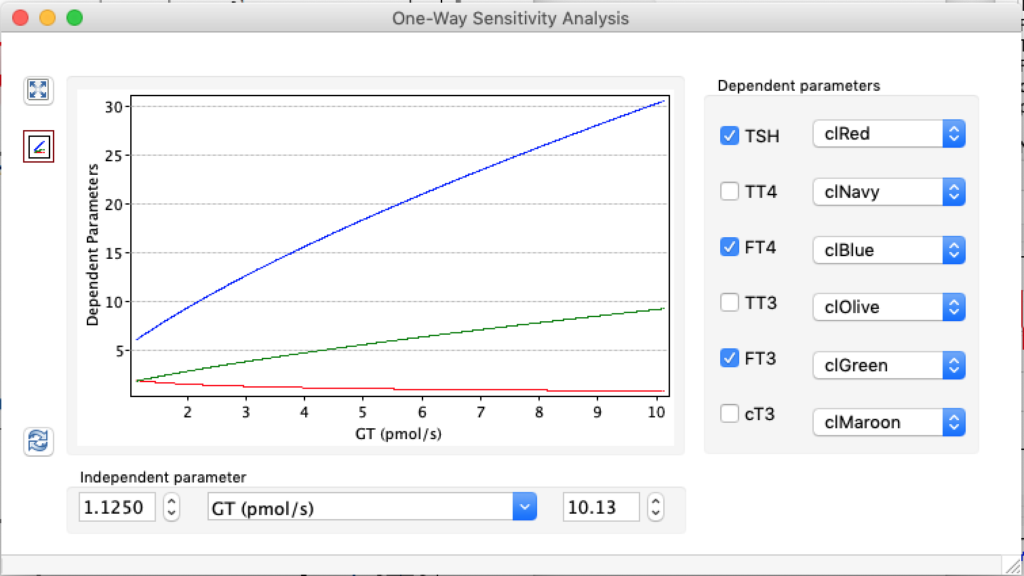
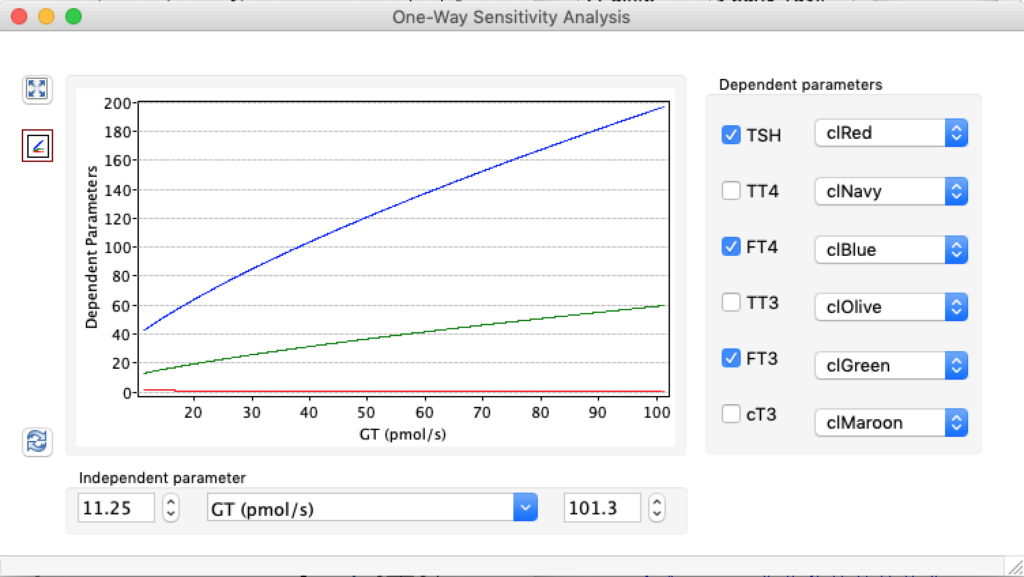
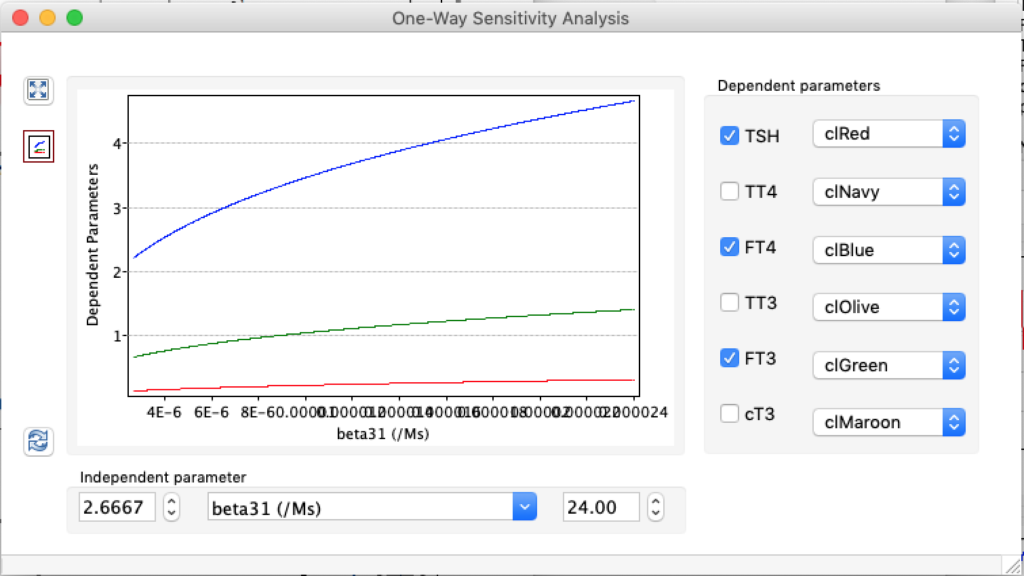
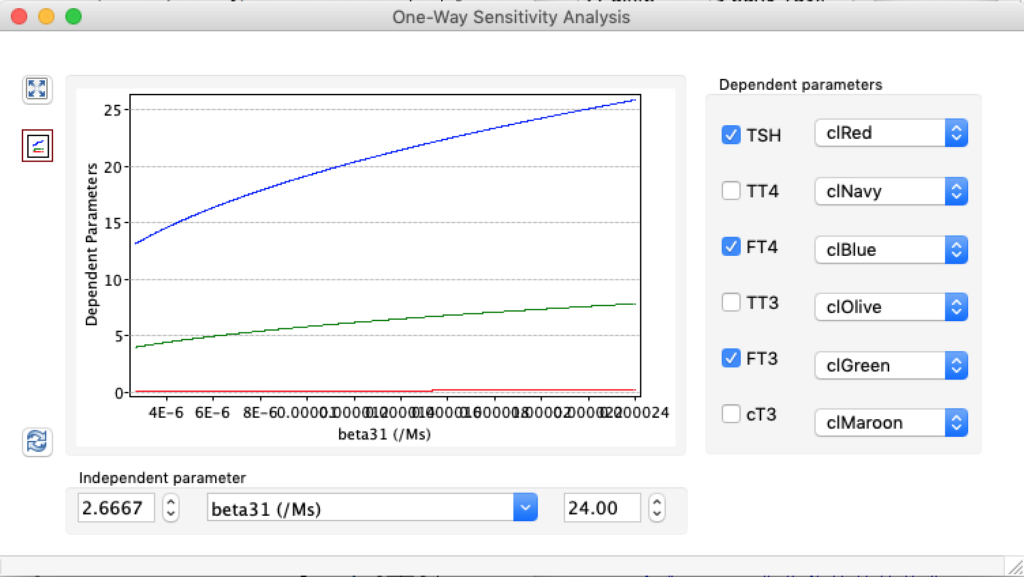
GD 1: Sum activity of peripheral type 1 deiodinase (D1).
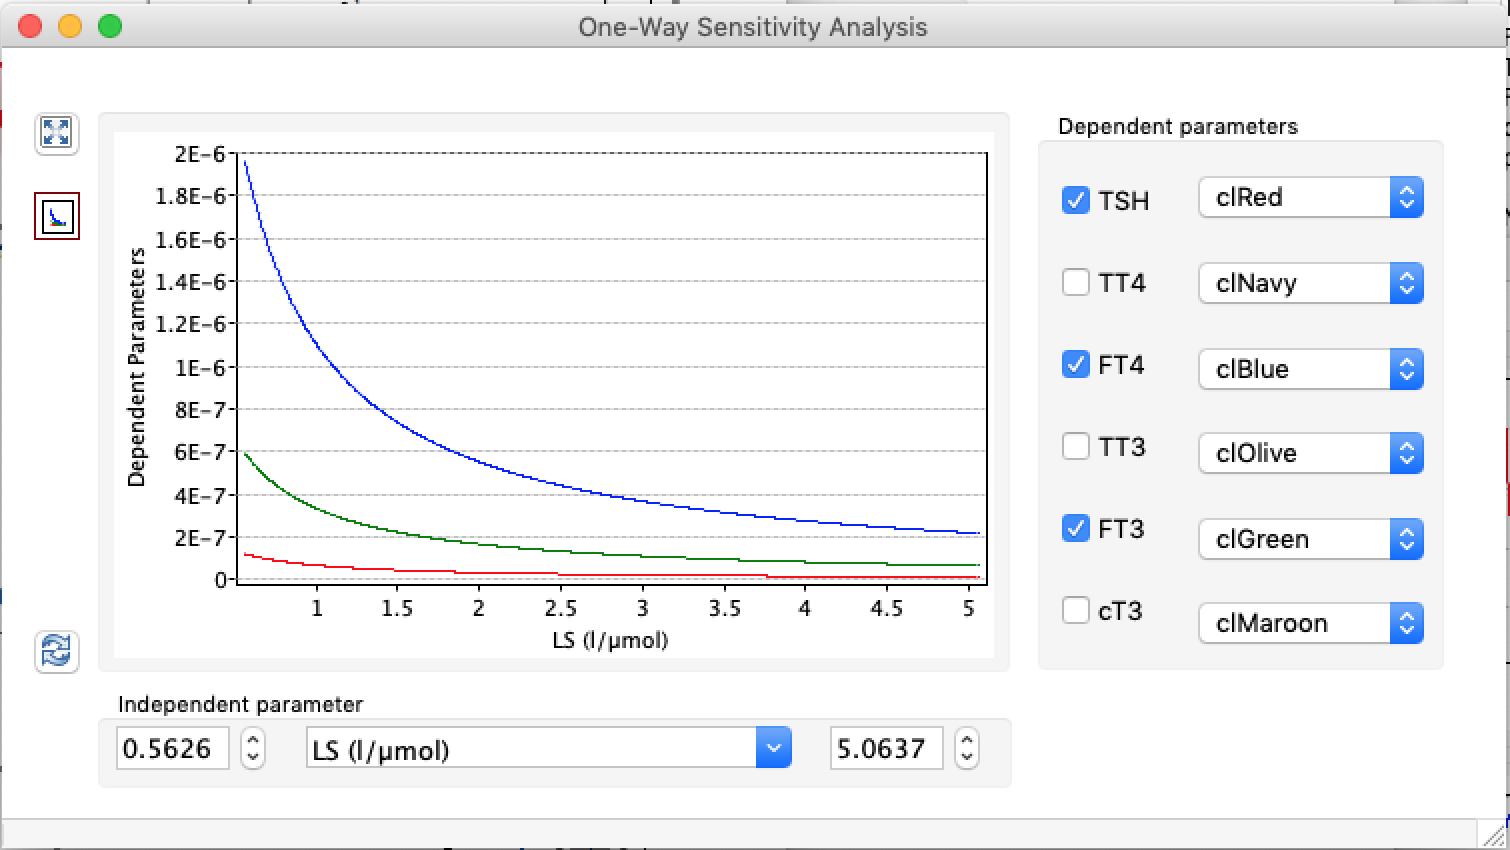
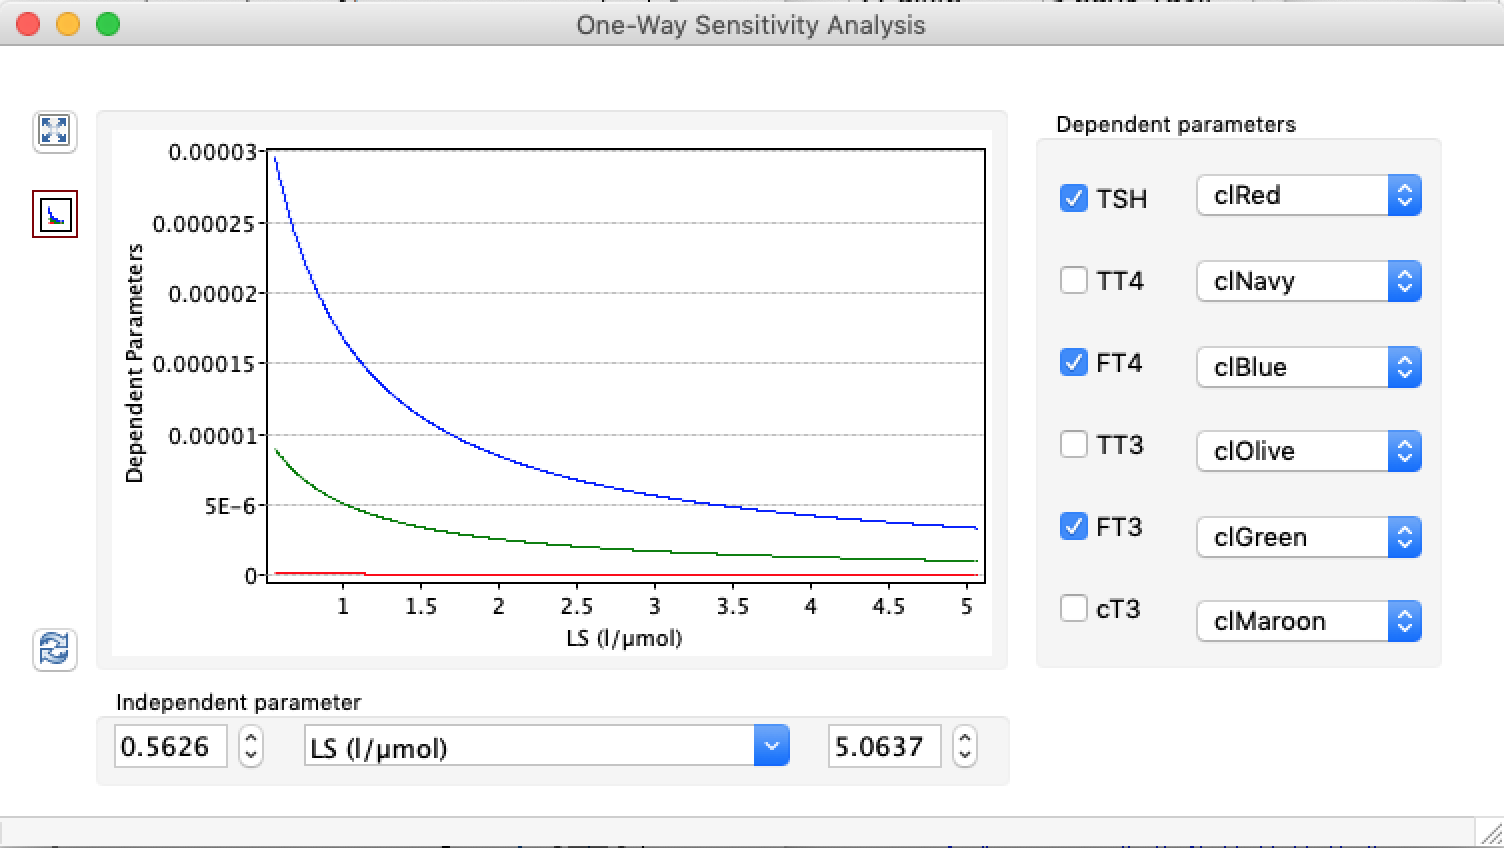
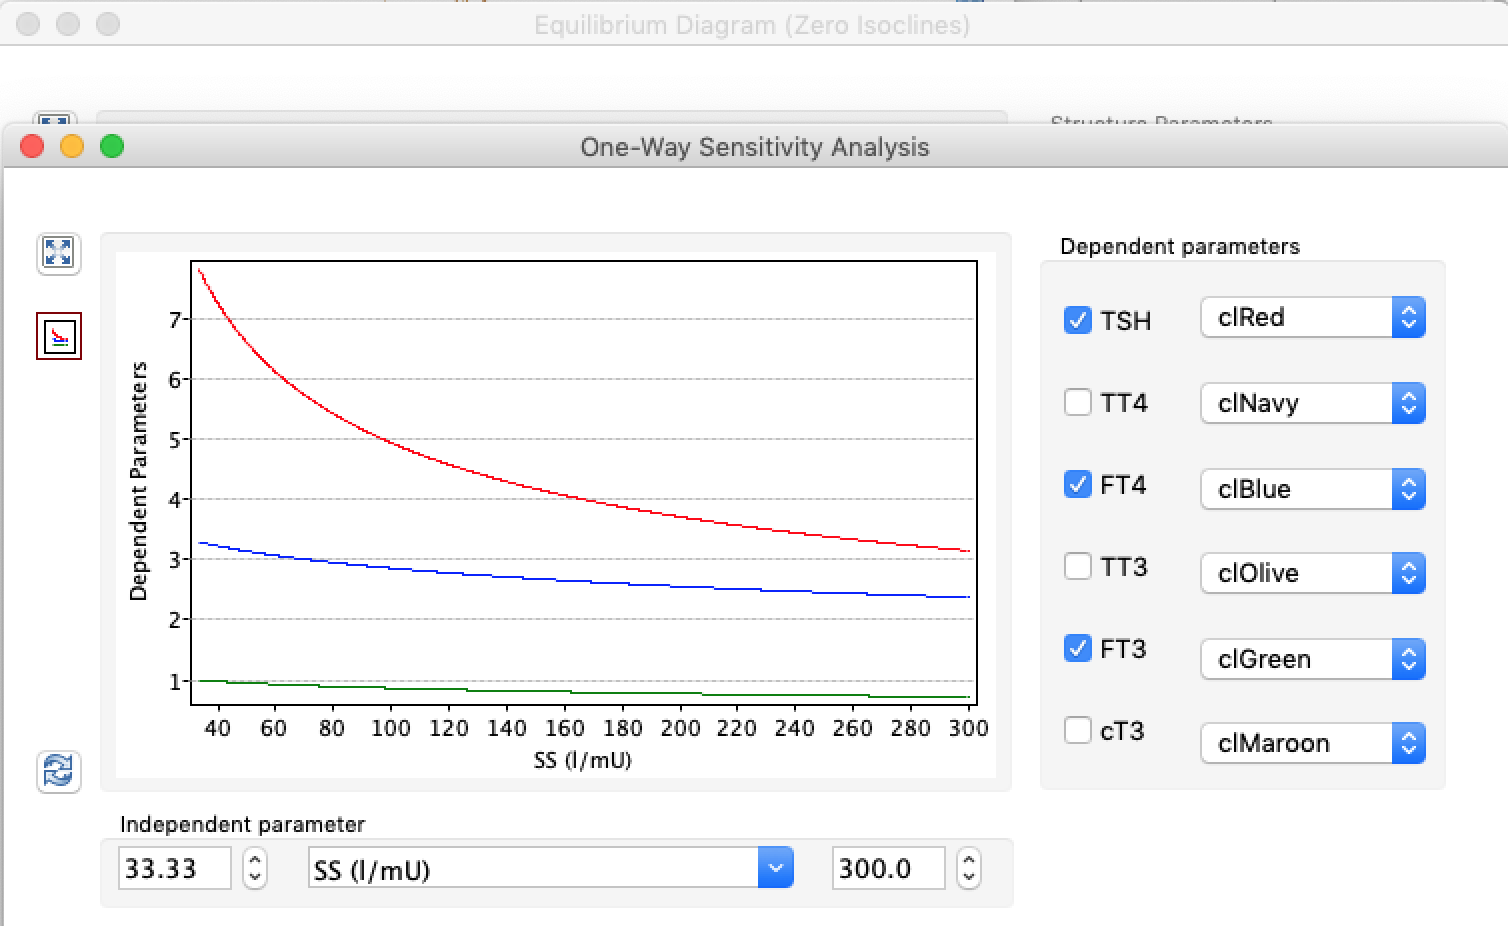
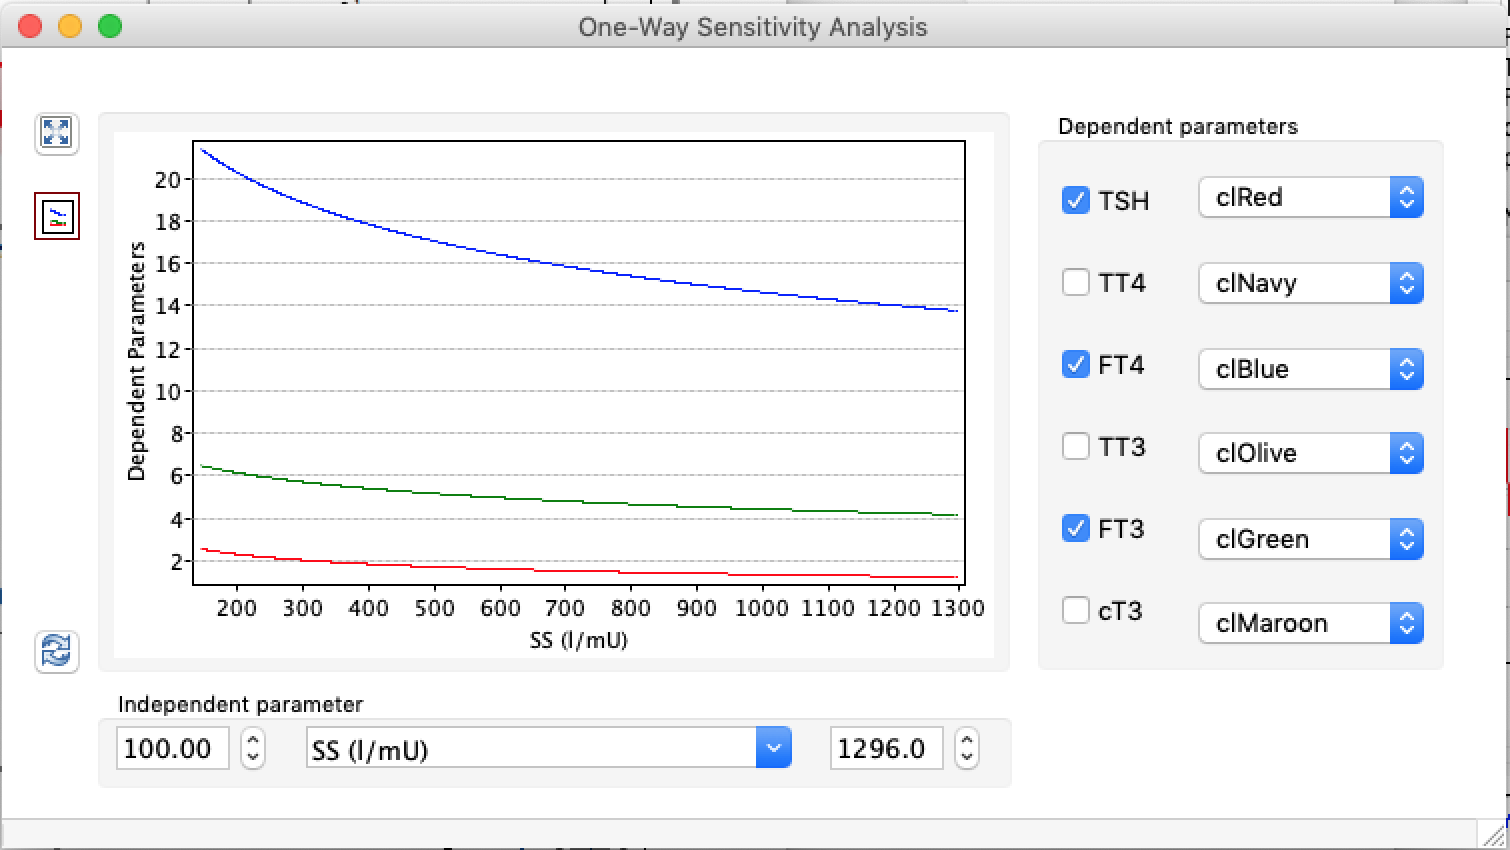
As can be seen, TSH and fT4 are horizontal and fT3 levels increase with increased GD1 level. Reflecting that increase and decrease of GD1 only affects T3/fT3 values. The green area is the reference range for GD
![](https://www.glensbo.dk/circle/wp-content/uploads/2020/03/Skærmbillede-2020-03-11-kl.-20.19.41-1-1024x490.png)
![](https://www.glensbo.dk/circle/wp-content/uploads/2020/03/Skærmbillede-2020-03-11-kl.-20.20.28-1024x490.png)
![](https://www.glensbo.dk/circle/wp-content/uploads/2020/02/decreasedBeta31-1024x629.png)
![](https://www.glensbo.dk/circle/wp-content/uploads/2020/02/stdBeta31-1024x576.png)
![](https://www.glensbo.dk/circle/wp-content/uploads/2020/02/increasedBeta31-1024x577.png)
![](https://www.glensbo.dk/circle/wp-content/uploads/2020/02/decreasedGH-1024x629.png)
![](https://www.glensbo.dk/circle/wp-content/uploads/2020/02/stdGH-1024x576.png)
![](https://www.glensbo.dk/circle/wp-content/uploads/2020/02/increasedGH-1024x577.png)
![](https://www.glensbo.dk/circle/wp-content/uploads/2020/03/decreasedBetaT-1024x629.png)
![](https://www.glensbo.dk/circle/wp-content/uploads/2020/03/stdBetaT-1024x576.png)
![](https://www.glensbo.dk/circle/wp-content/uploads/2020/03/increasedBetaT-1024x577.png)
![](https://www.glensbo.dk/circle/wp-content/uploads/2020/03/decreasedGT-1024x629.png)
![](https://www.glensbo.dk/circle/wp-content/uploads/2020/03/stdGT-1024x576.png)
![](https://www.glensbo.dk/circle/wp-content/uploads/2020/03/increasedGT-1024x577.png)
![](https://www.glensbo.dk/circle/wp-content/uploads/2020/03/decreasedKM1-1024x629.png)
![](https://www.glensbo.dk/circle/wp-content/uploads/2020/03/stdKM1-1024x576.png)
![](https://www.glensbo.dk/circle/wp-content/uploads/2020/03/increasedKM1-1024x577.png)
![](https://www.glensbo.dk/circle/wp-content/uploads/2020/03/decreasedBeta31-1024x629.png)
![](https://www.glensbo.dk/circle/wp-content/uploads/2020/03/stdBeta31-1024x576.png)
![](https://www.glensbo.dk/circle/wp-content/uploads/2020/03/increasedBeta31-1024x577.png)
HER
In the euthyroid state, others and we have observed a considerable interindividual variability in FT4, TSH and their regulatory set points.15 39 40
Diversity:
Possible molecular mechanisms may include either different individual concentrations and affinities of TRs, variations in the distribution of iodothyronine transporters or a polymorphism in the type 2 deiodinase, which in the presence of a homozygous allele weakens the negative feedback of FT4 on TSH in humans.40 41