These plots are based on a theoretical model developed by Hoerman et al 2022. The changes in the figures are mine and not discussed with the creators – so I and not the authors are to blame for any error. I would like to show two citations from Rethinking Hypothyroidism, written by A. Bianco.
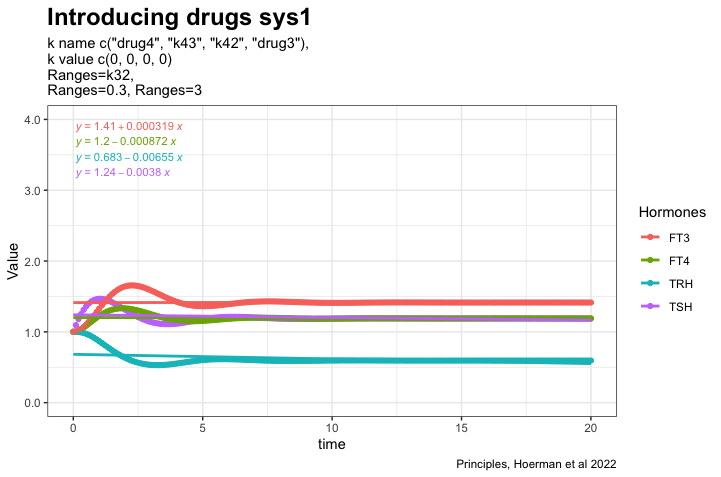
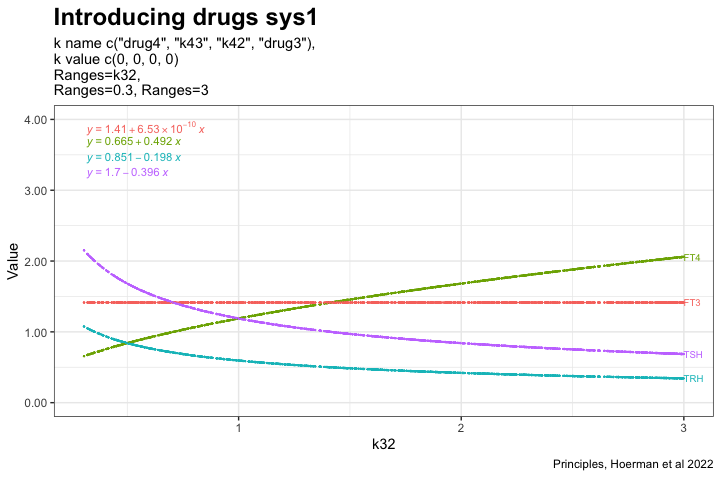
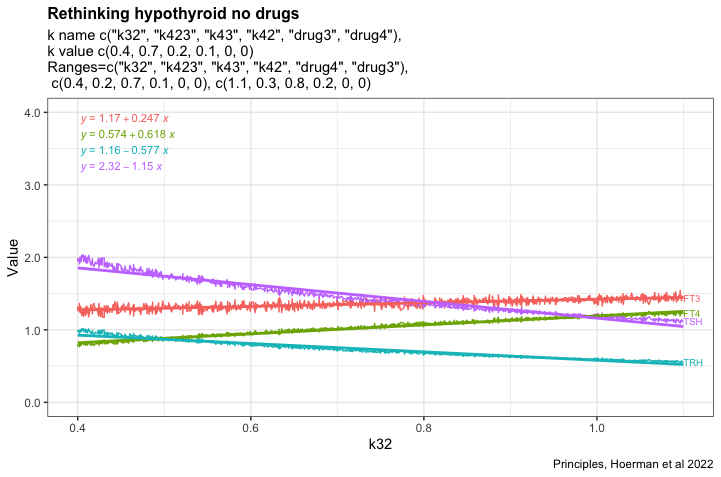
These two plots illustrate perfect homeostasis
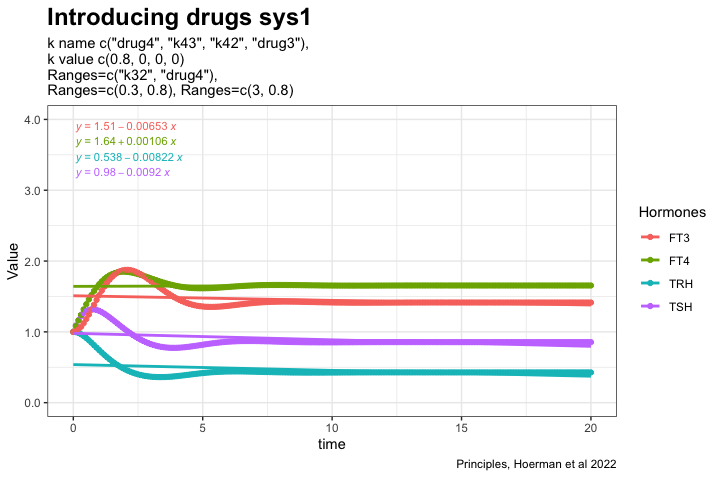
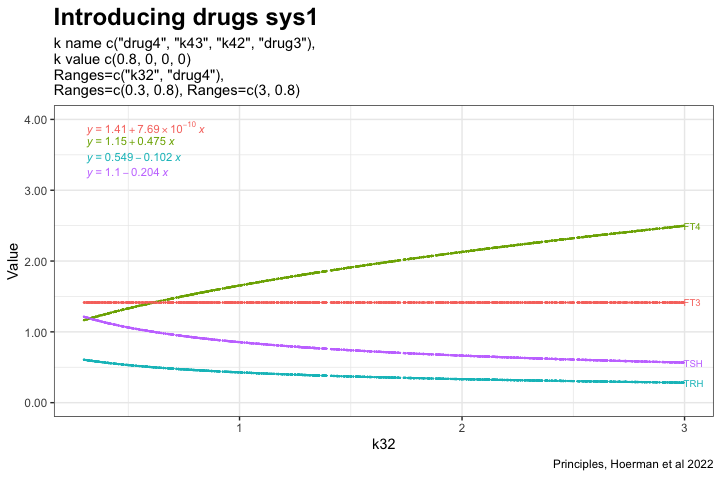
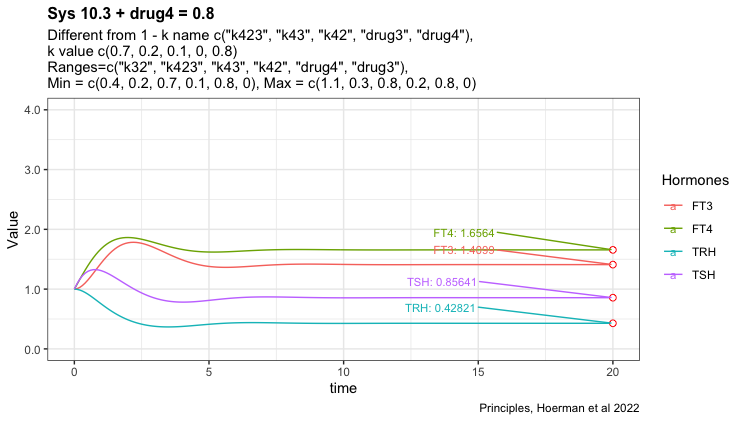
Here I have added L-T4 to the perfect homeostasis illustrating the hormone pattern in a situation where there is no need for L-T4. The gap between TSH/FT4 widens. (~1/3 is getting unnecessary L-T4 treatment. From Rethinking Hypothyroidism, A. Bianco 2022)
- TSH decreases
- FT4 increases
- FT3 increases
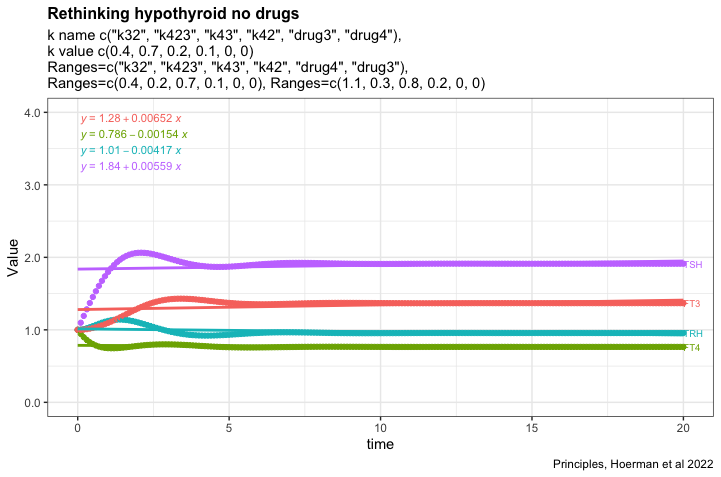
Introducing a hypothyroid pattern – TSH increases
L-T4 is added to the hypothyroid pattern and we see that L-T4 treatment is not restoring FT3 although TSH is normalized. ( “Once TSH had normalized, the metabolic rate had not,” from Rethinking Hypothyroidism, A. Bianco 2022)
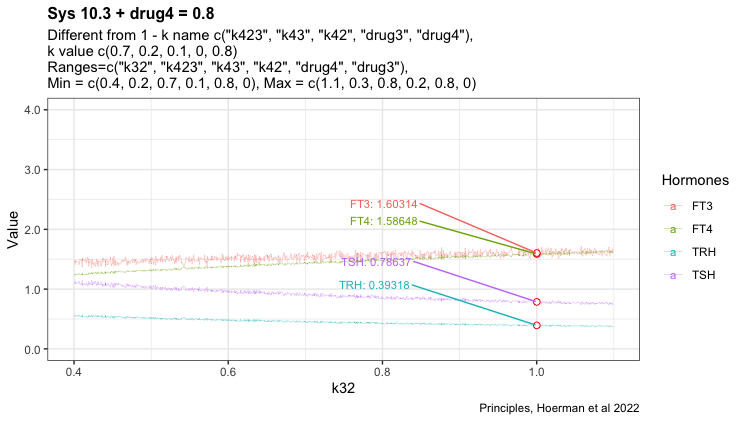
Is it possible to identify those patients who are not hypothyroid but is treated with L-T4 by the changed hormone pattern? In the perfect homeostasis scenario, the ratio FT4/TSH is close to one whereas in the perfect homeostasis with added LT4 the ratio looks close to 1.5. In the L-T4-treated hypothyroid pattern, the ratio is a little above one.
Will converting the hormone figures to standard values obscure the pattern?