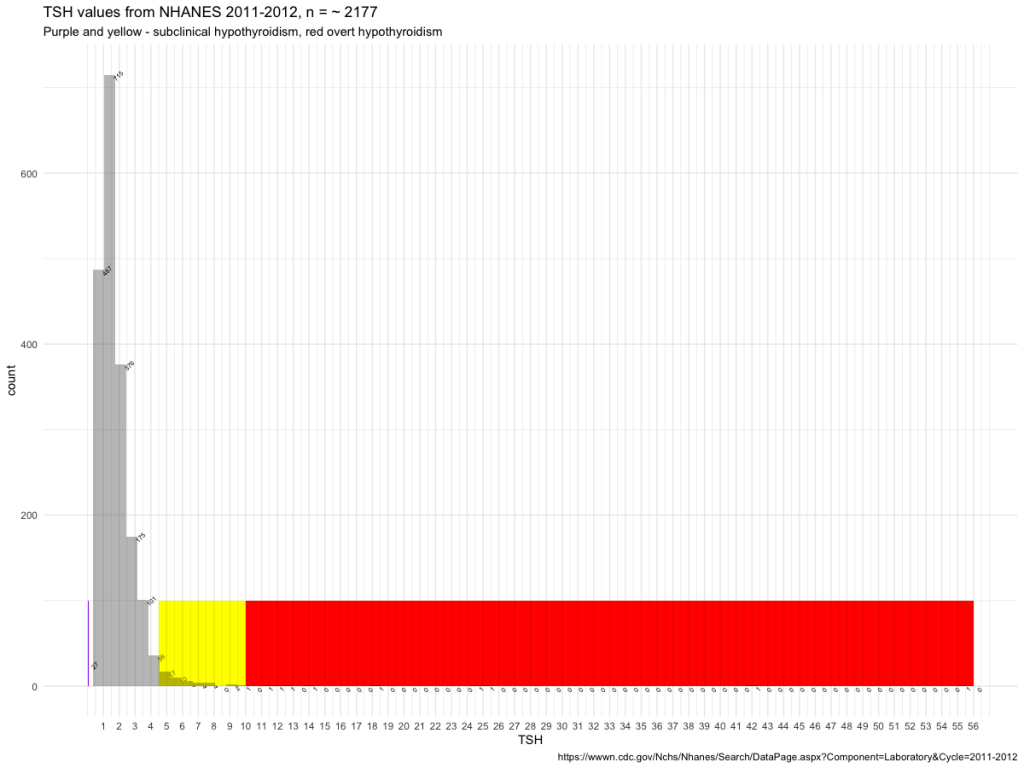
Thyroid Profile in this page – https://wwwn.cdc.gov/Nchs/Nhanes/Search/DataPage.aspx?Component=Laboratory&Cycle=2011-2012
Based on the data the following histogram was created showing counts for different levels of TSH.
Based on the data the following 3D scatterplot was created showing the high individuality of thyroid hormone combinations.
Running a script to identify distinct values showed that TSH, FT3 and FT4 were unique for 1964 observations.
For TSH, TT3, TT4 1949 observations were unique.
This shows based on these NHANES data, that the combination of the thyroid hormones is individual. Should treatment be based on averaged values or should the aim be finding the patients previous set-point?
Inspired by
doi:10.1530/EC-150056
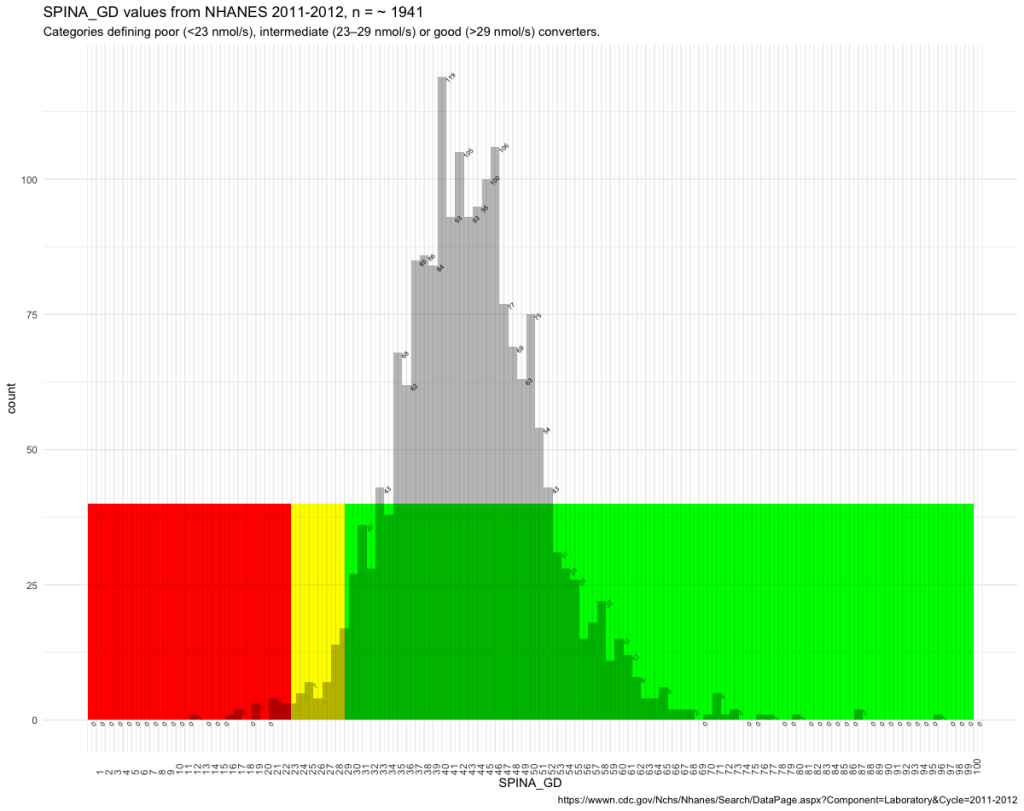
I have illustrated the SPINA-GD values from the NHANES data:
Then I looked at the FT3 and FT4 values also:
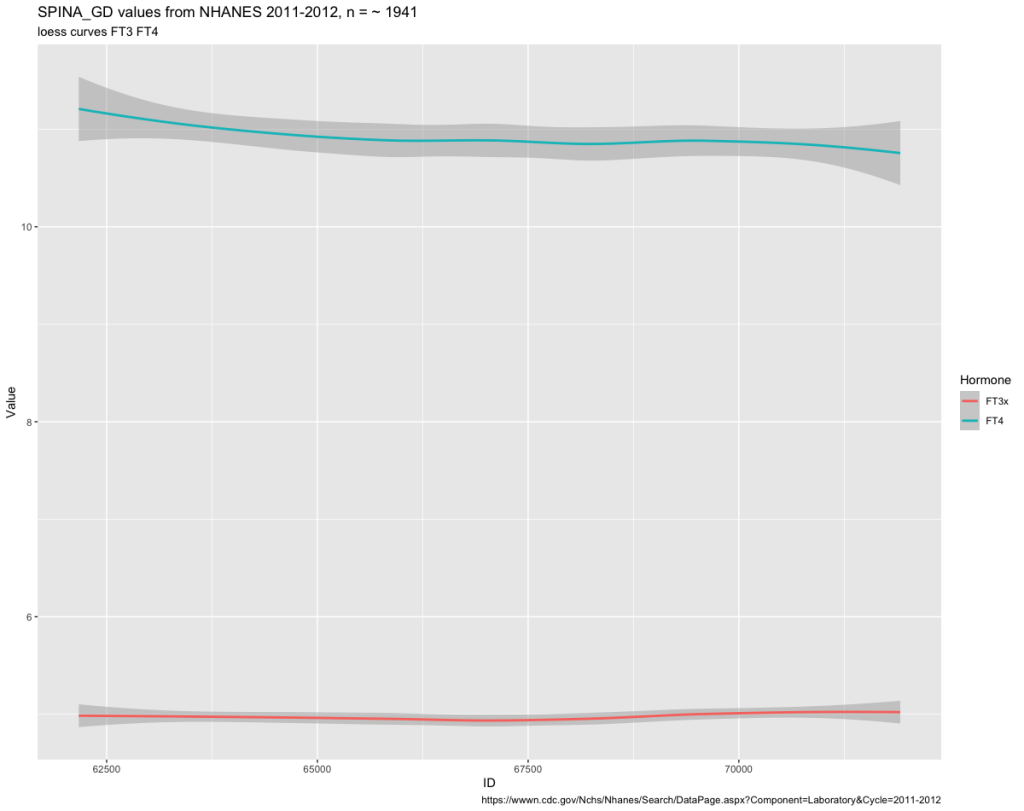
The two curves show changes perhaps reflecting the different categories from the SPINA-GD histogram.