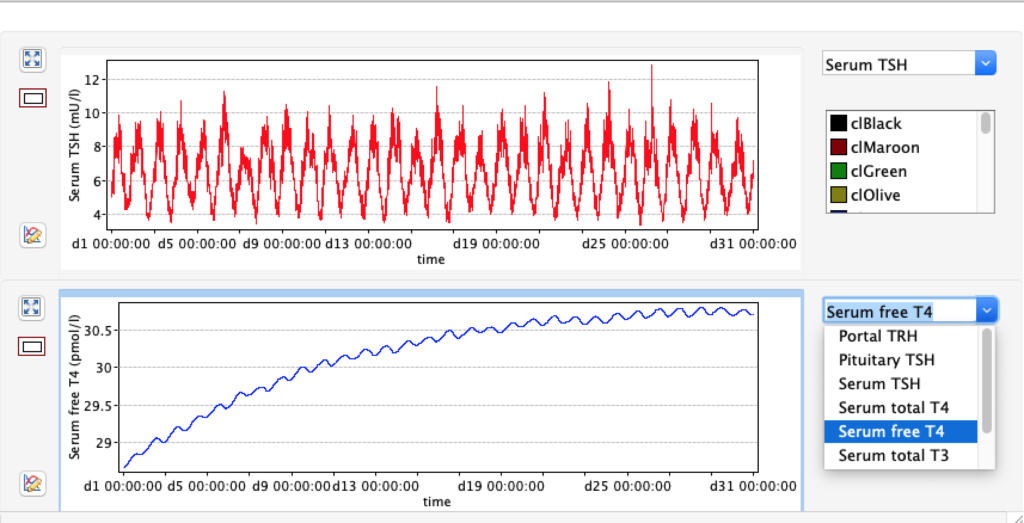
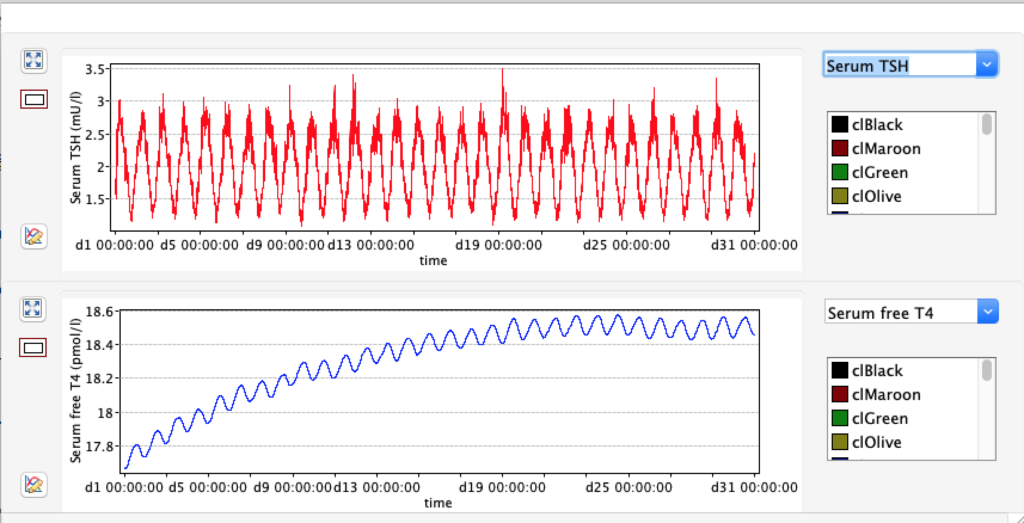
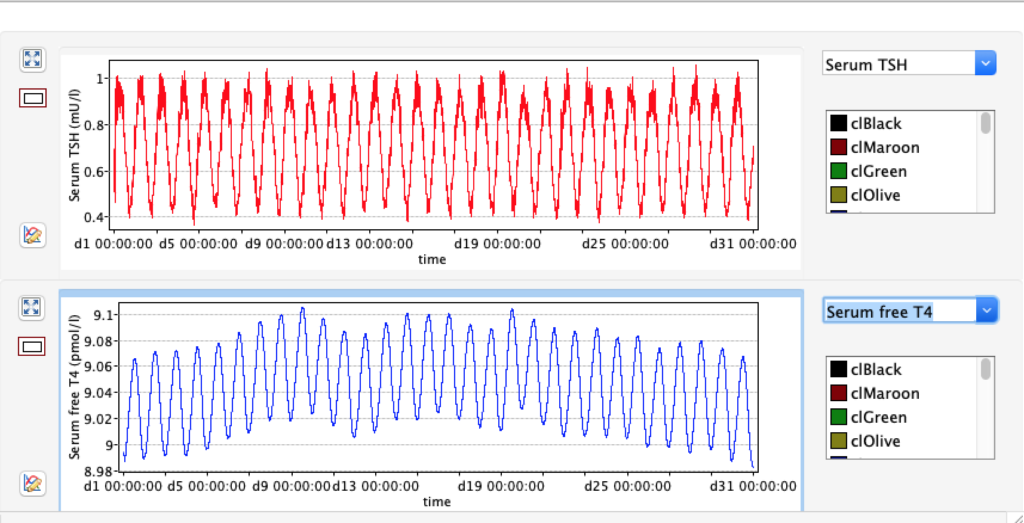
GD 2: Sum activity of central type 2 deiodinase (D2)
| TABLE 8. | Decrease GD2 ( /10 ) 4.3E-16 | STANDARD FIGURES | Increase GD2 (x10) 4.3E-14 |
| TRH | 2500 | 2500 | 2500 |
| TSH | 4.9923 | 1,8 | 0.6974 |
| TT4 | 197.8387 | 121,94 | 62.0698 |
| FT4 | 28.6681 | 17,67 | 8.9943 |
| TT3 | 5.2173 | 3,21 | 1.6369 |
| FT3 | 8.6810 | 5,35 | 2.7237 |
| cT3 | 11693.7408 | 11693,7490 | 11693.7408 |
Changes in this parameter affects not only the T3 values but also TSH and the T4 values. Simulated values shown here: