Which doctor do you prefer?

There is an ongoing debate on the quality of life of hypothyroid patients. Some 10% of patients report hypothyroid symptoms although they are pharmacologically compensated.

Doctors may have different treatment goals:

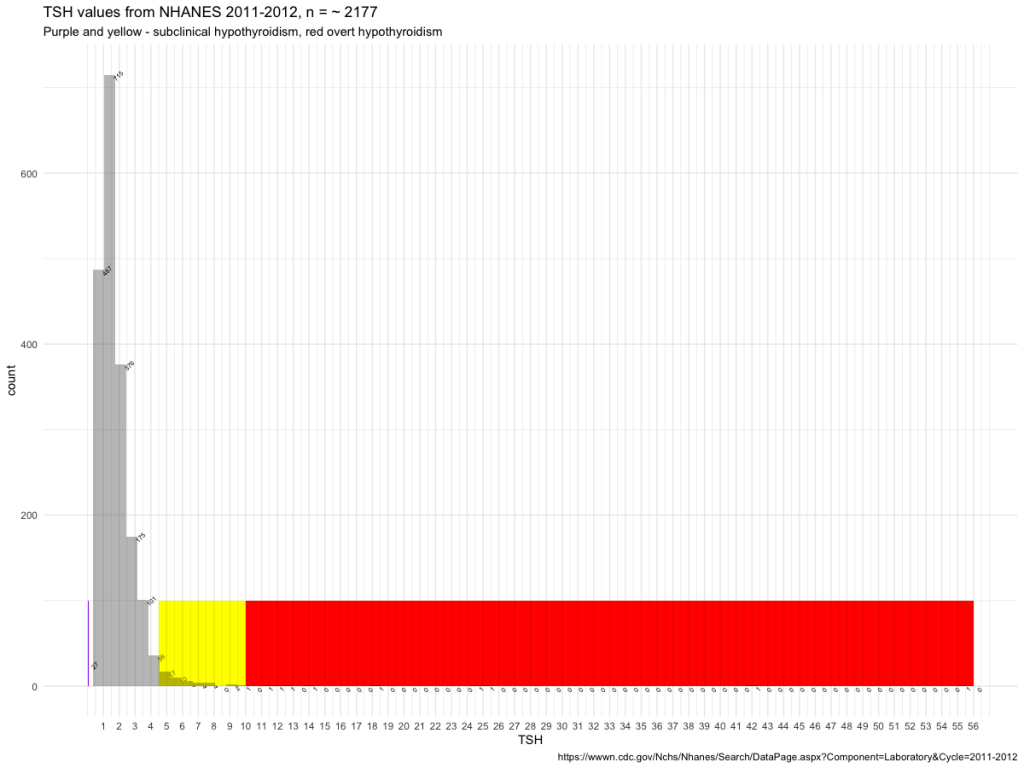
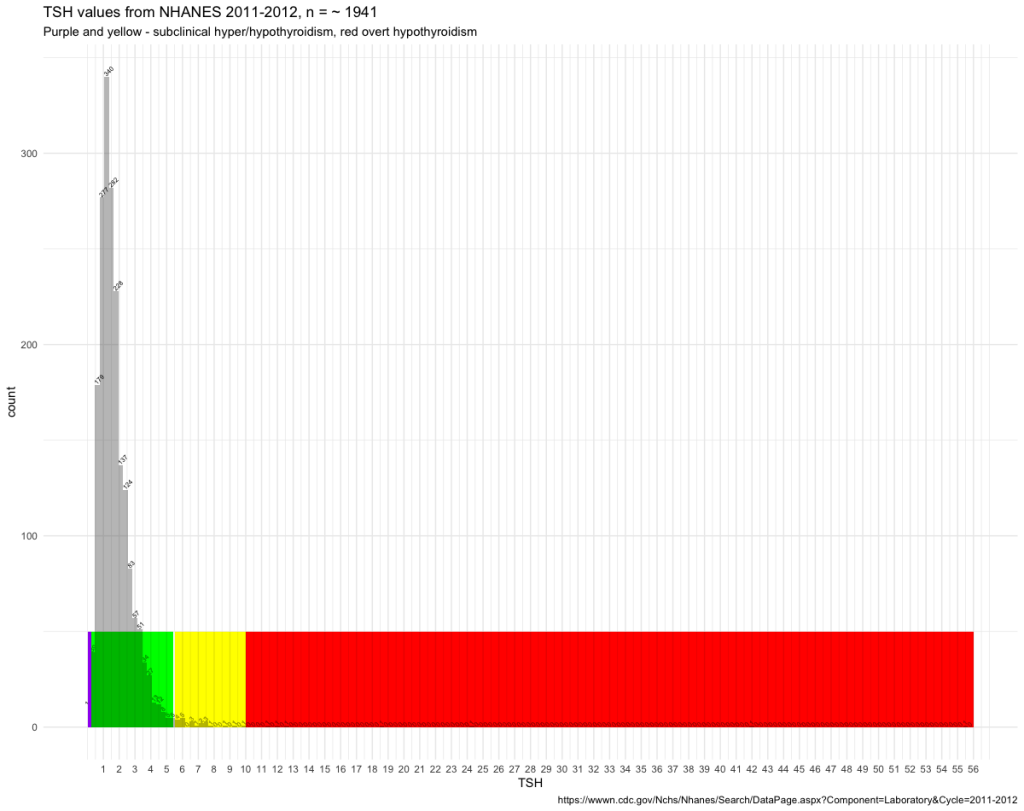
When the patients TSH is in the green range they are satisfied with the treatment result.

Others choose a more refined treatment goal:

Seeking the exact thyroid profile that suits the patient.

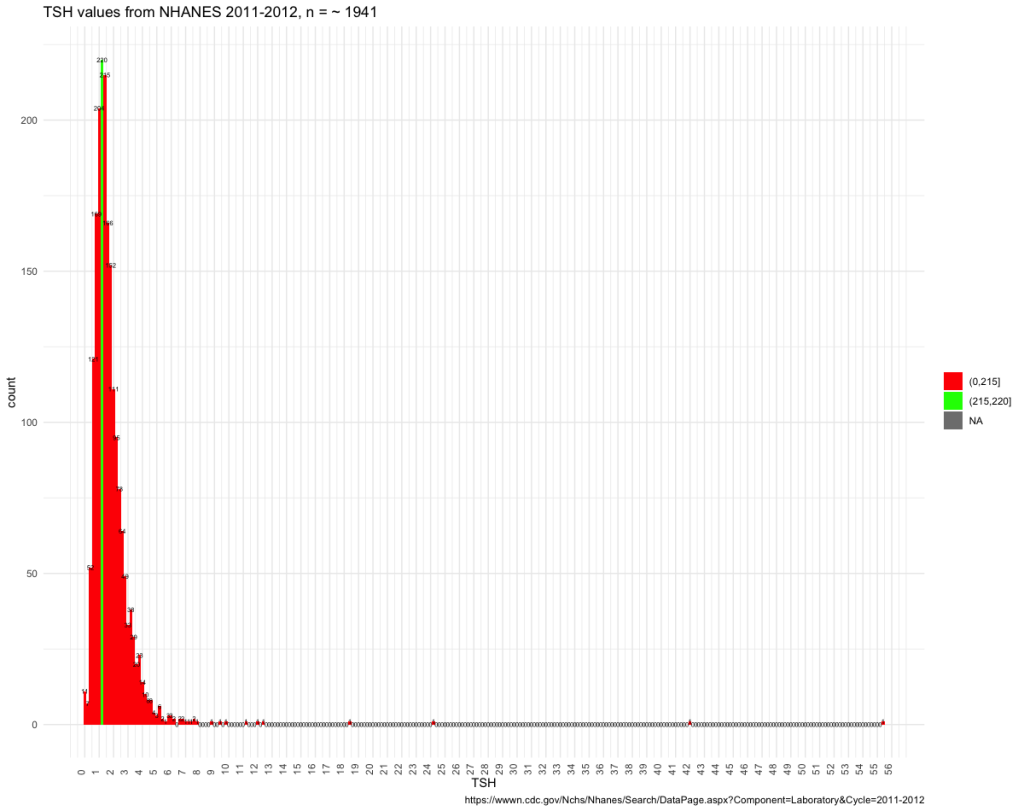
Patients are individual and so are their TSH values.

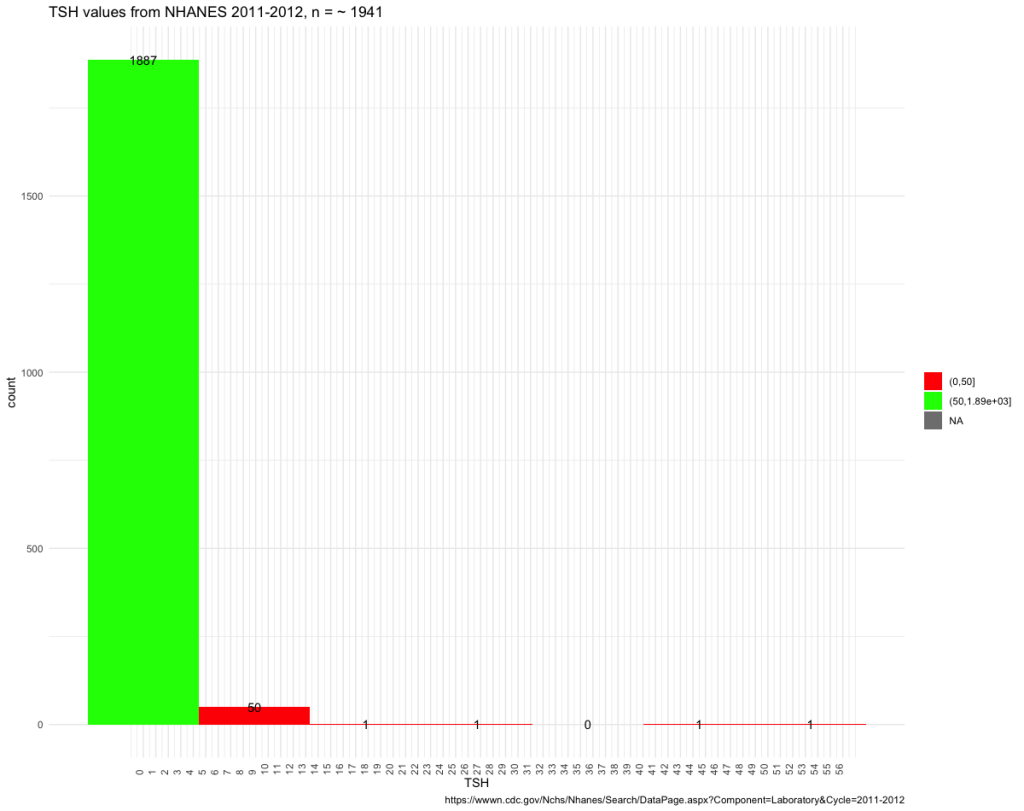
Using another image that has been changed logarithmically shows how few persons you may find in each of the bars:

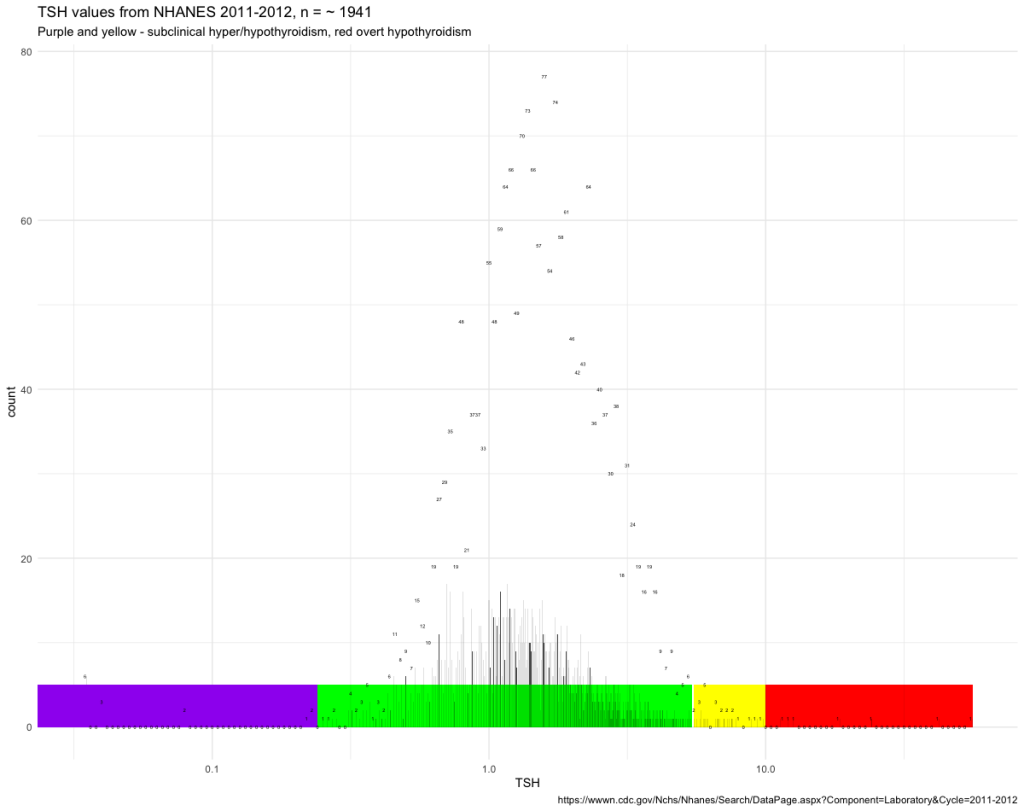
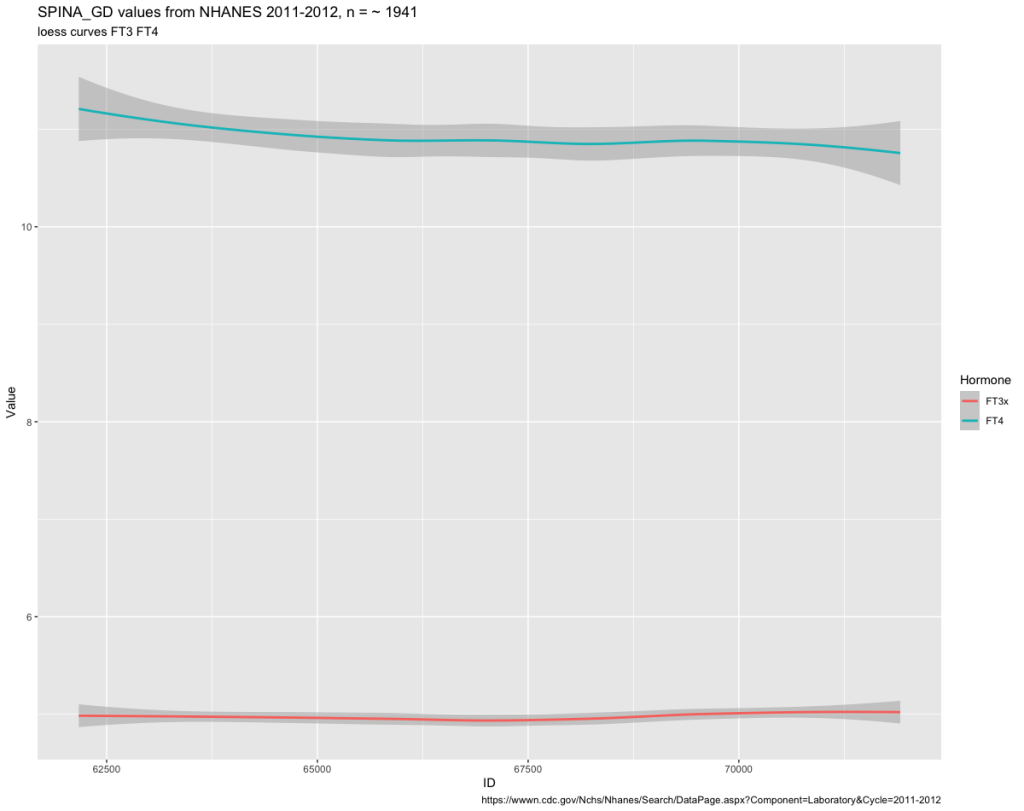
These images show how individual the TSH values are and that you should not accept an unsuccessful treatment. We have not yet looked at the two important hormones T4 and T3 but I will promise you that they will add to the individuality.

For now two tables with the raw data for the different figures that we will touch upon:

NHANES data

Thyroid Profile in this page – https://wwwn.cdc.gov/Nchs/Nhanes/Search/DataPage.aspx?Component=Laboratory&Cycle=2011-2012

Based on the data the following histogram was created showing counts for different levels of TSH.

Based on the data the following 3D scatterplot was created showing the high individuality of thyroid hormone combinations.

Running a script to identify distinct values showed that TSH, FT3 and FT4 were unique for 1964 observations.
For TSH, TT3, TT4 1949 observations were unique.

This shows based on these NHANES data, that the combination of the thyroid hormones is individual. Should treatment be based on averaged values or should the aim be finding the patients previous set-point?

Inspired by

doi:10.1530/EC-150056

Variation in the biochemical response to L-thyroxine therapy and relationship with peripheral thyroid hormone conversion efficiency

I have illustrated the SPINA-GD values from the NHANES data:

Then I looked at the FT3 and FT4 values also:

The two curves show changes perhaps reflecting the different categories from the SPINA-GD histogram.