While working on this page, I came across a saving opportunity in R – save.image. It was a fantastic possibility till it was not anymore. After opening R and pressing save.image left me with an empty workspace and hours of lost work. Hence this page is not complete yet.
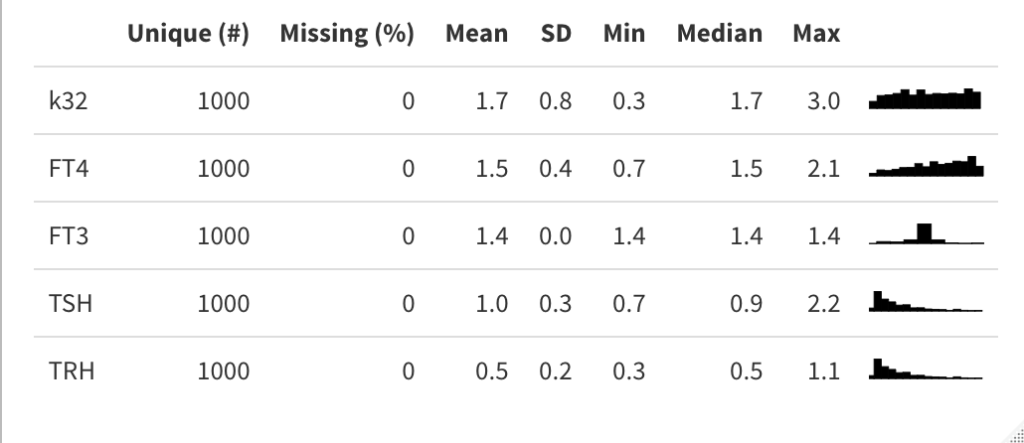
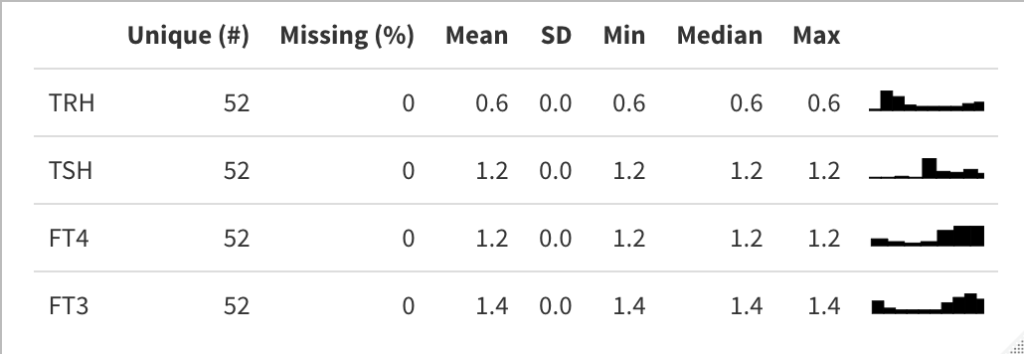
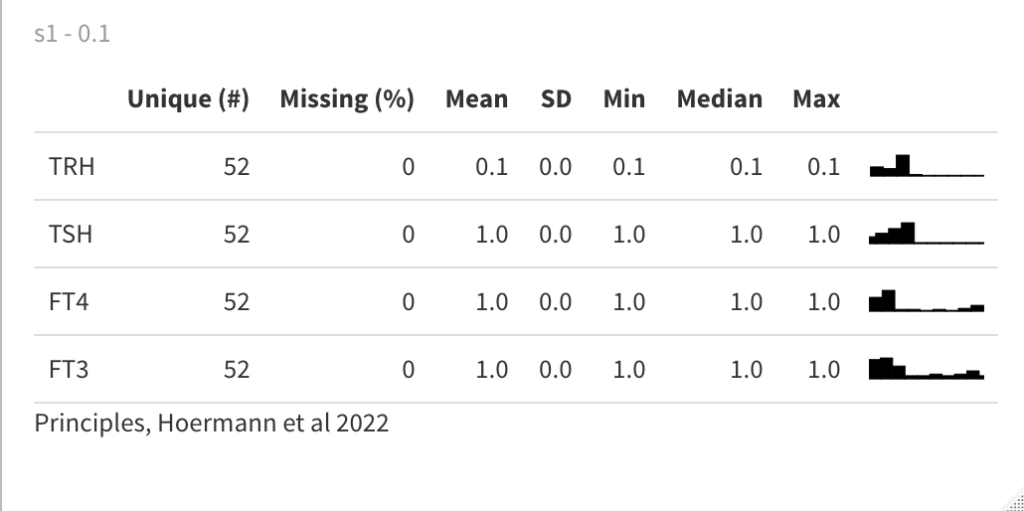
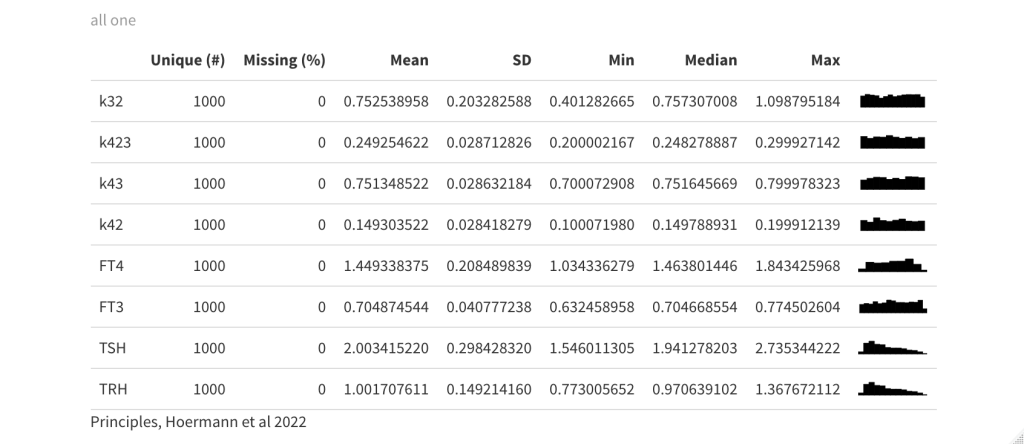
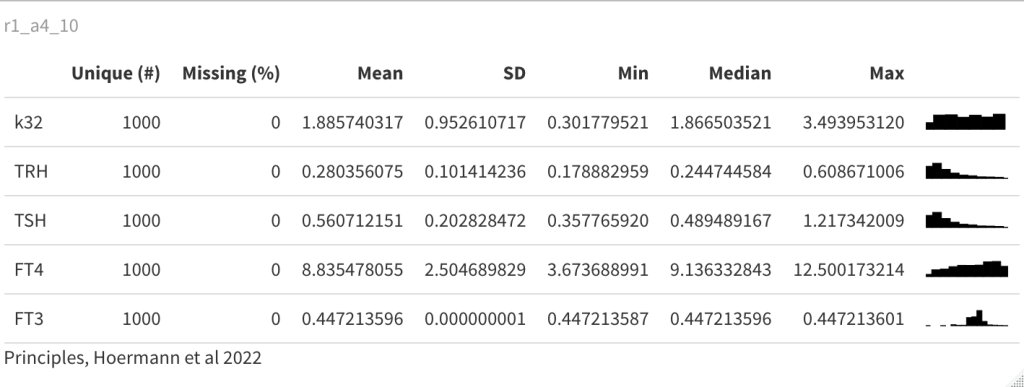
These tables show the complex (theoretical) interplay between the hormones.
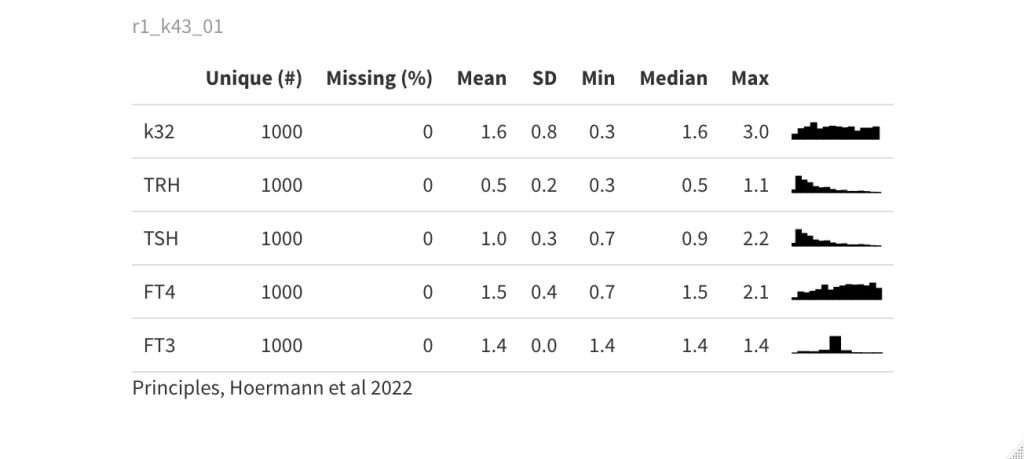
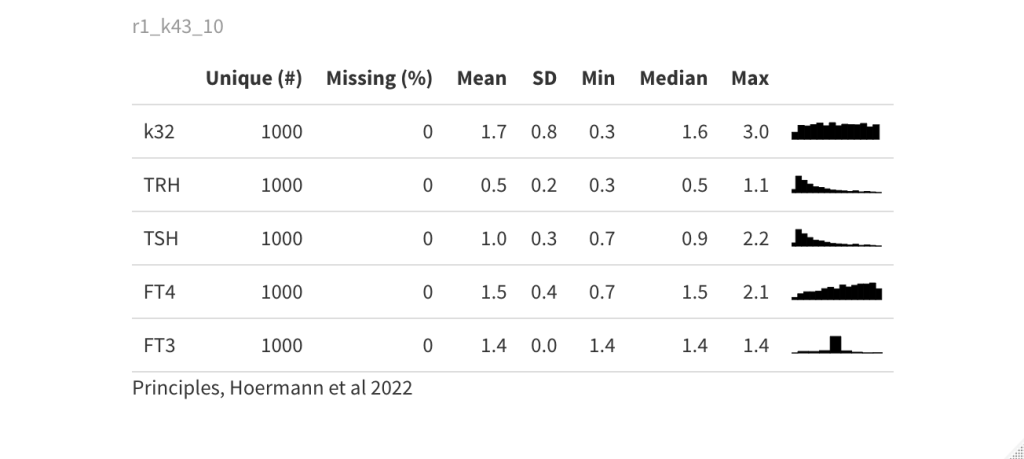
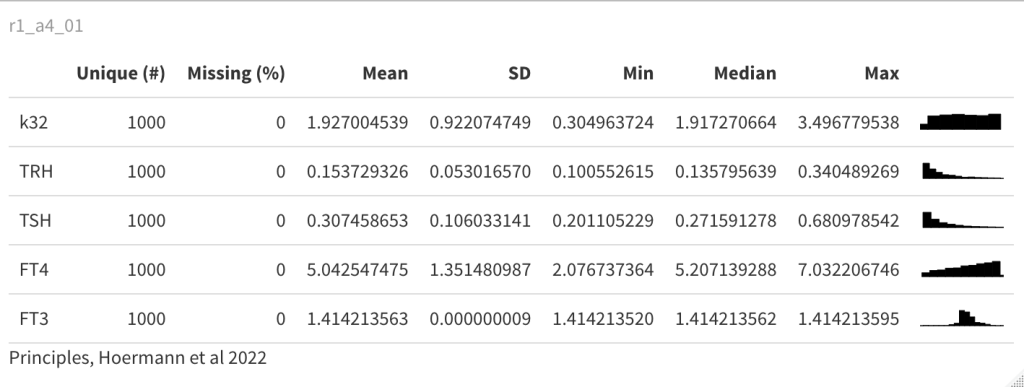
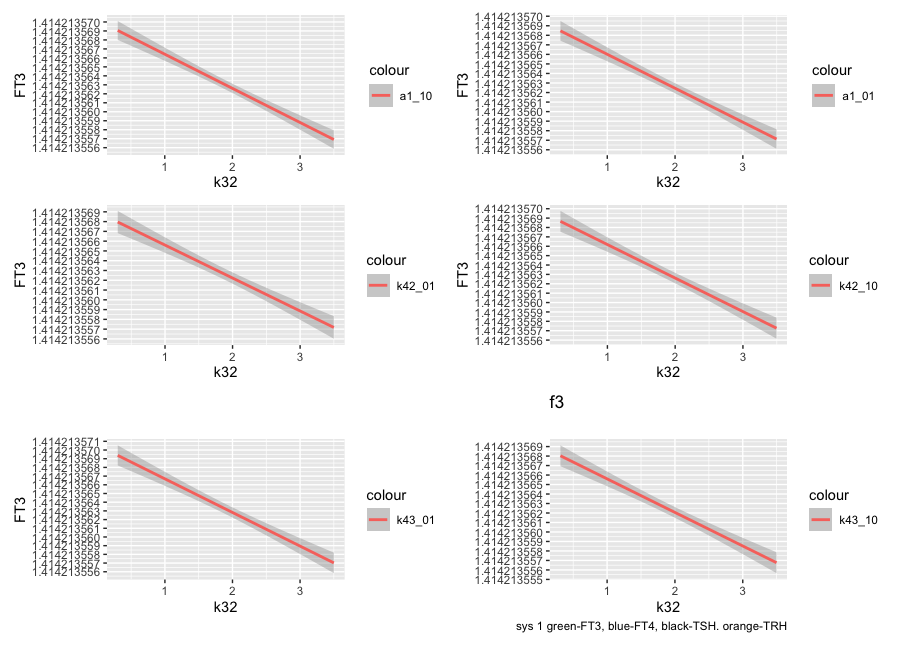
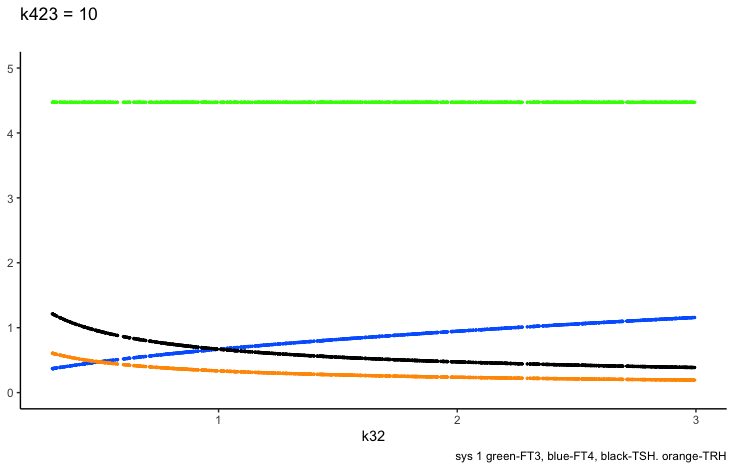
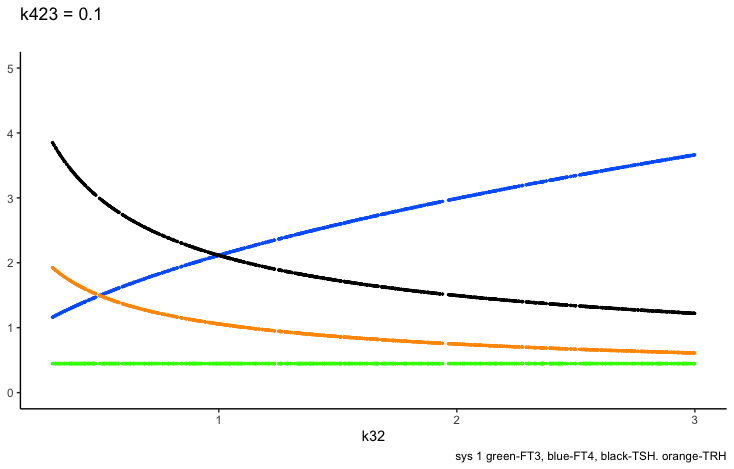
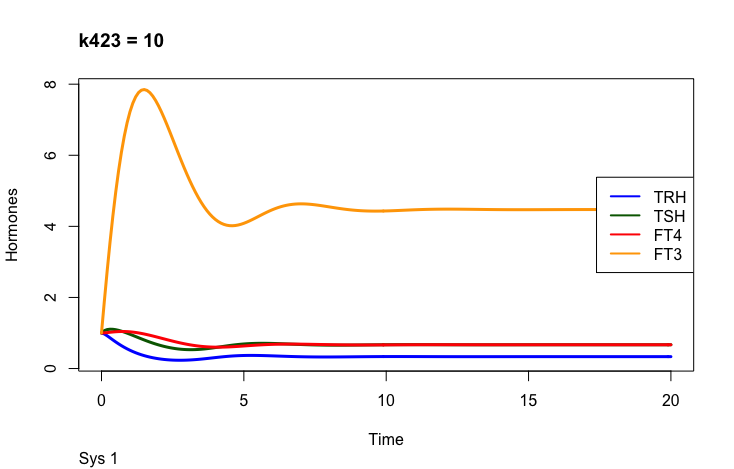
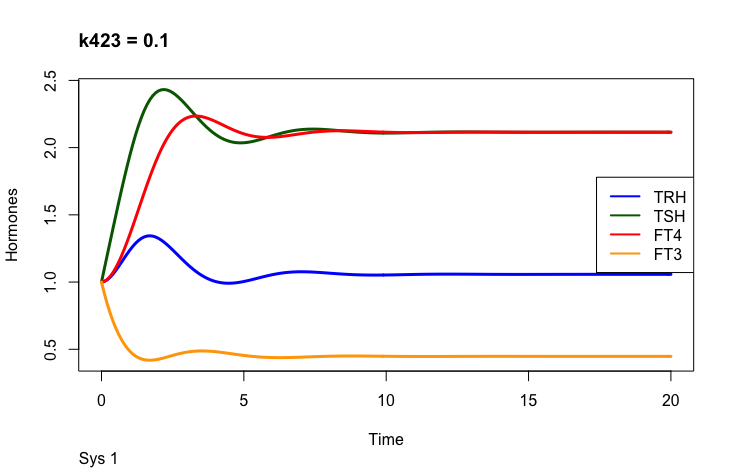
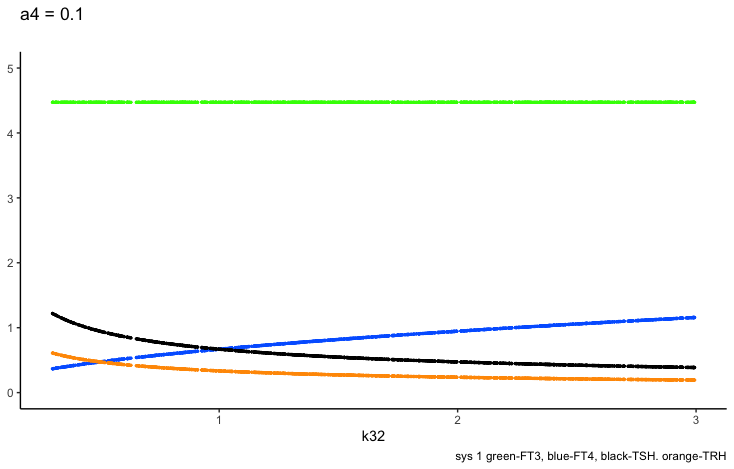
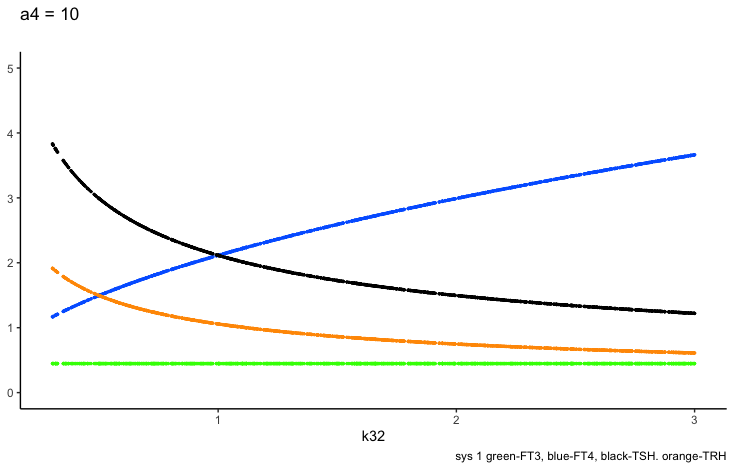
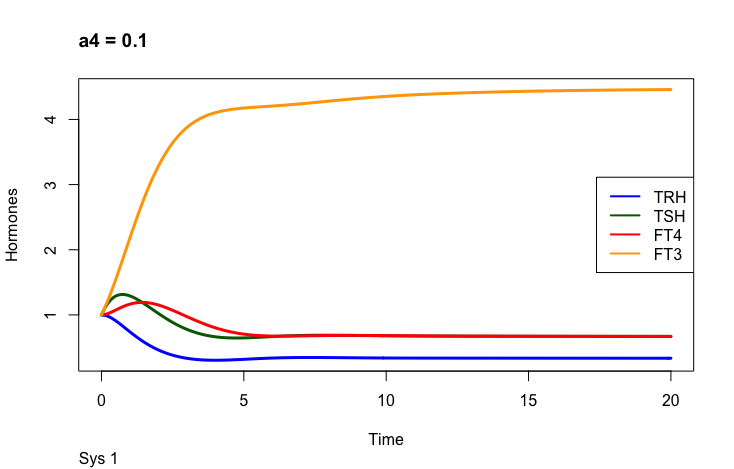
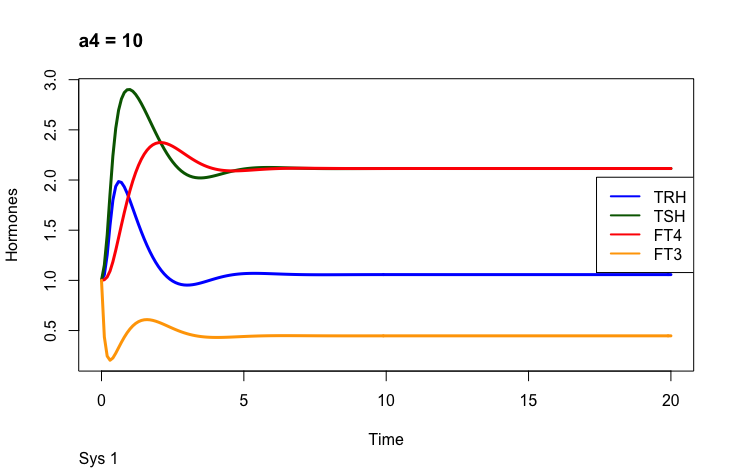
Two parameters may change the value of FT3 in the mathematical model (Ref.1); k423 – positive feedforward of TSH and FT4 onto FT3 (downstream, activating) a4 – the FT3 elimination rate constant.
Only examples of the effect of the parameter –
Hoermann R, Pekker MJ, Midgley JEM, Larisch R and Dietrich JW (2022) Principles of Endocrine Regulation: Reconciling Tensions Between Robustness in Performance and Adaptation to Change. Front. Endocrinol. 13:825107. doi: 10.3389/fendo.2022.825107 https://www.frontiersin.org/articles/10.3389/fendo.2022.825107/full
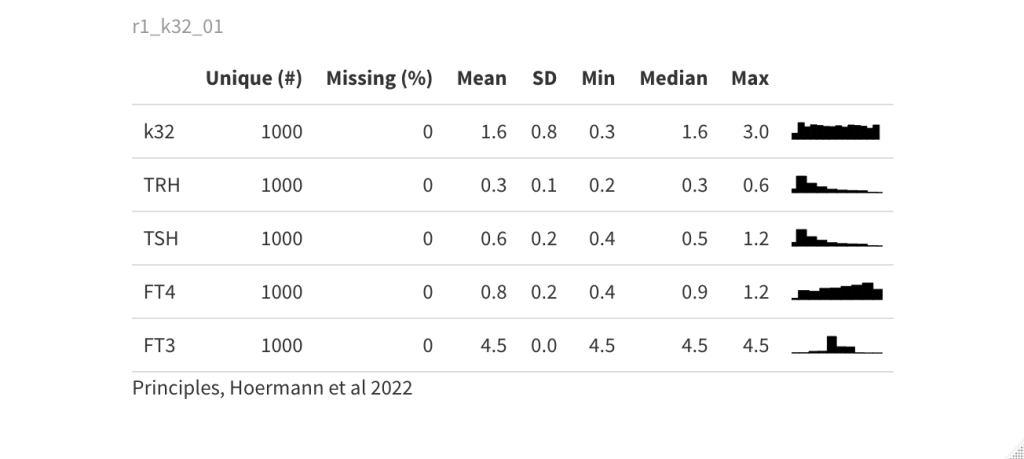
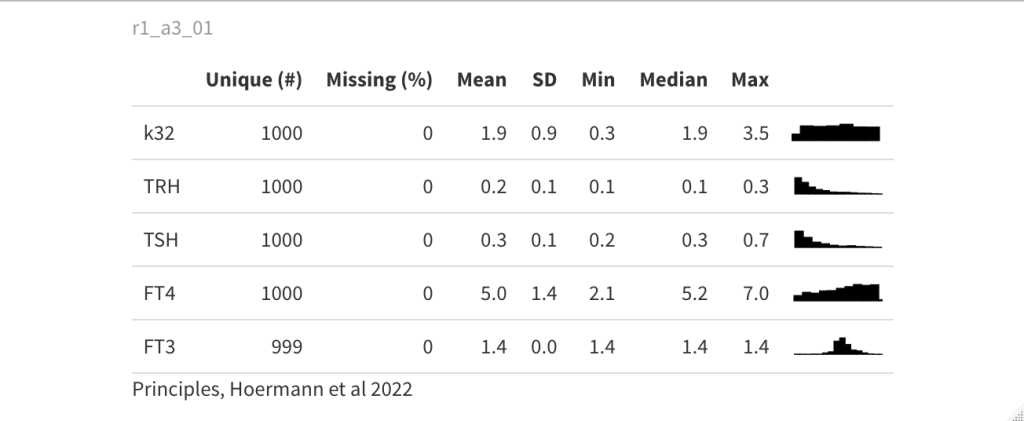
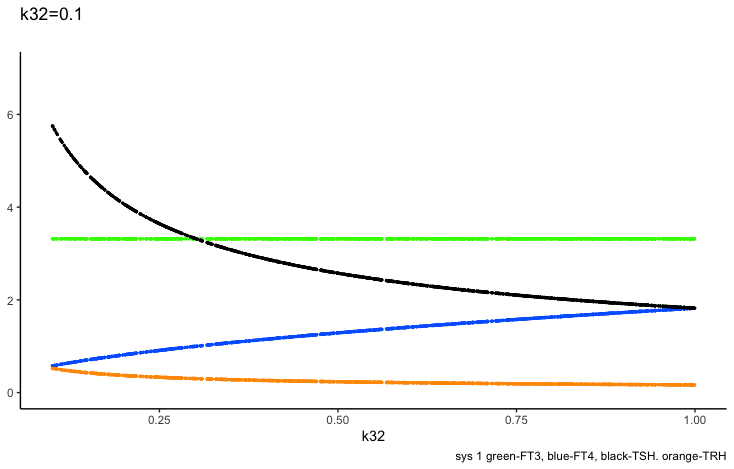
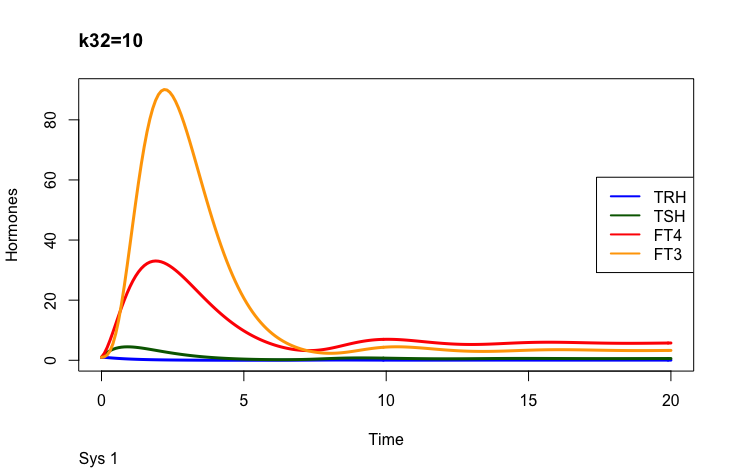
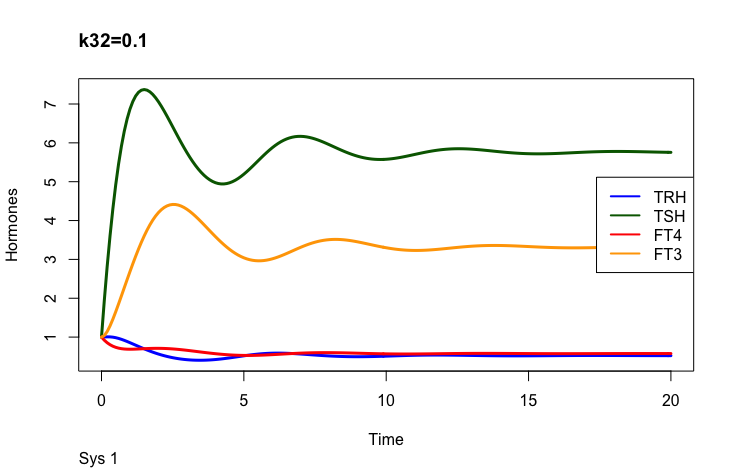
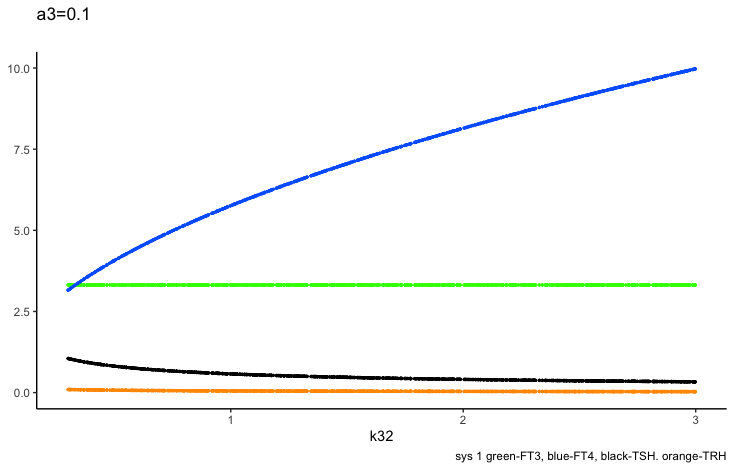
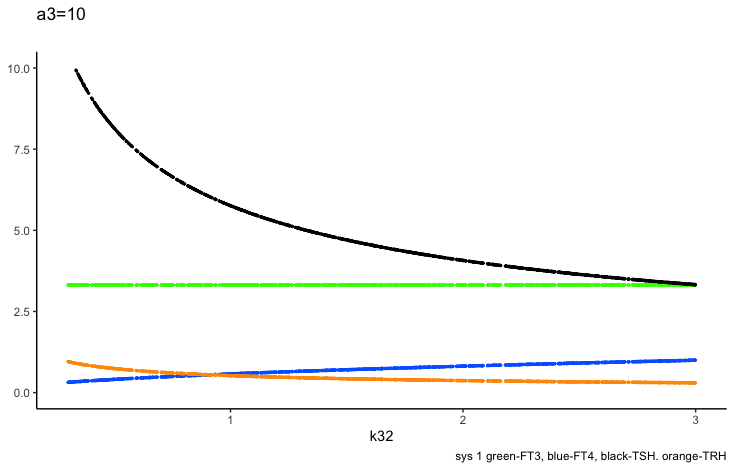
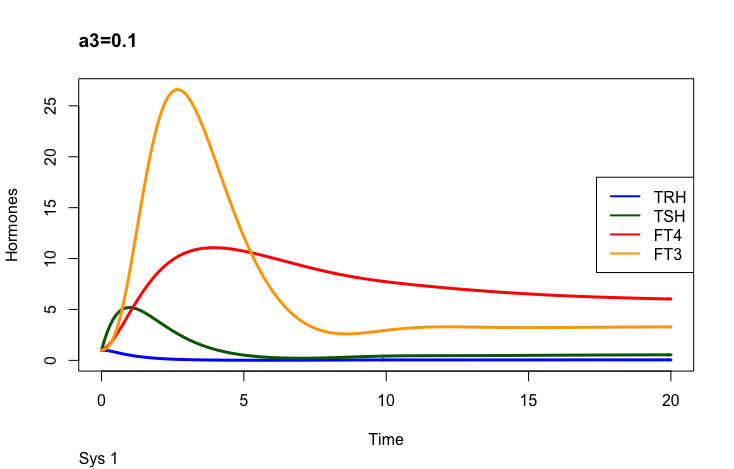
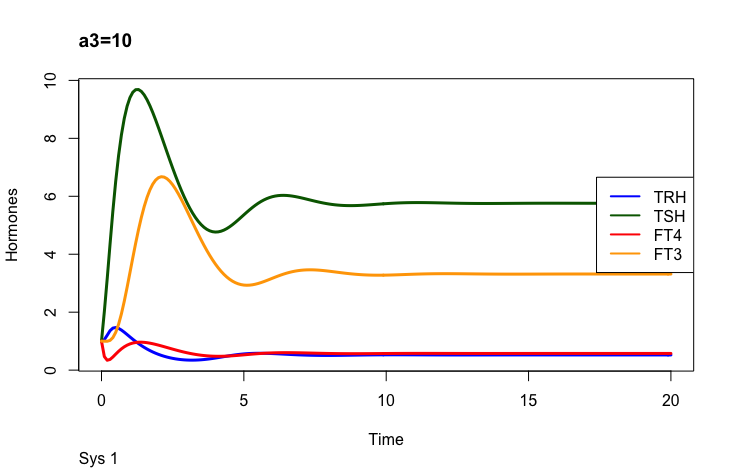
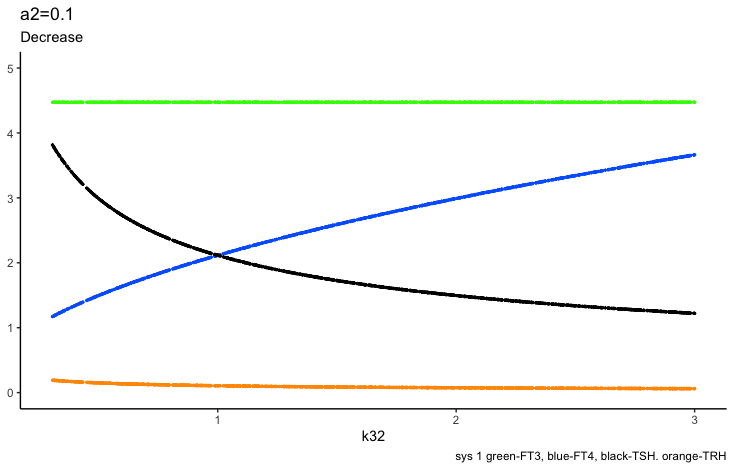
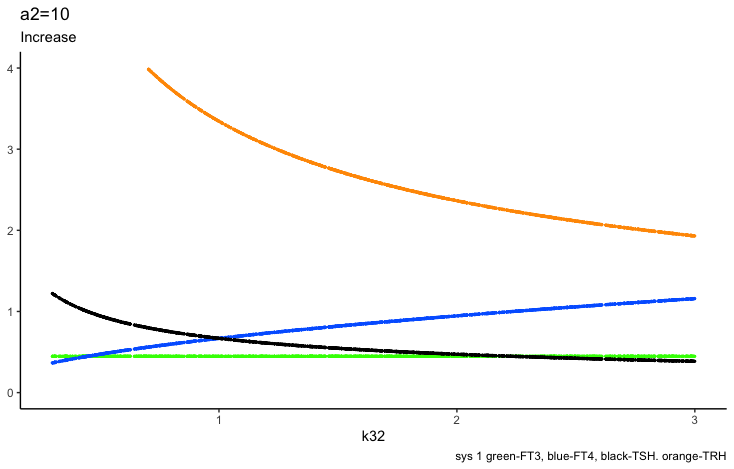
In the mathematical model (Ref. 1) two parameters may change the outcome of FT4: k32 – positive feedforward of TSH onto FT4 (downstream, activating) and a 3 – the FT4 elimination rate constant.
Sense?
Only examples of the effect of the parameter –
Hoermann R, Pekker MJ, Midgley JEM, Larisch R and Dietrich JW (2022) Principles of Endocrine Regulation: Reconciling Tensions Between Robustness in Performance and Adaptation to Change. Front. Endocrinol. 13:825107. doi: 10.3389/fendo.2022.825107 https://www.frontiersin.org/articles/10.3389/fendo.2022.825107/full
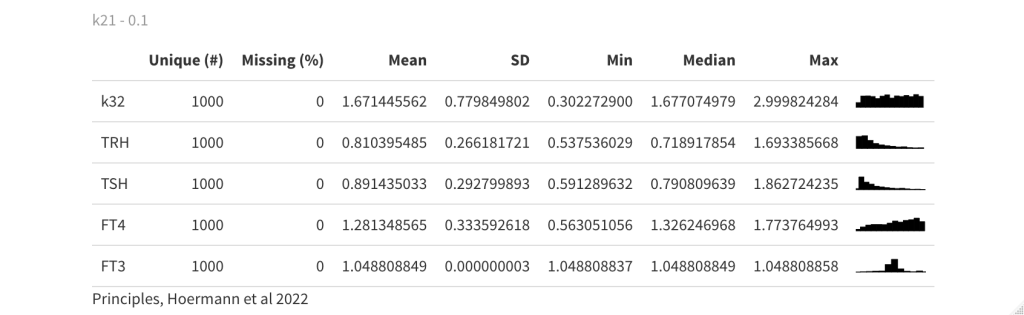
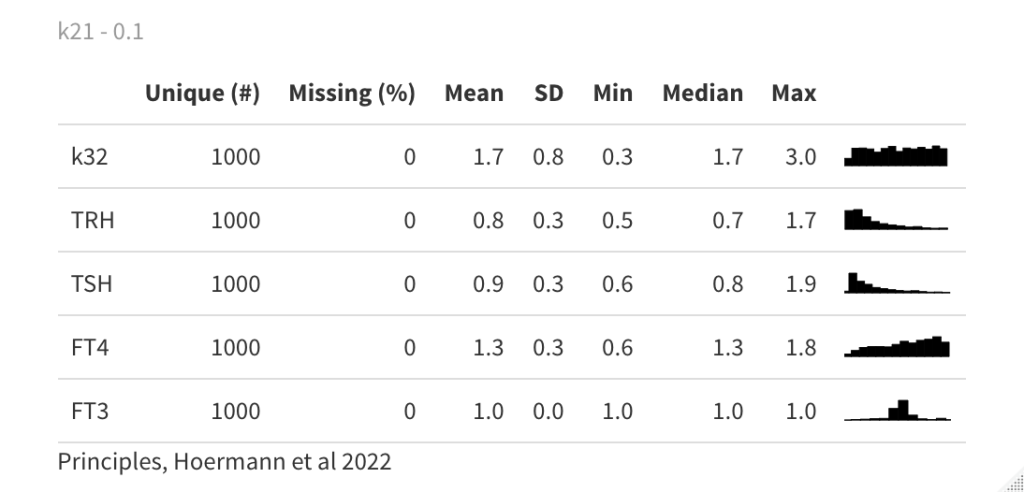
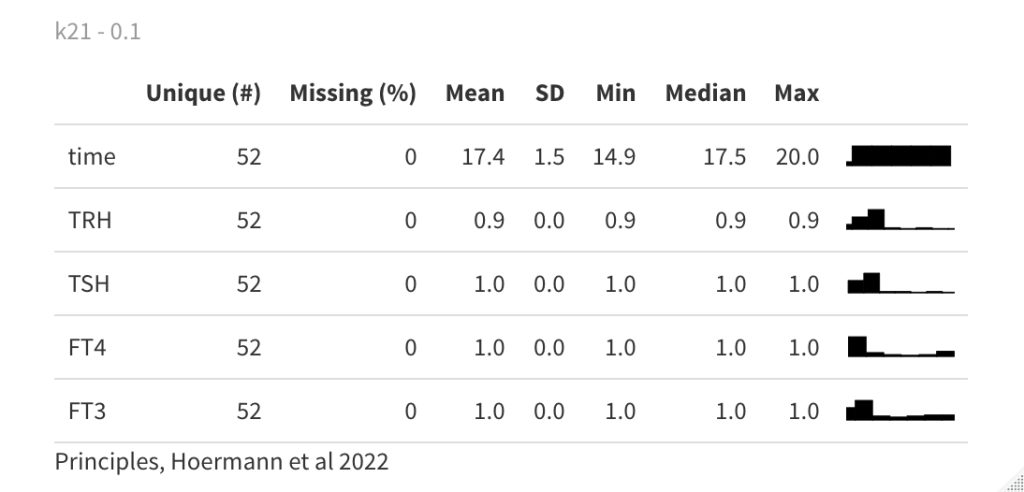
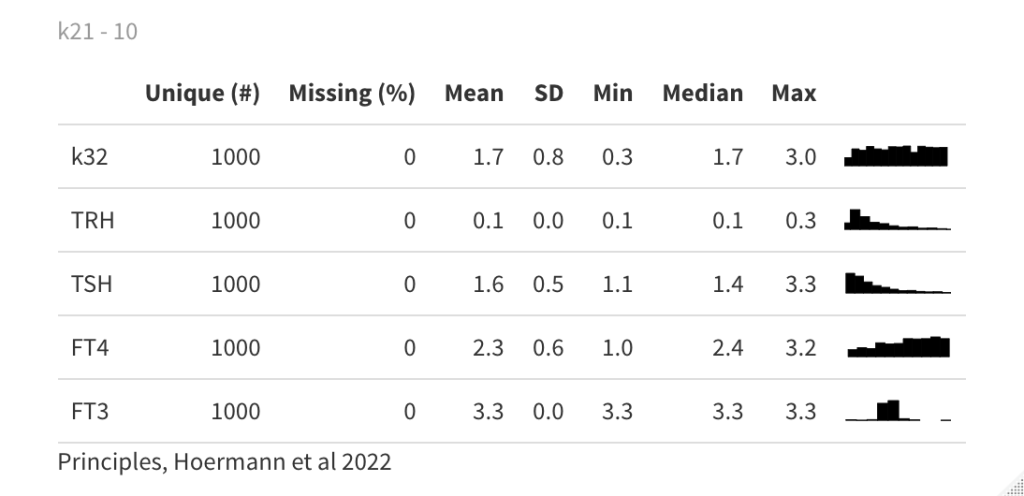
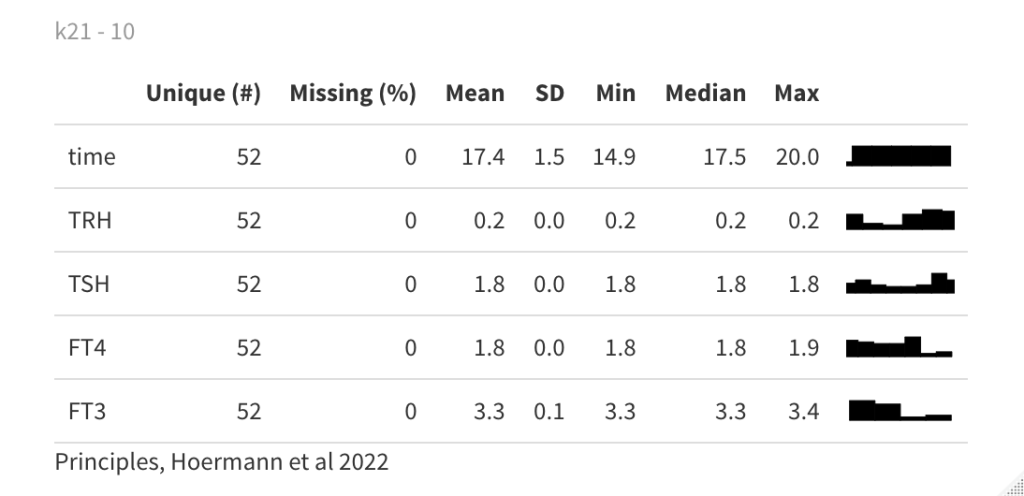
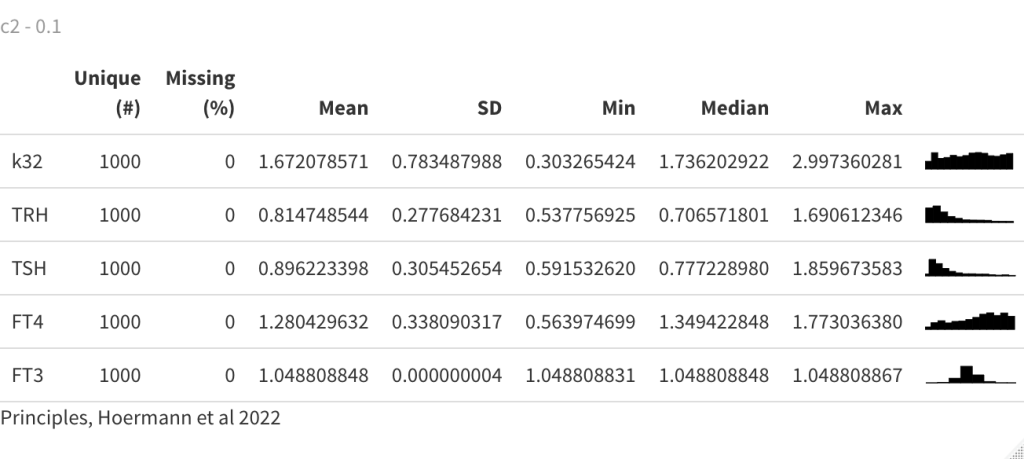
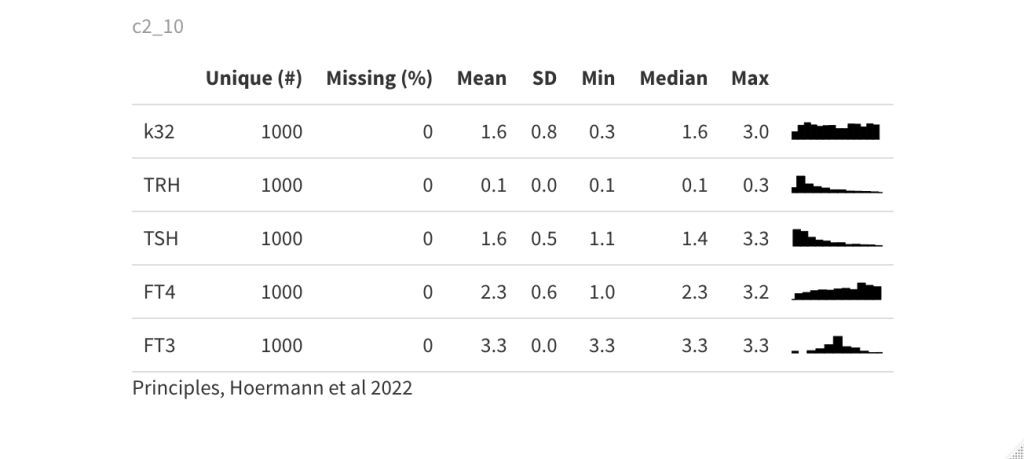
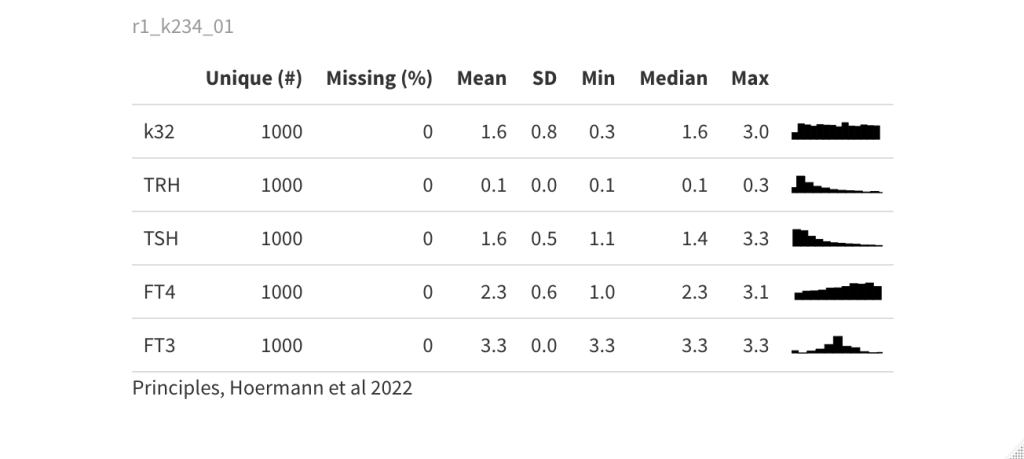
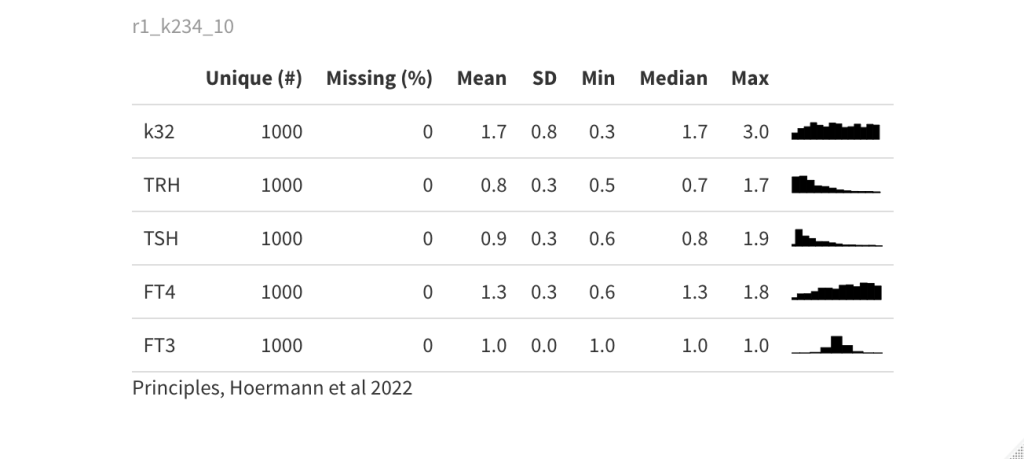
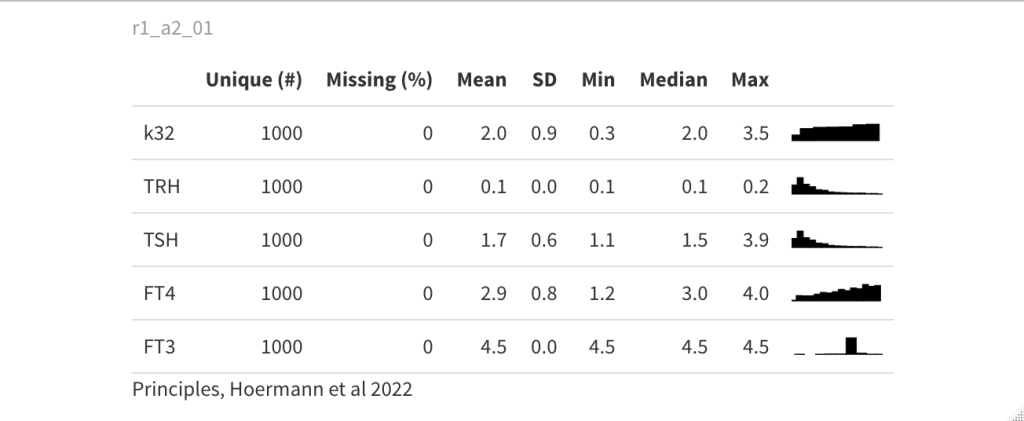
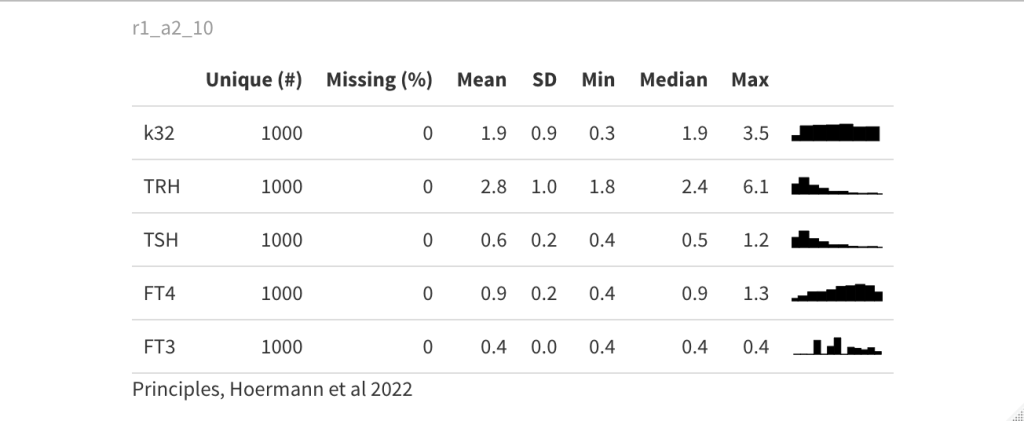
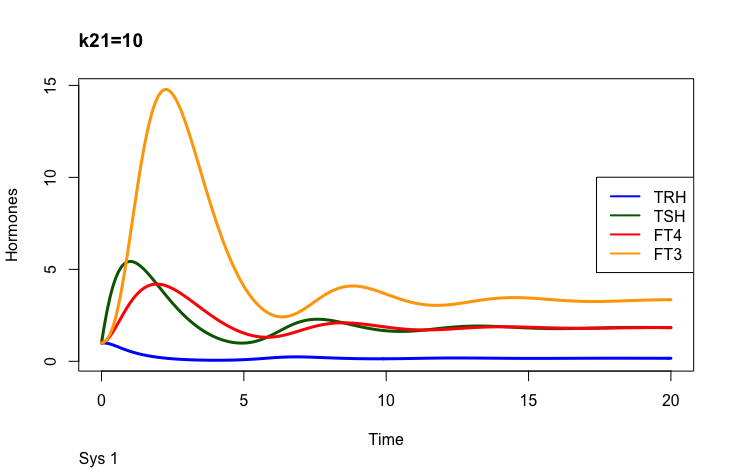
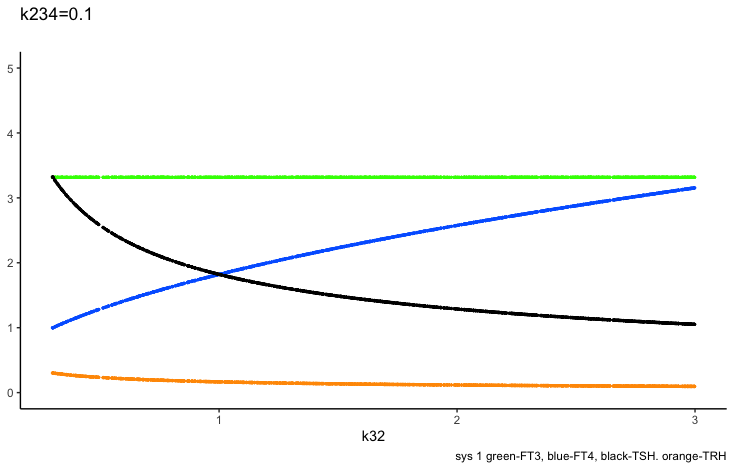
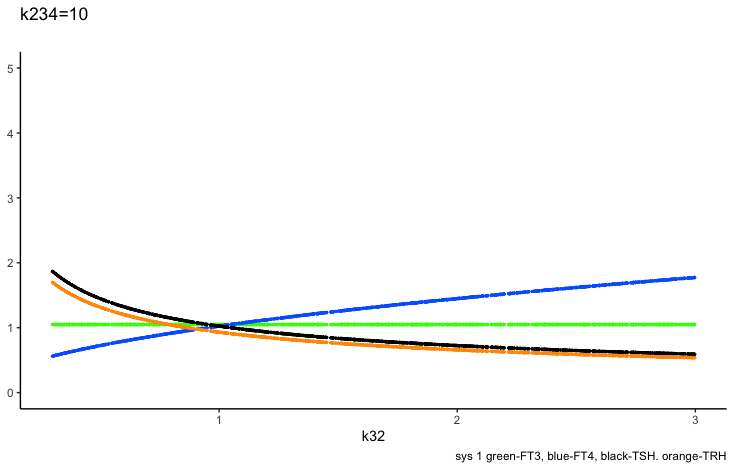
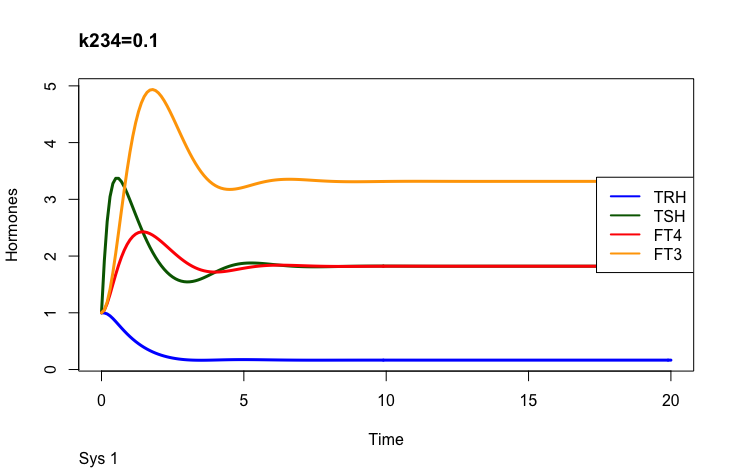
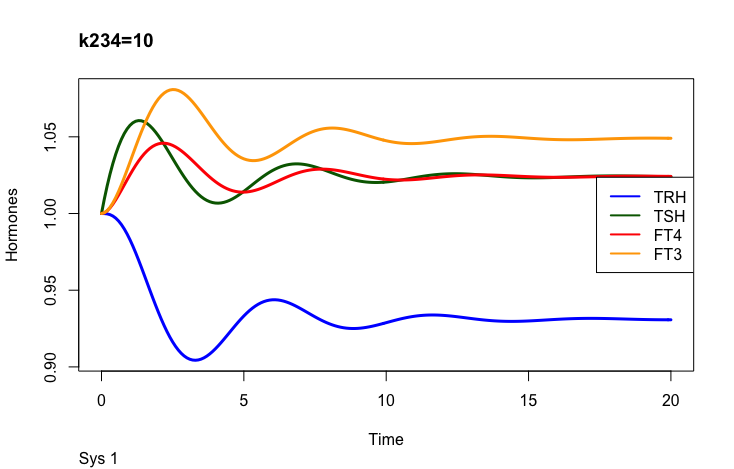
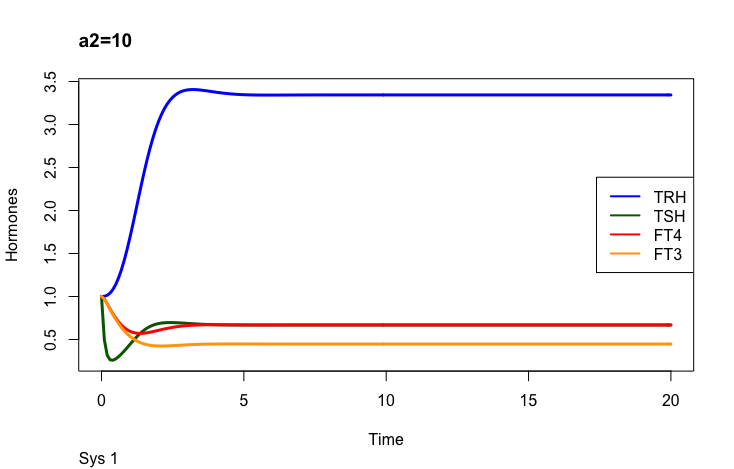
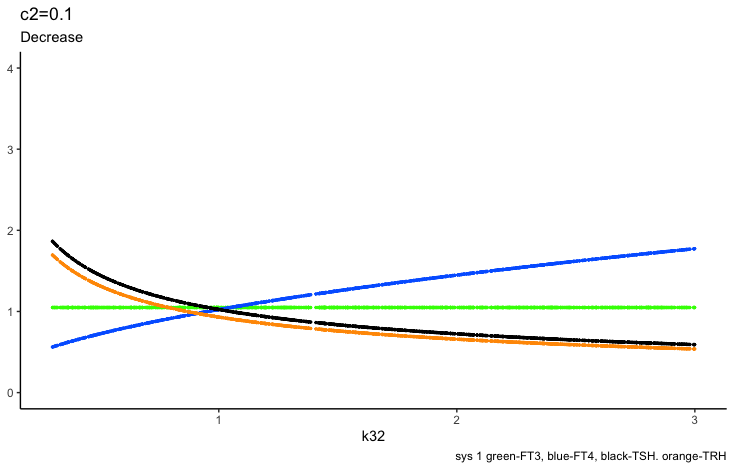
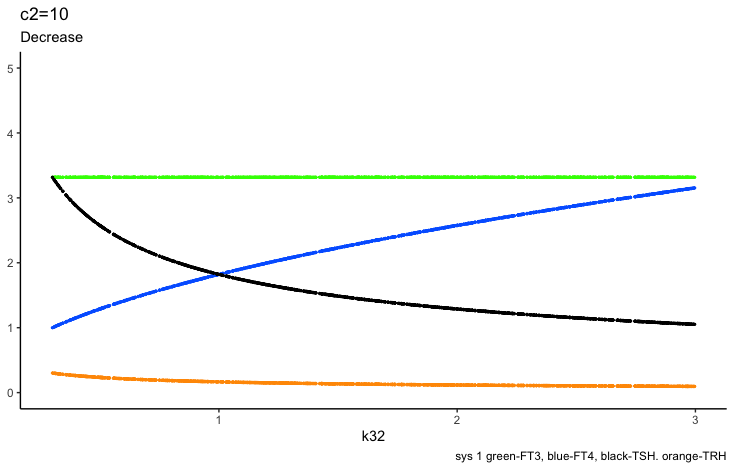
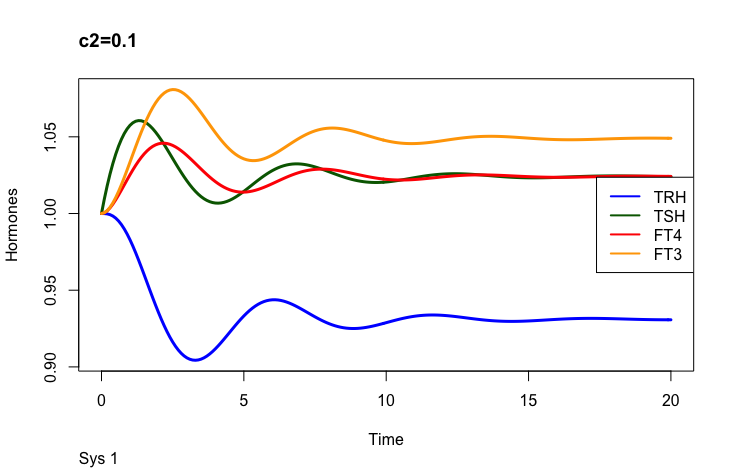
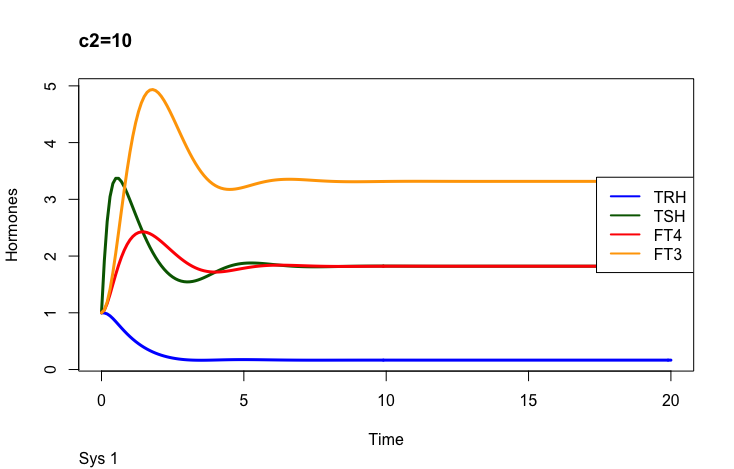
Four parameters regulate TSH (in the mathematical model (ref.1)): k21 – (positive feedforward of TRH onto TSH (downstream, activating)), c2 – (the secretory capacity constant), k234 -negative feedback of FT4 and FT3 onto TSH (upstream, repressing) and a2 – (the TSH elimination rate constant.).
Be aware that the colours for the hormones are different in the rows below.
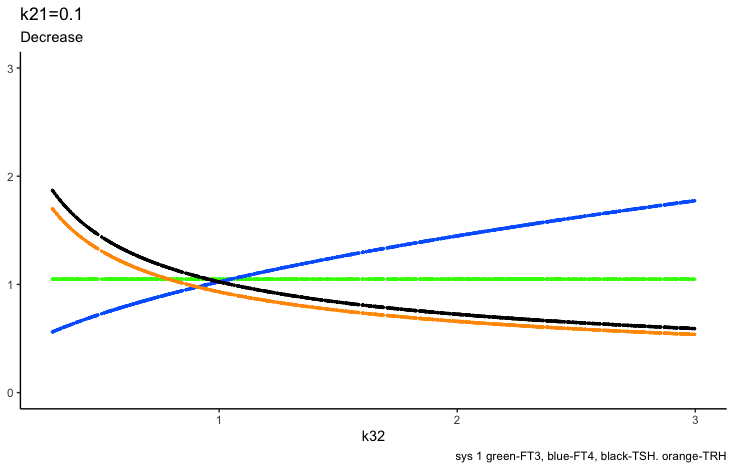
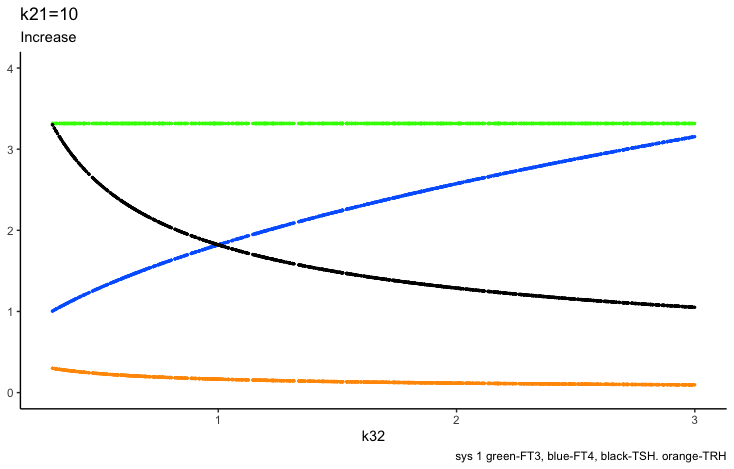
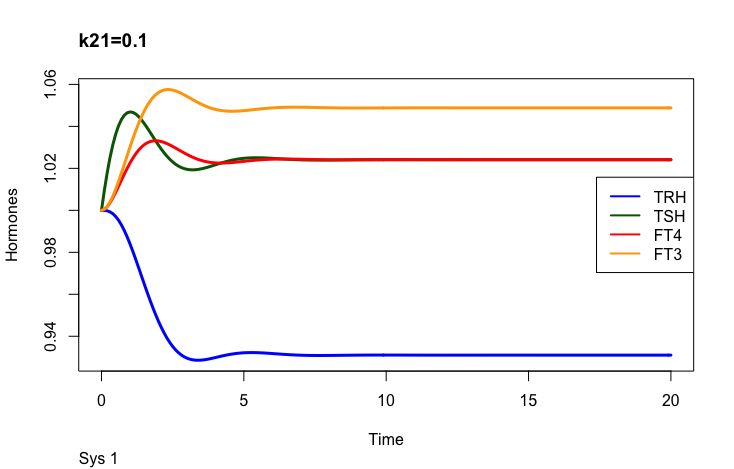
Positive feedforward of TRH onto TSH (downstream, activating)):
Level compared to the equilibrium calculation
Negative feedback of FT4 and FT3 onto TSH (upstream, repressing)
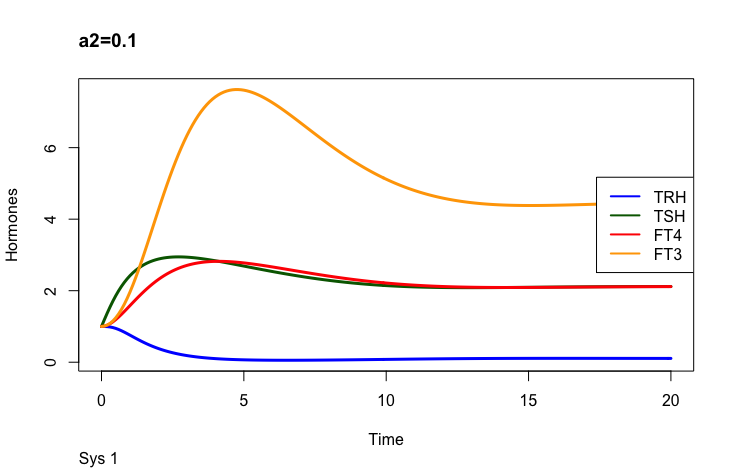
The TSH elimination rate constant.
The secretory capacity constant
Only examples of the effect of the parameter –
Hoermann R, Pekker MJ, Midgley JEM, Larisch R and Dietrich JW (2022) Principles of Endocrine Regulation: Reconciling Tensions Between Robustness in Performance and Adaptation to Change. Front. Endocrinol. 13:825107. doi: 10.3389/fendo.2022.825107 https://www.frontiersin.org/articles/10.3389/fendo.2022.825107/full
Hoerman et al (Ref.1) have developed a mathematical model with 14 different parameters that influence the HPT axis (hypothalamus – pituitary – thyroid axis). I will describe the effects in the following.
There are different parameters which can change the hormones in this mathematical model.
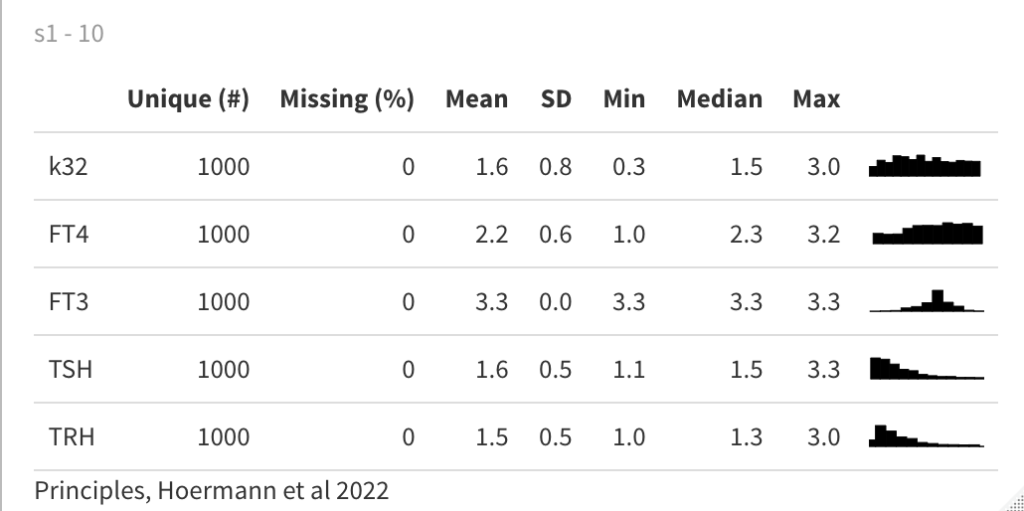
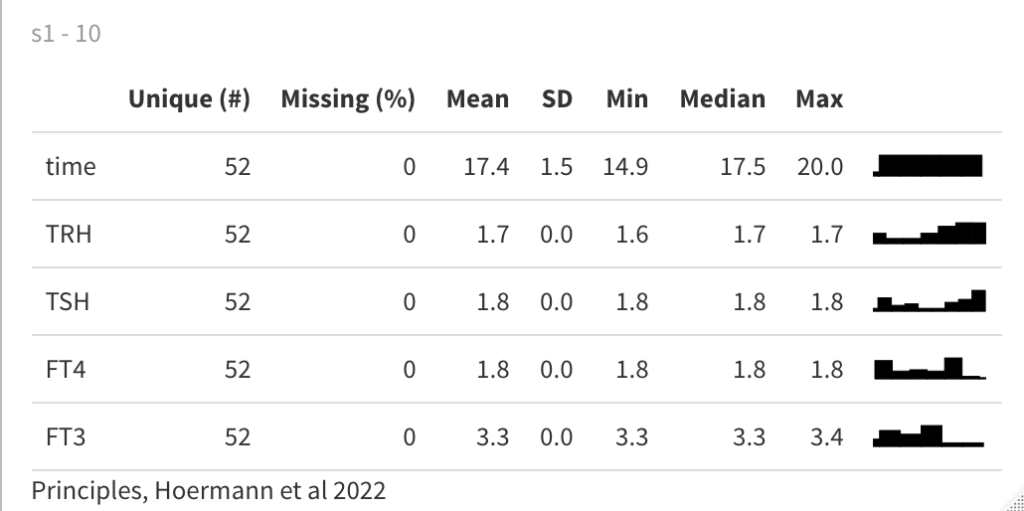
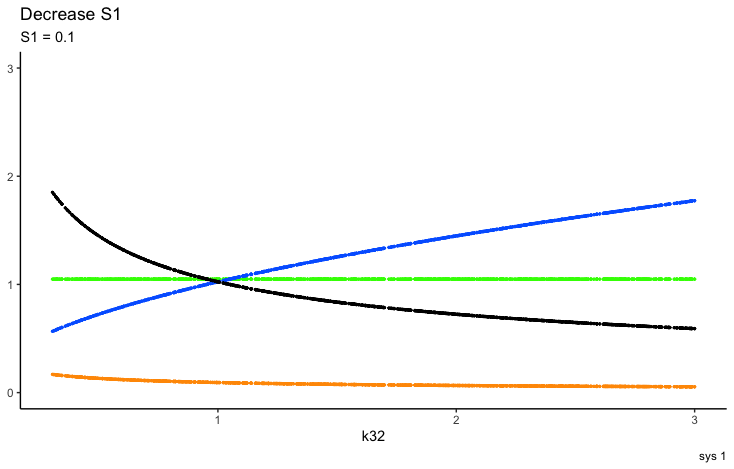
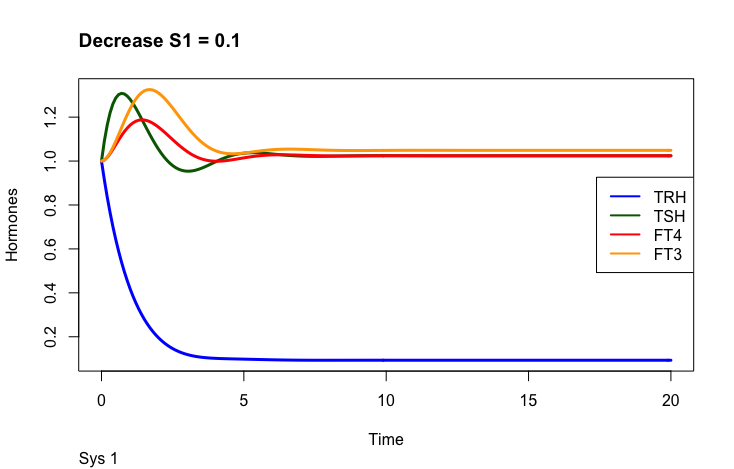
S1 is an input signal with an effect on TRH. As seen in the description above, changes in S1 affect the other hormones as well. The article describes how this knowledge can be used in combination with different parameters.
The first part of the above presentation describes the three different equilibrium solutions for s1=1, 0.1 and 10 and the second part describes the time-dependent solution.
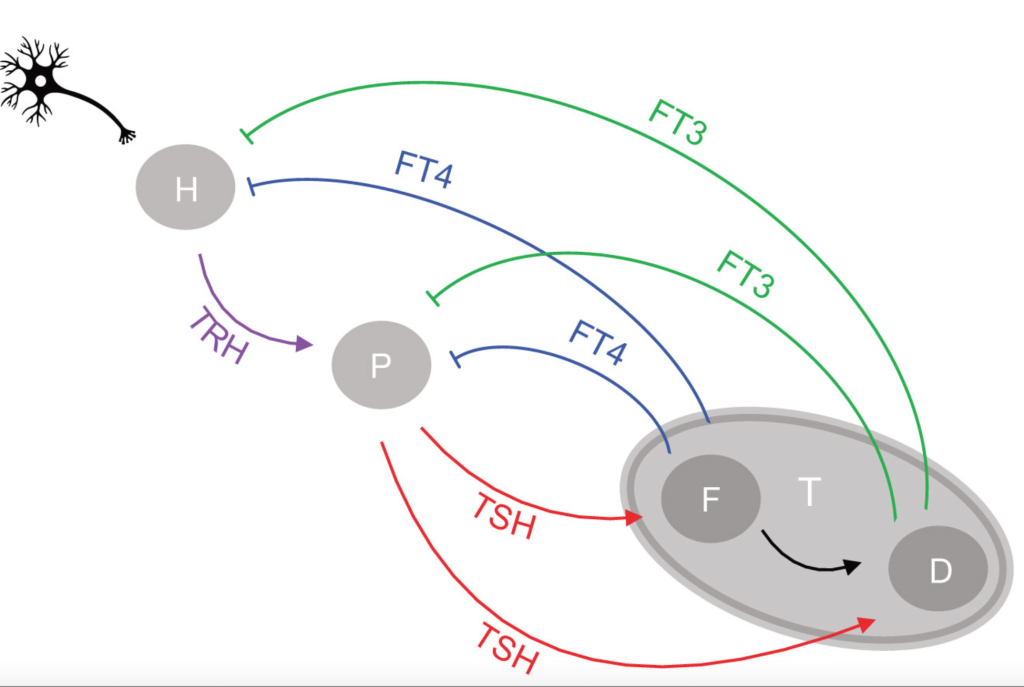
You need not be good at mathematics to see the connection between the used equations and the conceptual drawing of the HPT axis (Ref.1). What is important is the complexity – and flexibility compared to a fixed TSH value as the understanding of the HPT axis.
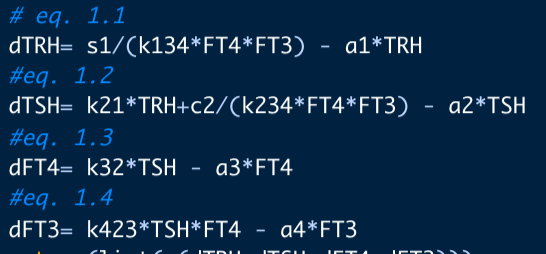
Overview of the four equationsFig.1 from ref.1 : Network of the hypothalamic-pituitary-thyroid axis regulation
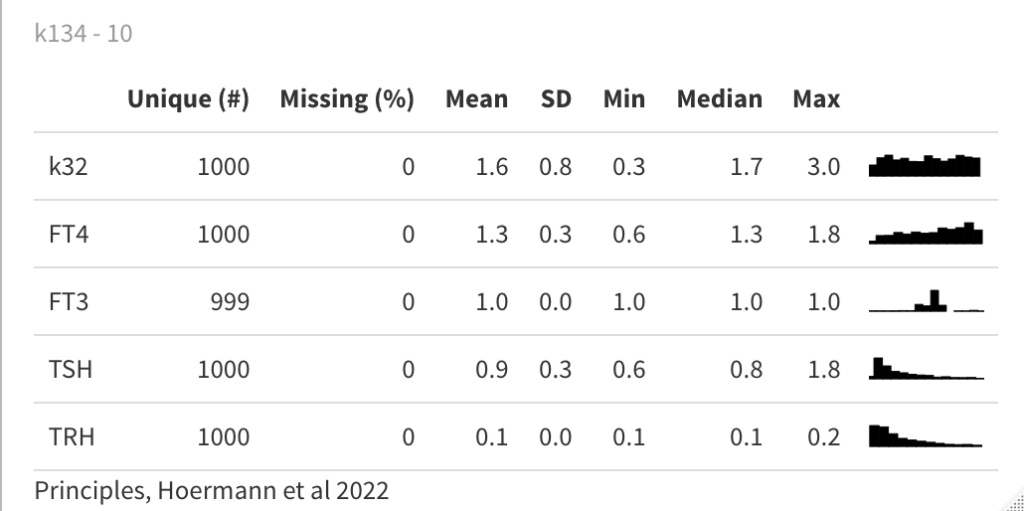
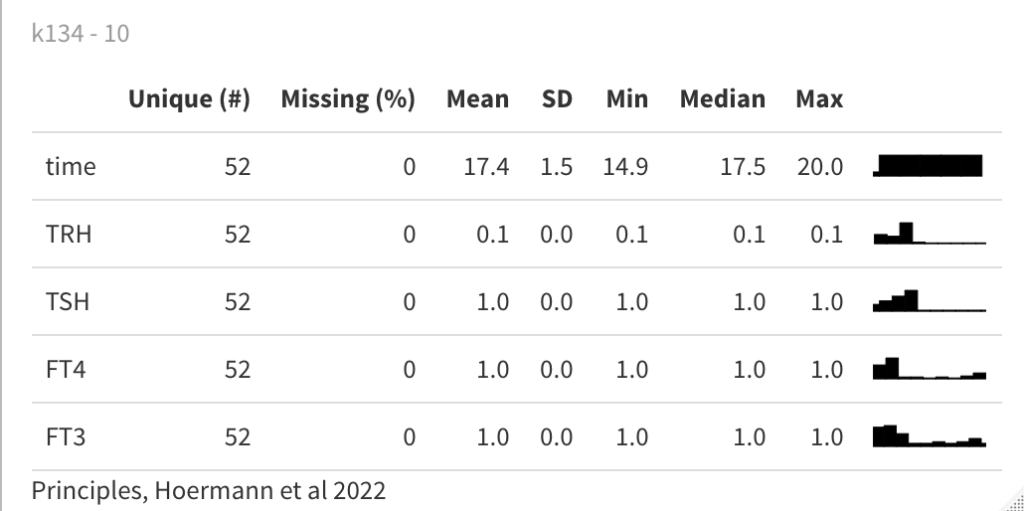
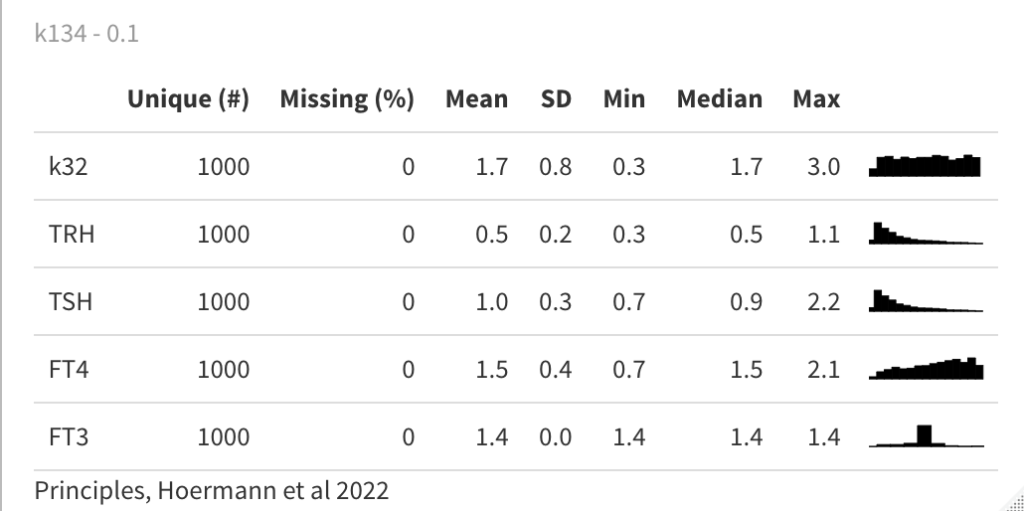
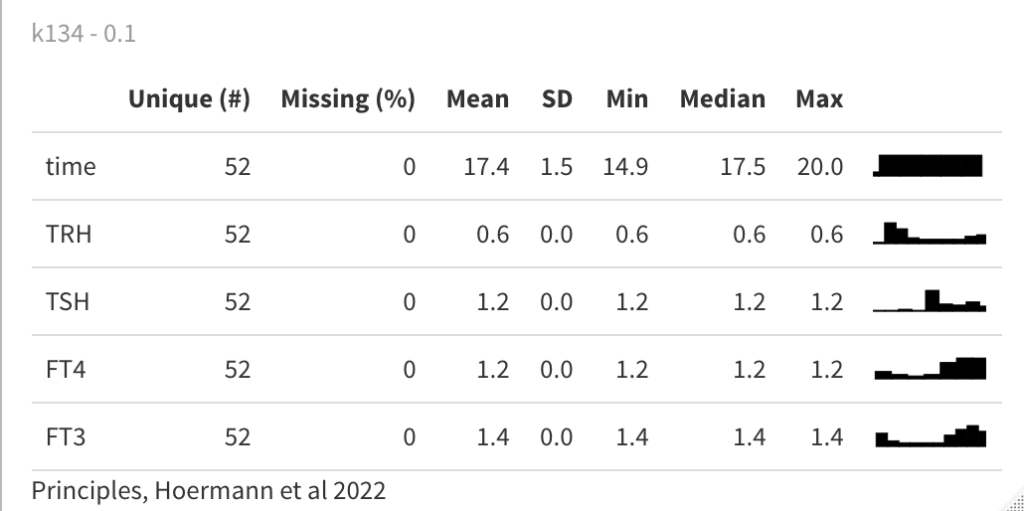
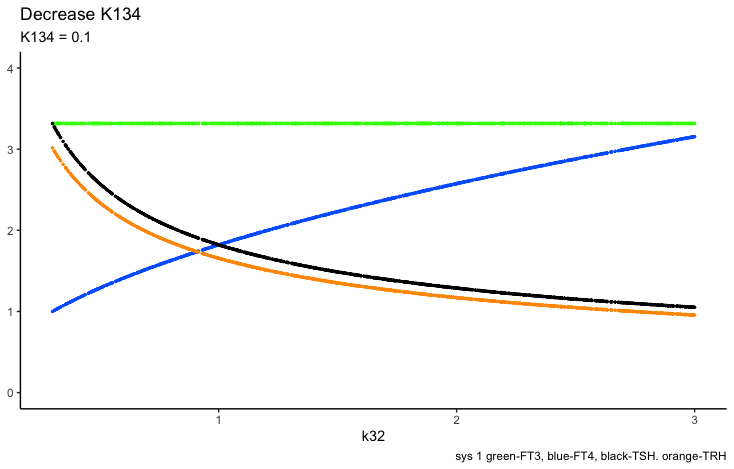
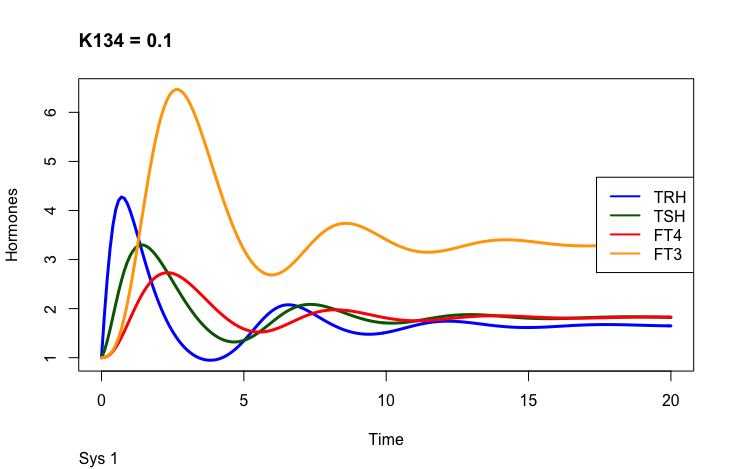
The first part of the second presentation describes the three different equilibrium solutions for k134 =1, 0.1 and 10 and the second part describes the time-dependent solution.
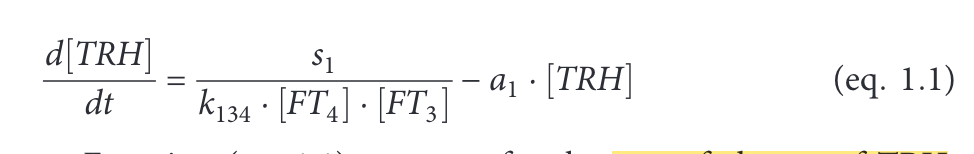
This is theoretical and only serves as an example of how the hormones are changed by the parameter. K134 is the negative feedback of FT4 and FT3 onto TRH (upstream, repressing).
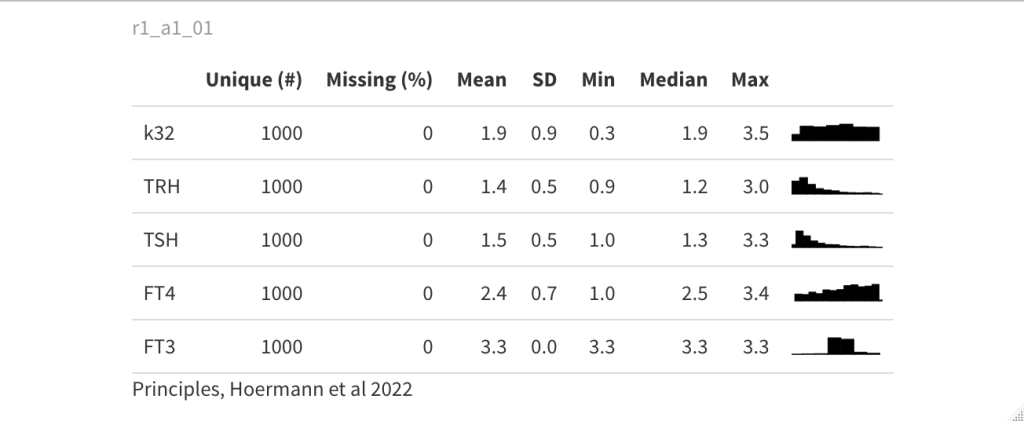
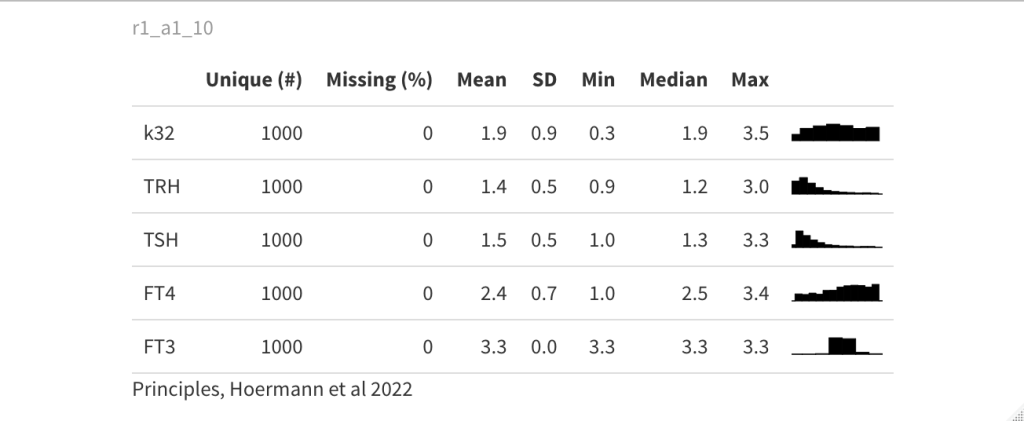
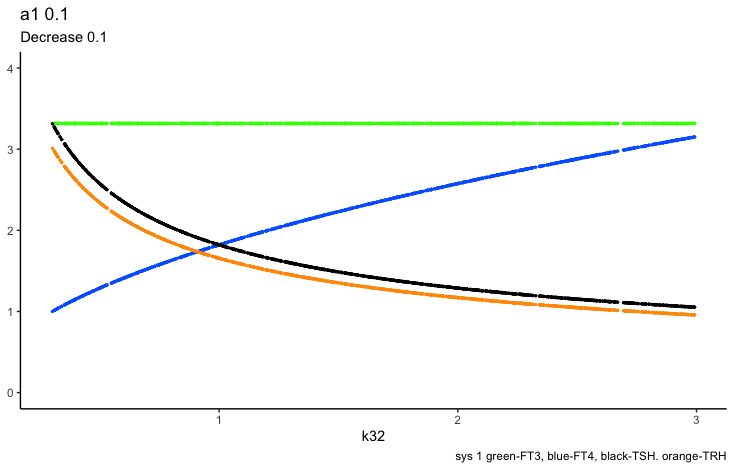
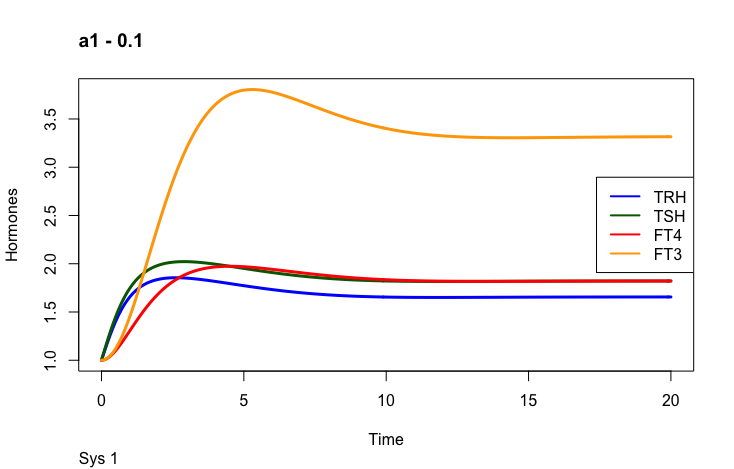
Finally the a1 parameter ( a1 is the TRH elimination rate constant):
a1 parameter
Look at equation 1.1:
We have looked at the effects of s1, k134 and a1 on TRH and the other hormones.
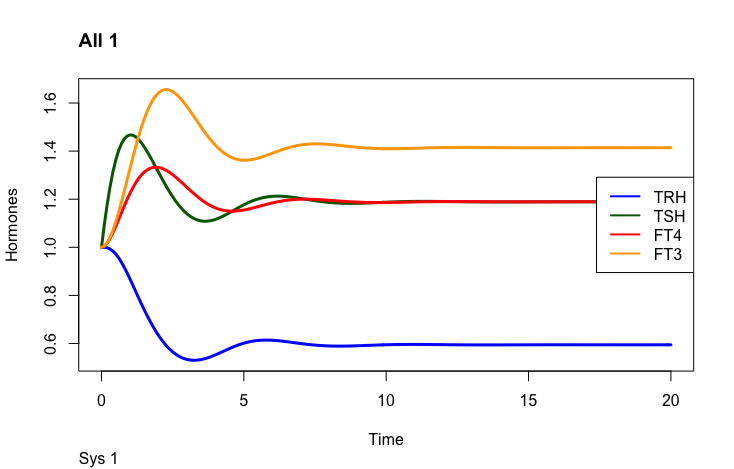
One thing to observe is the FT3 and FT4 curves. In the plot left is shown what the authors call “The perfect homeostasis”. Here the two curves follow each other with a certain distance. In the plots above this pattern is disrupted. We will get back to these observations later.
Hoermann R, Pekker MJ, Midgley JEM, Larisch R and Dietrich JW (2022) Principles of Endocrine Regulation: Reconciling Tensions Between Robustness in Performance and Adaptation to Change. Front. Endocrinol. 13:825107. doi: 10.3389/fendo.2022.825107 https://www.frontiersin.org/articles/10.3389/fendo.2022.825107/full


 Hoermann R, Pekker MJ, Midgley JEM, Larisch R and Dietrich JW (2022) Principles of Endocrine Regulation: Reconciling Tensions Between Robustness in Performance and Adaptation to Change. Front. Endocrinol. 13:825107. doi: 10.3389/fendo.2022.825107