Pilo 1 and 10

Observations from the Pilo scenarios
The figures are derived from Simthyr – based on the laboratory values for the persons in the Pilo study(1). The figures mimic what may be seen in humans with this condition.

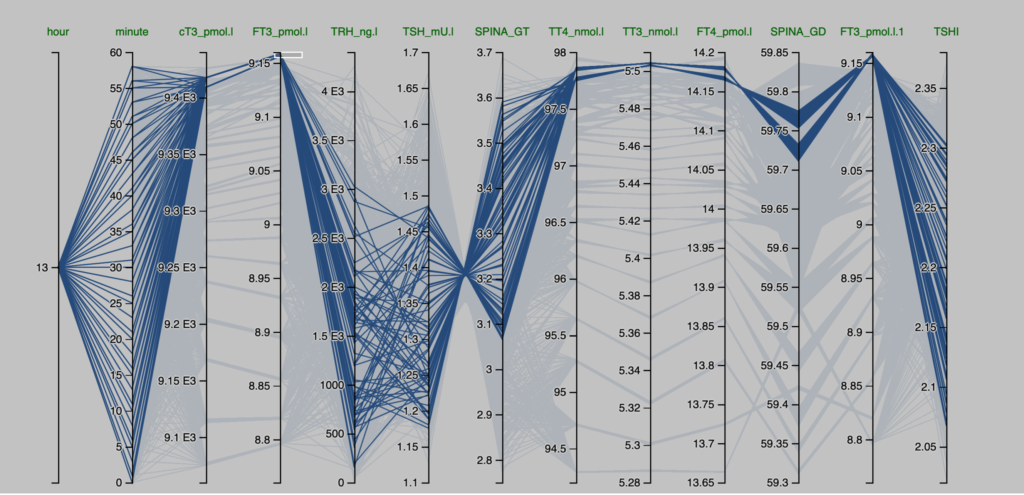
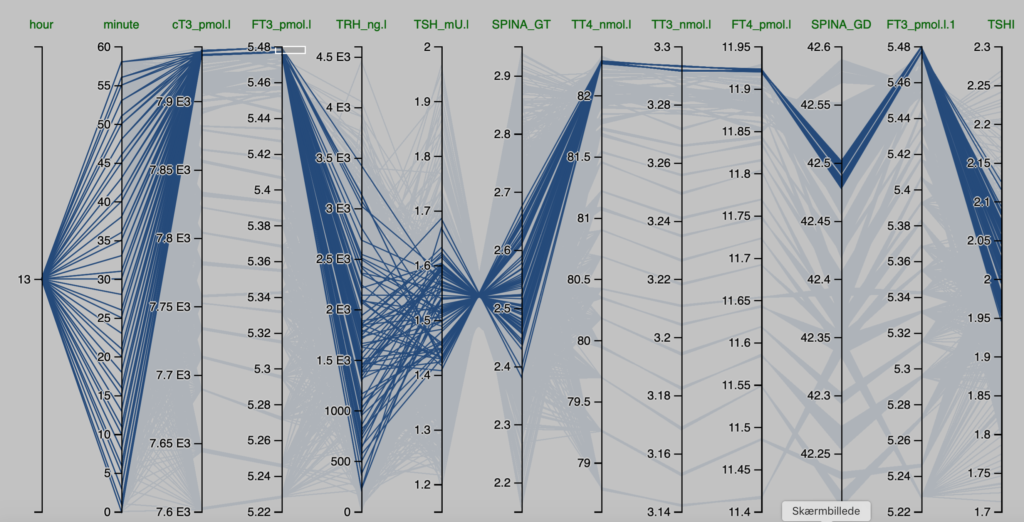
Pilo 1 (showing slight hyperdeiodination and high conversion rate)Pilo 10 (with normal values for SPINA-GT and SPINA-GD)
These are the figures entered into SimThyr, as can be seen, these values are changed:
GH, LS, SS, GT, GD1
These are the figures entered into SimThyr, as can be seen, these values are changed:
LS, GT, GD1
alphaR = 0.4

betaR = 0.0023105

GR = 1

dR = 1E-10

alphaS = 0.4

betaS = 0.00023

alphaS2 = 260000

betaS2 = 140

GH = 450

dH = 4.7E-8

LS = 3600000

SS = 130

DS = 50

alphaT = 0.1

betaT = 1.1E-6

GT = 3.25E-12

dT = 2.75

alpha31 = 0.026

beta31 = 8E-6

GD1 = 4.698E-8

KM1 = 5E-7

alpha32 = 130000

beta32 = 0.00083

GD2 = 4.3E-15

KM2 = 1E-9

K30 = 2000000000

K31 = 2000000000

K41 = 20000000000

K42 = 200000000

Tau0R = 1800

Tau0S = 120

Tau0S2 = 3240

Tau0T = 300

Tau03z = 3600
alphaR = 0.4

betaR = 0.0023105


GR = 1


dR = 1E-10


alphaS = 0.4


betaS = 0.00023


alphaS2 = 260000


betaS2 = 140


GH = 471.85

dH = 4.7E-8

LS = 2500000 (std:1.6879E6)

SS = 100

DS = 50

alphaT = 0.1

betaT = 1.1E-6

GT = 2.22E-12 (std:3.375-12)

dT = 2.75

alpha31 = 0.026

beta31 = 8E-6

GD1 = 3.188E-8 (std: 2.8E-8)

KM1 = 5E-7

alpha32 = 130000

beta32 = 0.00083

GD2 = 4.3E-15

KM2 = 1E-9

K30 = 2000000000

K31 = 2000000000

K41 = 20000000000

K42 = 200000000

Tau0R = 1800

Tau0S = 120

Tau0S2 = 3240

Tau0T = 300

Tau03z = 3600
HeaderPilo 1
xFT3_pmol.l
yTSHI
result_typepredictive power score
pps0.0399161481951055
metricMAE
baseline_score0.228599683756024
model_score0.219471509560077
cv_folds5
seed1
algorithmtree
model_typeregression
HeaderPilo 10
xFT3_pmol.l
yTSHI
result_typepredictive power score
pps0.074013572098316
metricMAE
baseline_score0.229021692772779
model_score0.212073708605622
cv_folds5
seed1
algorithmtree
model_typeregression
TRH_ng.lFT3_pmol.l
pps0.00999382
TRH_ng.lTSH_mU.l
pps0.241326
SPINA_GTTSH_mU.l
pps0.820709
SPINA_GTTT4_nmol.l
pps3.4861e-15
TT3_nmol.lTT4_nmol.l
pps0.734311
TT3_nmol.lFT4_pmol.l
pps0.7343158
SPINA_GDFT4_pmol.l
pps0.2388143
SPINA_GDFT3_pmol.l
pps0.1478555
TSHIFT3_pmol.l
pps0.03991615

More information on the Pilo 1 scenario

FT3_pmol.lTRH_ng.l
pps0.02436586
TRH_ng.lTSH_mU.l
pps0.2460819
SPINA_GTTSH_mU.l
pps0.8224402
SPINA_GTTT4_nmol.l
pps7.704948e-15
TT3_nmol.lTT4_nmol.l
pps0.7880723
TT3_nmol.lFT4_pmol.l
pps0.7880051
SPINA_GDFT4_pmol.l
pps0.3212973
SPINA_GDFT3_pmol.l
pps0.1749449
TSHIFT3_pmol.l
pps0.07401357

More information on the Pilo 10 scenario

  1. 1. Pilo A, Iervasi G, Vitek F, Ferdeghini M, Cazzuola F, Bianchi R. Thyroidal and peripheral production of 3,5,3′-triiodothyronine in humans by multicompartmental analysis. Am J Physiol. 1990 Apr;258(4 Pt 1):E715-26. PubMed PMID: 2333963.

Pilo 10 – DataExplorer

Data Profiling Report

Basic Statistics

Raw Counts

Name Value
Rows 47,520
Columns 12
Discrete columns 0
Continuous columns 12
All missing columns 0
Missing observations 0
Complete Rows 47,520
Total observations 570,240
Memory allocation 4.4 Mb

Percentages

Data Structure

Missing Data Profile

Univariate Distribution

Histogram

QQ Plot

Correlation Analysis

Principal Component Analysis

Pilo 1 – DataExplorer

Data Profiling Report

Basic Statistics

Raw Counts

Name Value
Rows 47,520
Columns 12
Discrete columns 1
Continuous columns 11
All missing columns 0
Missing observations 0
Complete Rows 47,520
Total observations 570,240
Memory allocation 4.4 Mb

Percentages

Data Structure

Missing Data Profile

Univariate Distribution

Histogram

Bar Chart (with frequency)

QQ Plot

Correlation Analysis

## Warning in dummify(data, maxcat = maxcat): Ignored all discrete features since `maxcat`
## set to 20 categories!

Principal Component Analysis

Pilo 2 and 6 further information

Observations from the Pilo scenarios
The figures are derived from Simthyr – based on the laboratory values for the persons in the Pilo study(1). The figures mimic what may be seen in humans with this condition.

Pilo 6 (with low secretion rate for T4)
Pilo 2 (showing slight hyperdeiodination)
These are the figures entered into SimThyr, as can be seen two values are changed:
GT – thyroid activity and GD – deiodinase activity
These are the figures entered into SimThyr, as can be seen two values are changed:
GT – thyroid activity and GD – deiodinase activity
alphaR
0.4
betaR
0.0023105
GR
1
dR
1E-10
alphaS
0.4
betaS
0.00023
alphaS2
260000
betaS2
140
GH
471.85
dH
4.7E-8
LS
3400000
SS
110
DS
50
alphaT
0.1
betaT
1.1E-6
GT
2.44E-12 (standard value 3.375E-12)

dT
2.75
alpha31
0.026
beta31
8E-6
GD1
4.263E-8 (standard value 2.8E-8)

KM1
5E-7
alpha32
130000
beta32
0.00083
GD2
4.3E-15
KM2
1E-9
K30
2000000000
K31
2000000000
K41
20000000000
K42
200000000
Tau0R
1800
Tau0S
120
Tau0S2
3240
Tau0T
300
Tau03z
3600
alphaR
0.4
betaR
0.0023105
GR
1
dR
1E-10
alphaS
0.4
betaS
0.00023
alphaS2
260000
betaS2
140
GH
471.85
dH
4.7E-8
LS
3400000
SS
100
DS
50
alphaT
0.1
betaT
1.1E-6
GT
3.04E-12
dT
2.75
alpha31
0.026
beta31
8E-6
GD1
5.99E-8

KM1
5E-7
alpha32
130000
beta32
0.00083
GD2
4.3E-15
KM2
1E-9
K30
2000000000
K31
2000000000
K41
20000000000
K42
200000000
Tau0R
1800
Tau0S
120
Tau0S2
3240
Tau0T
300
Tau03z
3600
HeaderPilo 6
xFT3_pmol.l
ycT3_pmol.l
result_typepredictive power score
pps0.70645161743448
metricMAE
baseline_score57.7740090792993
model_score16.9589086283796
cv_folds5
seed1
algorithmtree
model_typeregression
TRH_ng.lFT3_pmol.l
pps0.0201538424398612
TRH_ng.lTSH_mU.l
pps0.24198856824132
SPINA_GTTSH_mU.l
pps0.853016404129762
SPINA_GTTT4_nmol.l
pps0
TT3_nmol.lTT4_nmol.l
pps0.786492953457281
TT3_nmol.lFT4_pmol.l
pps0.7864154128002
SPINA_GDFT4_pmol.l
pps0.361281910084329
SPINA_GDFT3_pmol.l
pps0.150538809123081
TSHIFT3_pmol.l
pps0.0817507329667389

More information on the Pilo 6 scenario

HeaderPilo 2
xcT3_pmol.l
yFT3_pmol.l
result_typepredictive power score
pps0.721086815385527
metricMAE
baseline_score0.0649955790187846
model_score0.0181290998271268
cv_folds5
seed1
algorithmtree
model_typeregression
FT3_pmol.lTRH_ng.l
pps0.0158420628677205
TRH_ng.lTSH_mU.l
pps0.245993069890075
SPINA_GTTSH_mU.l
pps0.818806003676958
SPINA_GTTT4_nmol.l
pps9.1038e-16
TT3_nmol.lTT4_nmol.l
pps0.698920862701658
TT3_nmol.lFT4_pmol.l
pps0.698799304223429
SPINA_GDFT4_pmol.l
pps0.285240272027388
SPINA_GDFT3_pmol.l
pps0.124850236180727
TSHIFT3_pmol.l
pps0.0930791220487382

More information on the Pilo 2 scenario

  1. 1. Pilo A, Iervasi G, Vitek F, Ferdeghini M, Cazzuola F, Bianchi R. Thyroidal and peripheral production of 3,5,3′-triiodothyronine in humans by multicompartmental analysis. Am J Physiol. 1990 Apr;258(4 Pt 1):E715-26. PubMed PMID: 2333963.

Pilo 6 – DataExplorer

Data Profiling Report

Basic Statistics

Raw Counts

Name Value
Rows 47,520
Columns 11
Discrete columns 0
Continuous columns 11
All missing columns 0
Missing observations 0
Complete Rows 47,520
Total observations 522,720
Memory allocation 4 Mb

Percentages

Data Structure

Missing Data Profile

Univariate Distribution

Histogram

QQ Plot

Correlation Analysis

Principal Component Analysis

Q-Q plot – explanation: https://stats.stackexchange.com/questions/101274/how-to-interpret-a-qq-plot

Pilo 2 – DataExplorer

Data Profiling Report

Basic Statistics

Raw Counts

Name Value
Rows 47,520
Columns 11
Discrete columns 0
Continuous columns 11
All missing columns 0
Missing observations 0
Complete Rows 47,520
Total observations 522,720
Memory allocation 4 Mb

Percentages

Data Structure

Missing Data Profile

Univariate Distribution

Histogram

QQ Plot

Correlation Analysis

Principal Component Analysis

Q-Q plot – explanation: https://stats.stackexchange.com/questions/101274/how-to-interpret-a-qq-plot

Quick overview – DataExplorer

Link: https://www.r-bloggers.com/2021/03/faster-data-exploration-with-dataexplorer/

This R package offers an easy to use method for getting an impression of your data. These data are extracted from a simulation model:

SimThyr is a simulation program for the pituitary thyroid feedback control that is based on a parametrically isomorphic model of the overall system that aims in a better insight into the dynamics of thyrotropic feedback. Applications of this program cover research, including development of hypotheses, and education of students in biology and medicine, nurses and patients.
https://sourceforge.net/p/simthyr/home/SimThyr/
You may find different scenarios build for SimThyr here: https://sourceforge.net/projects/simthyr/files/Scenarios/ This file presented below are taken from these scenarios – Kubota 2.

Data Profiling Report

Basic Statistics

Raw Counts

Name Value
Rows 864
Columns 12
Discrete columns 1
Continuous columns 11
All missing columns 0
Missing observations 0
Complete Rows 864
Total observations 10,368
Memory allocation 85.7 Kb

Percentages

Data Structure

Missing Data Profile

Univariate Distribution

Histogram

Bar Chart (with frequency)

QQ Plot

Correlation Analysis

## Warning in dummify(data, maxcat = maxcat): Ignored all discrete
## features since `maxcat` set to 20 categories!

Principal Component Analysis

Q-Q plot – explanation: https://stats.stackexchange.com/questions/101274/how-to-interpret-a-qq-plot