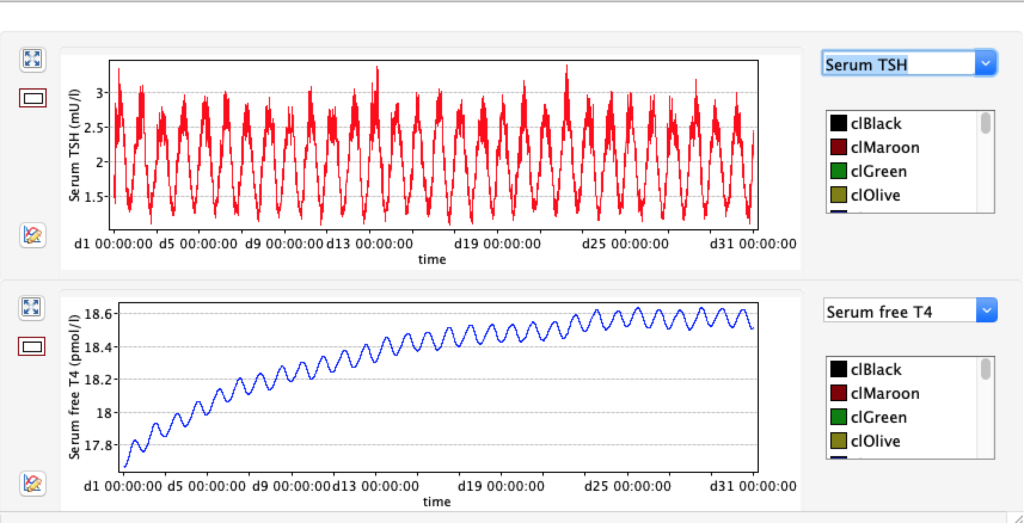
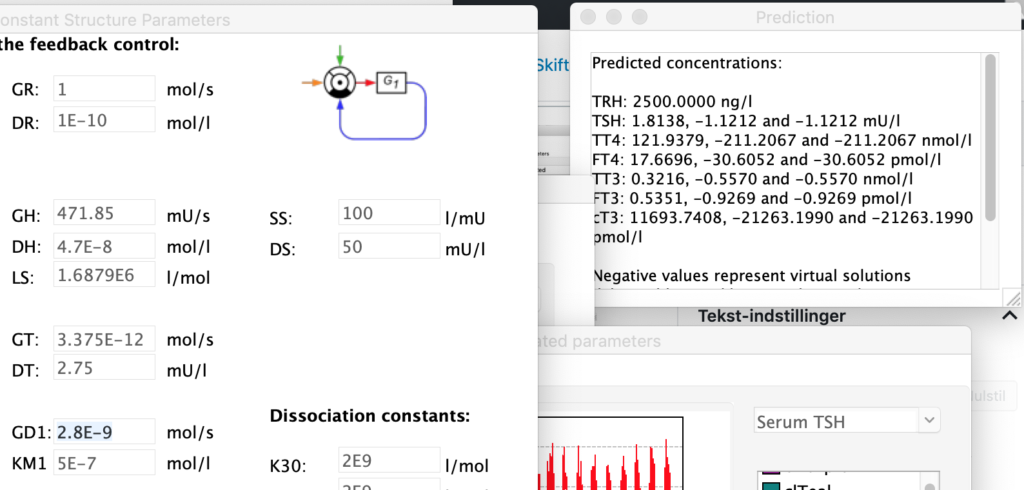
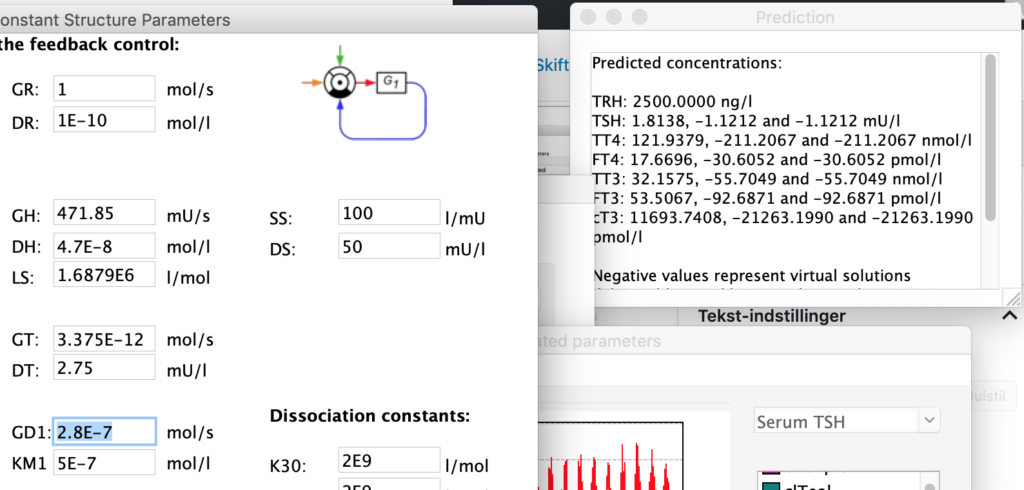
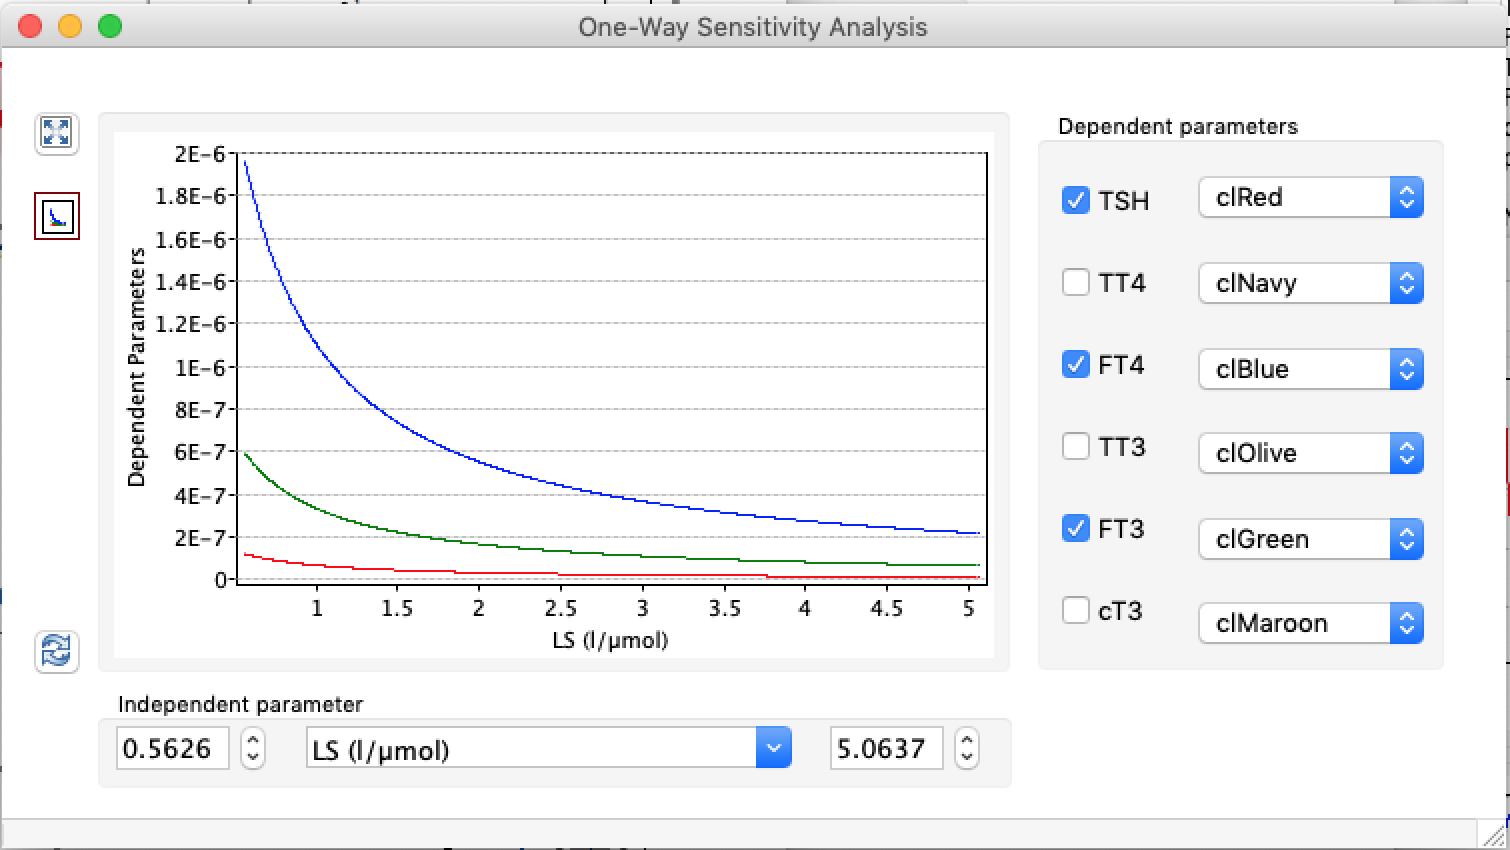
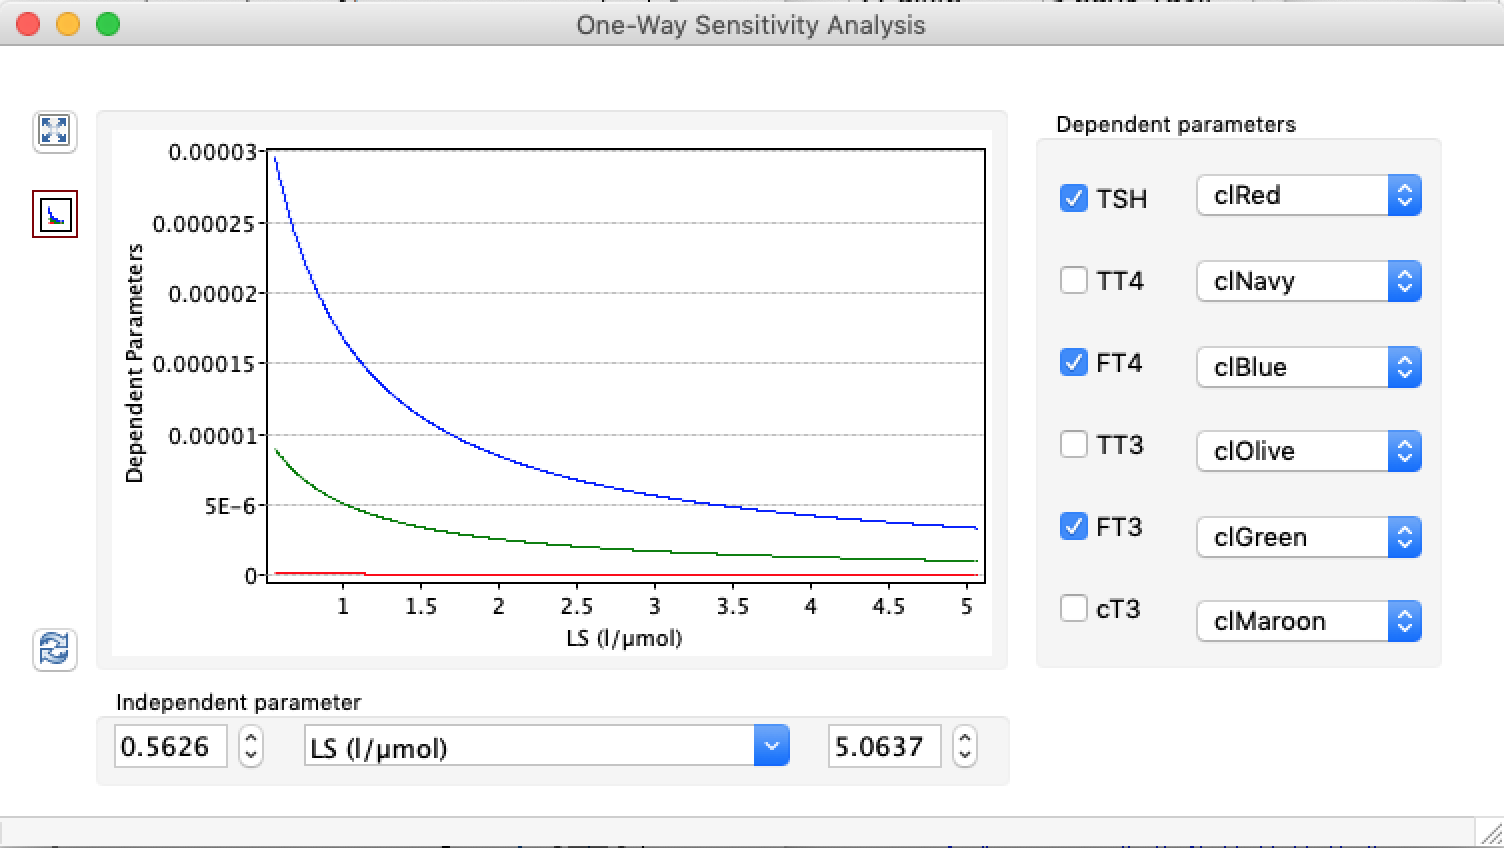
LS: Brake constant of feedback path #1 (Astwood-Hoskins loop)
The damping constant of LS located in the pituitary is about 1,08 ± 0,14 l/µmol for the total group and in the untreated group (where hypothyroidism belongs) the figures are 1,78 ± 0,27 l/µmol.
Damping is an influence within or upon an oscillatory system that has the effect of reducing, restricting or preventing its oscillations. In physical systems, damping is produced by processes that dissipate the energy stored in the oscillation.
| TABLE 6. | Decrease LS ( /10) | STANDARD FIGURES | Increase LS (x10) |
| TRH | 2500 | 2500 | 2500 |
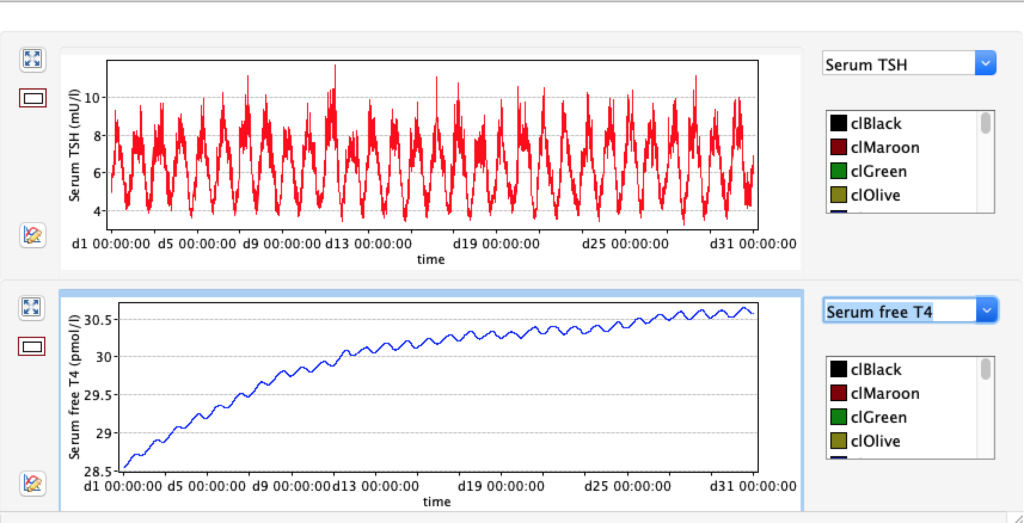
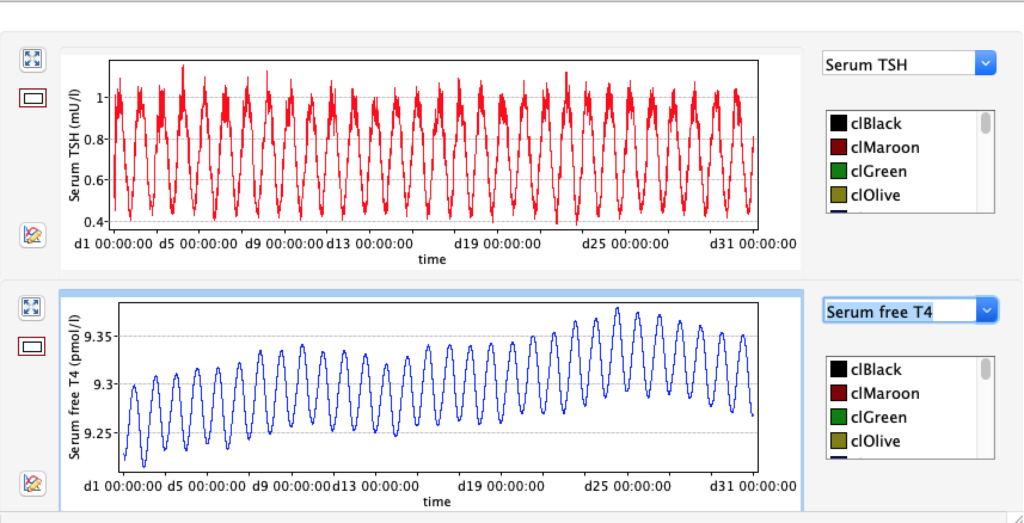
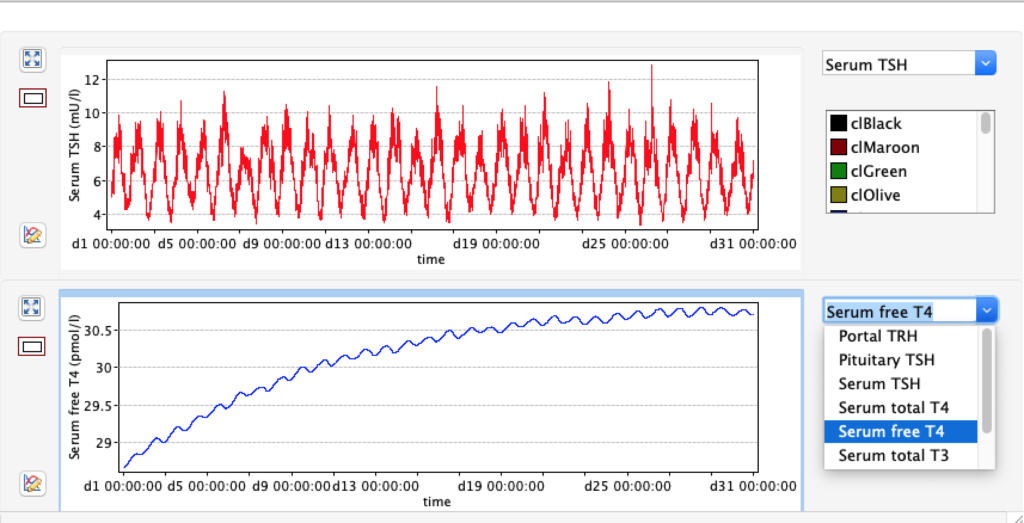
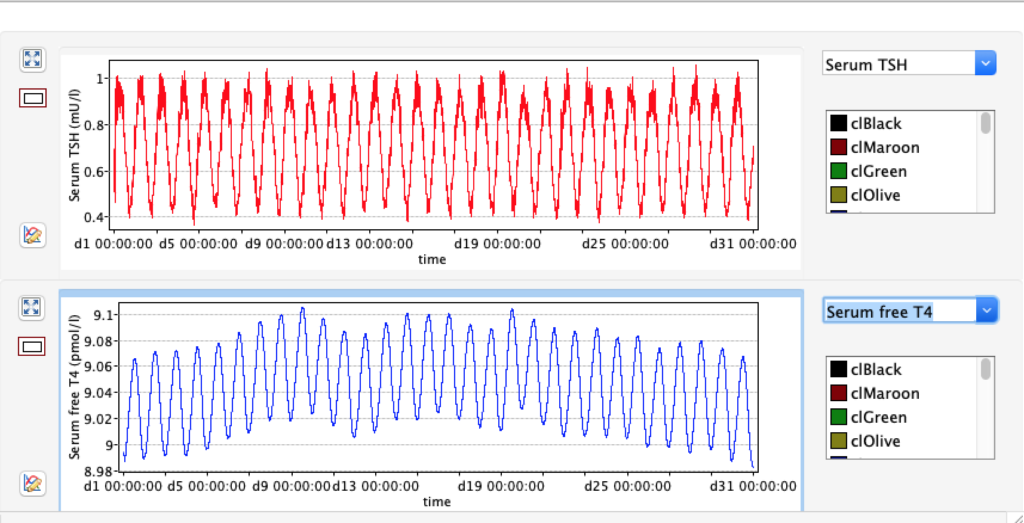
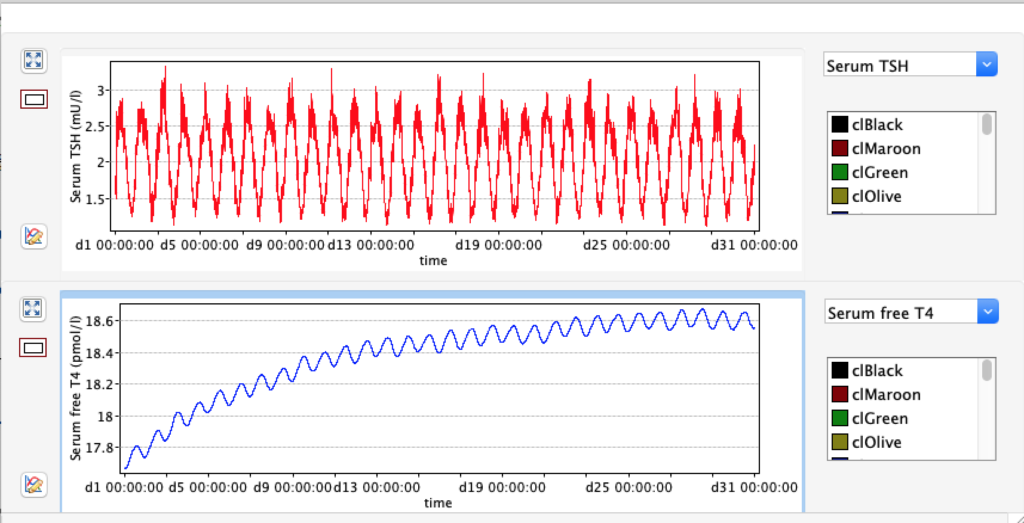
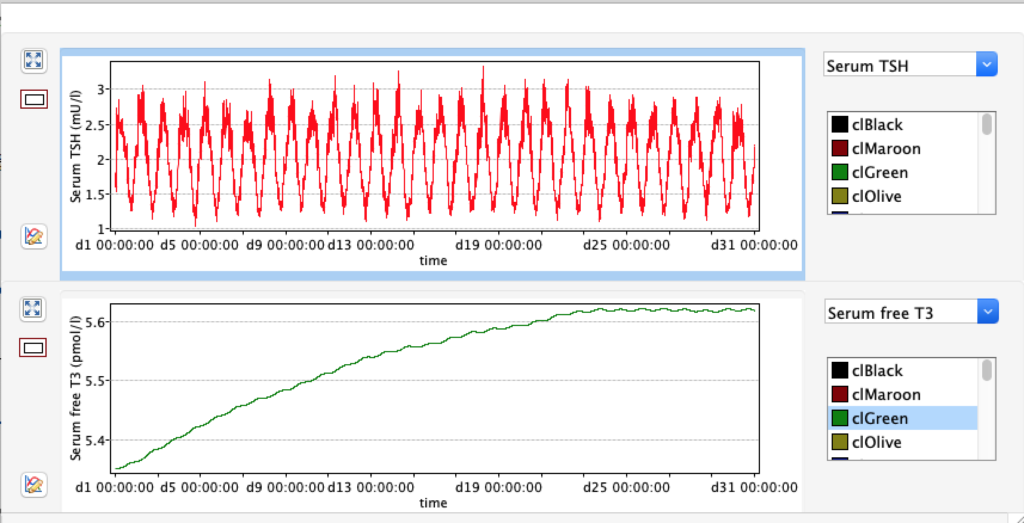
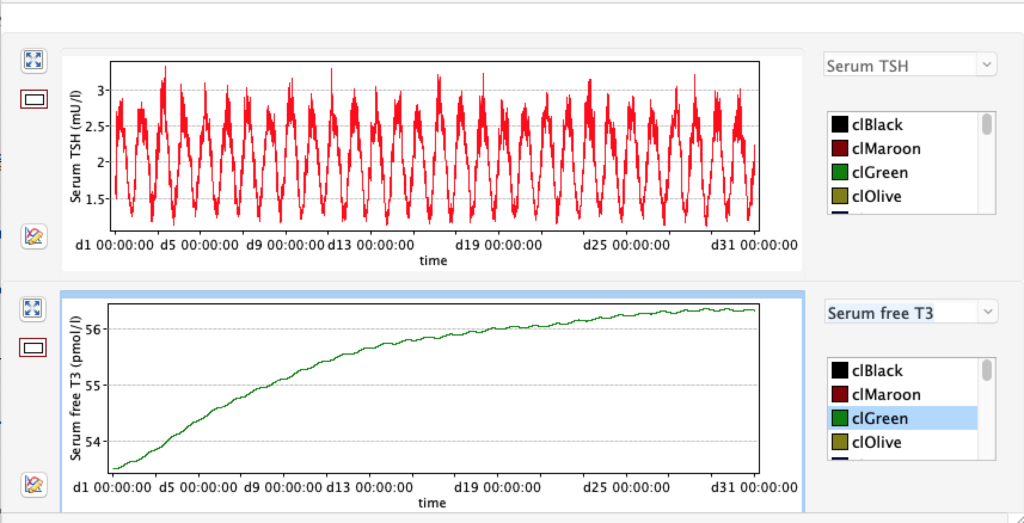
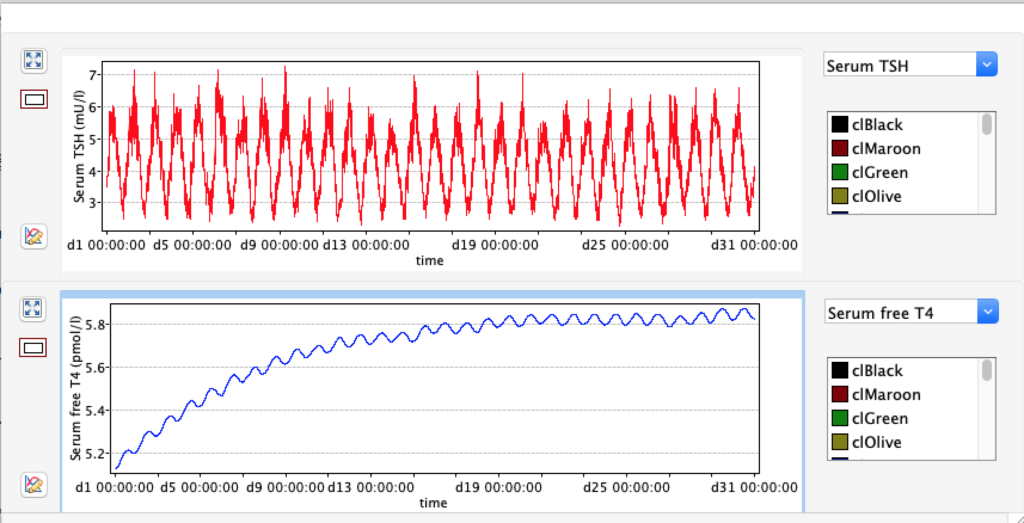
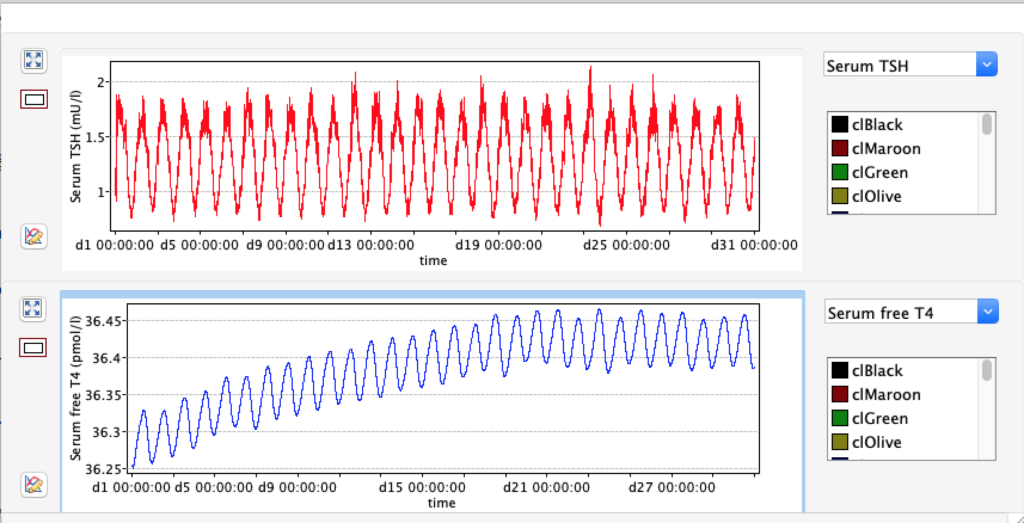
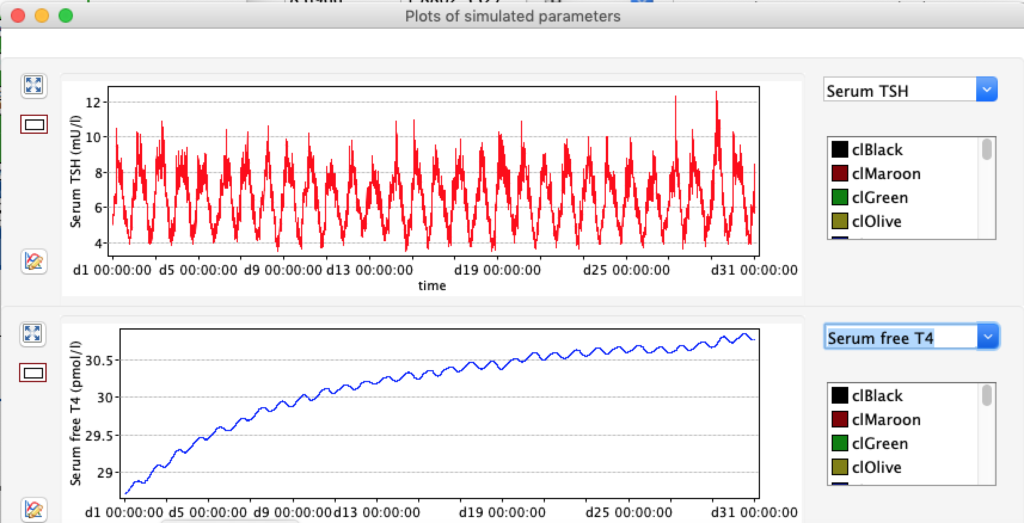
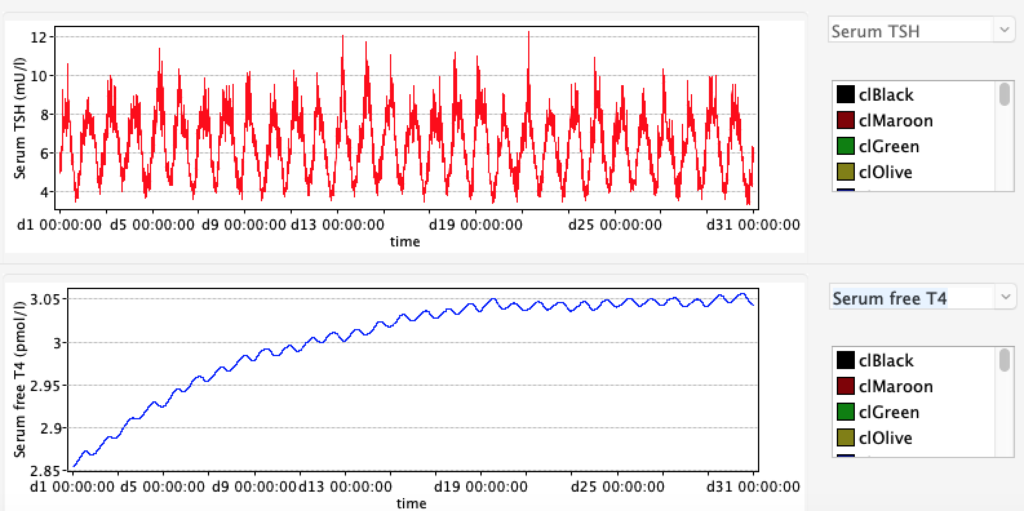
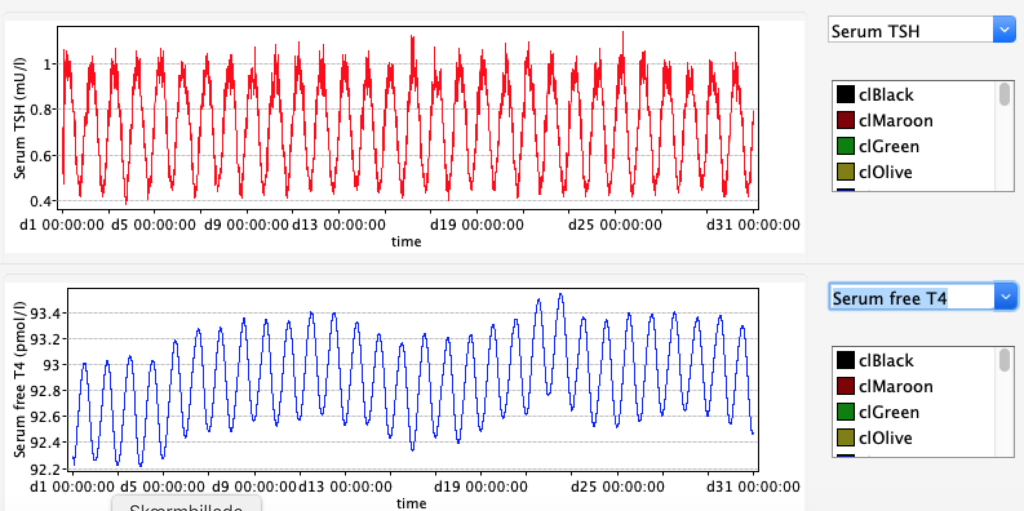
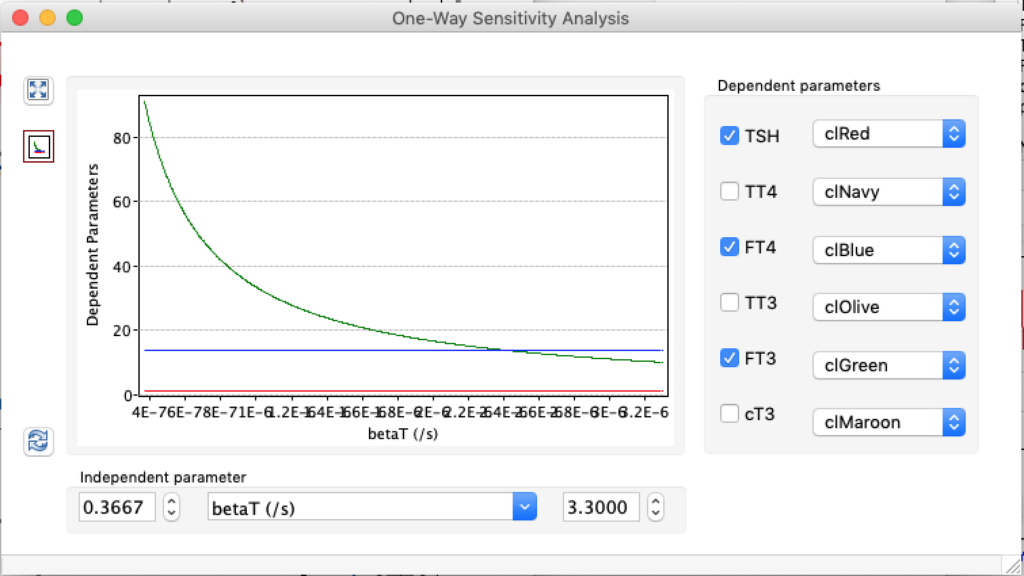
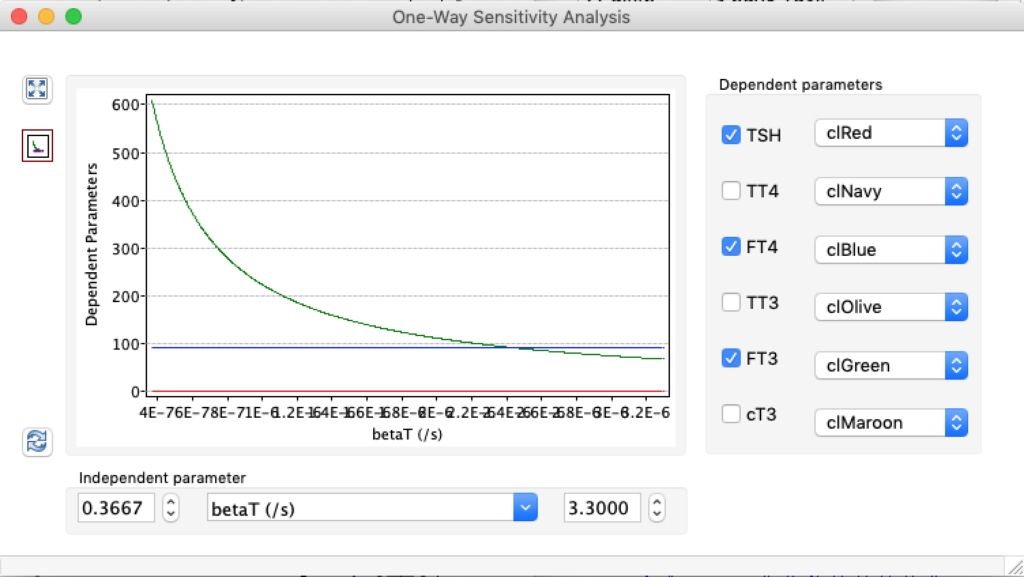
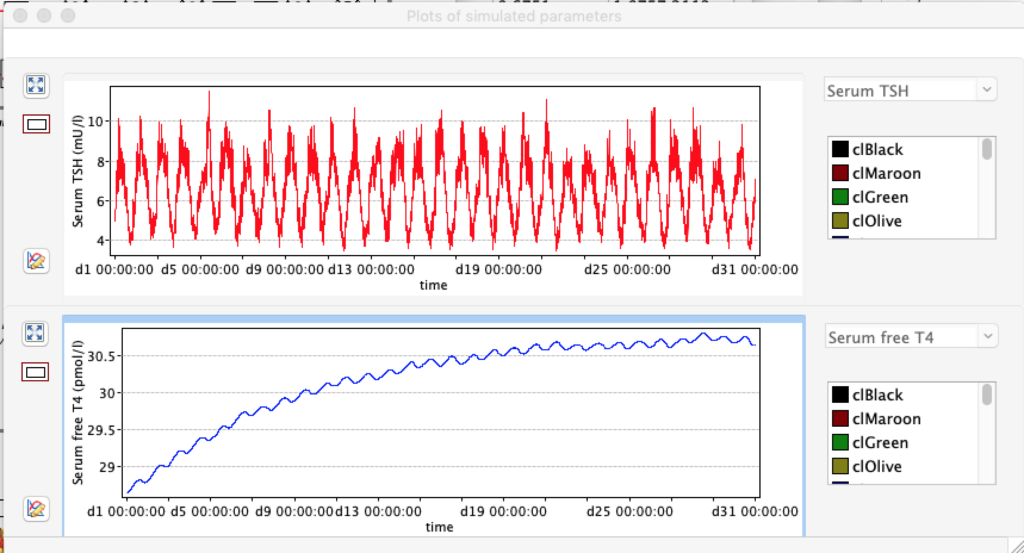
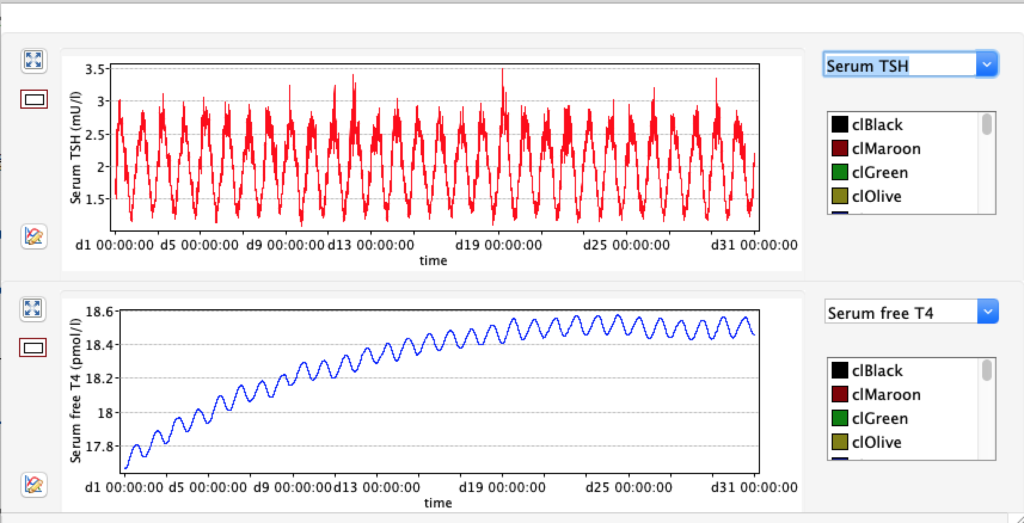
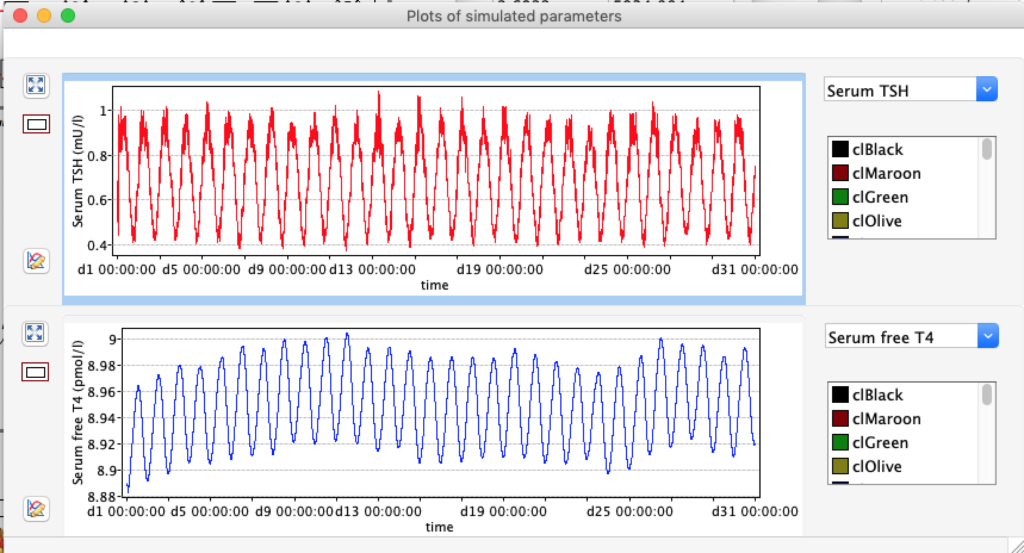
| TSH | 5,0166 | 1,8 | 0,6878 |
| TT4 | 198,1796 | 121,94 | 61,3824 |
| FT4 | 28,7175 | 17,67 | 8,8947 |
| TT3 | 5,2263 | 3,21 | 1,6188 |
| FT3 | 8,696 | 5,35 | 2,6935 |
| cT3 | 18801,1569 | 11693,7490 | 5937,7172 |
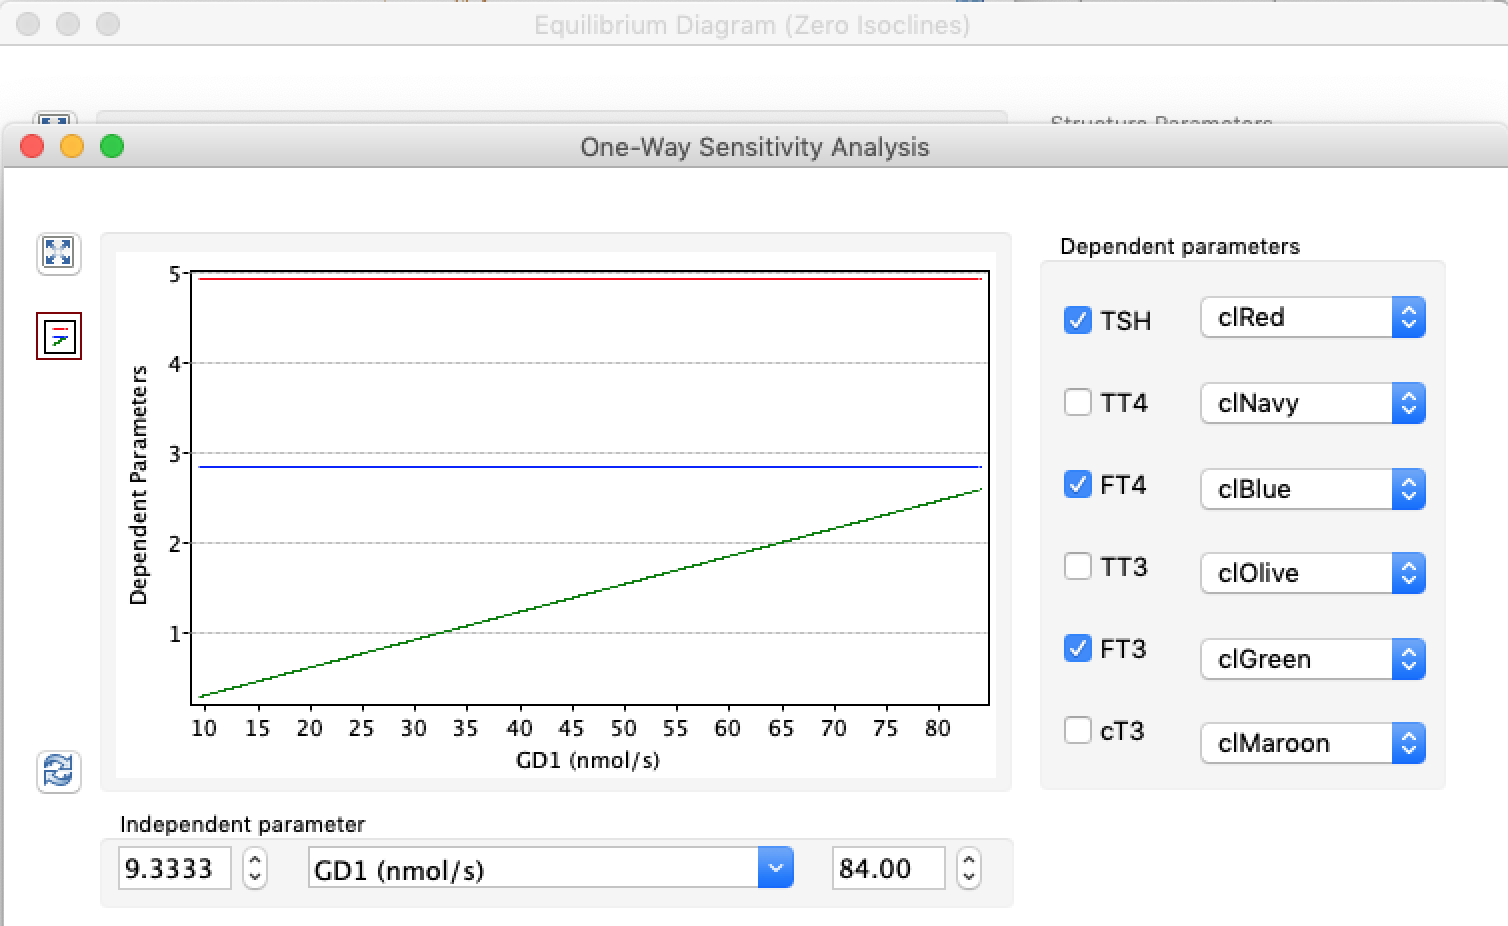
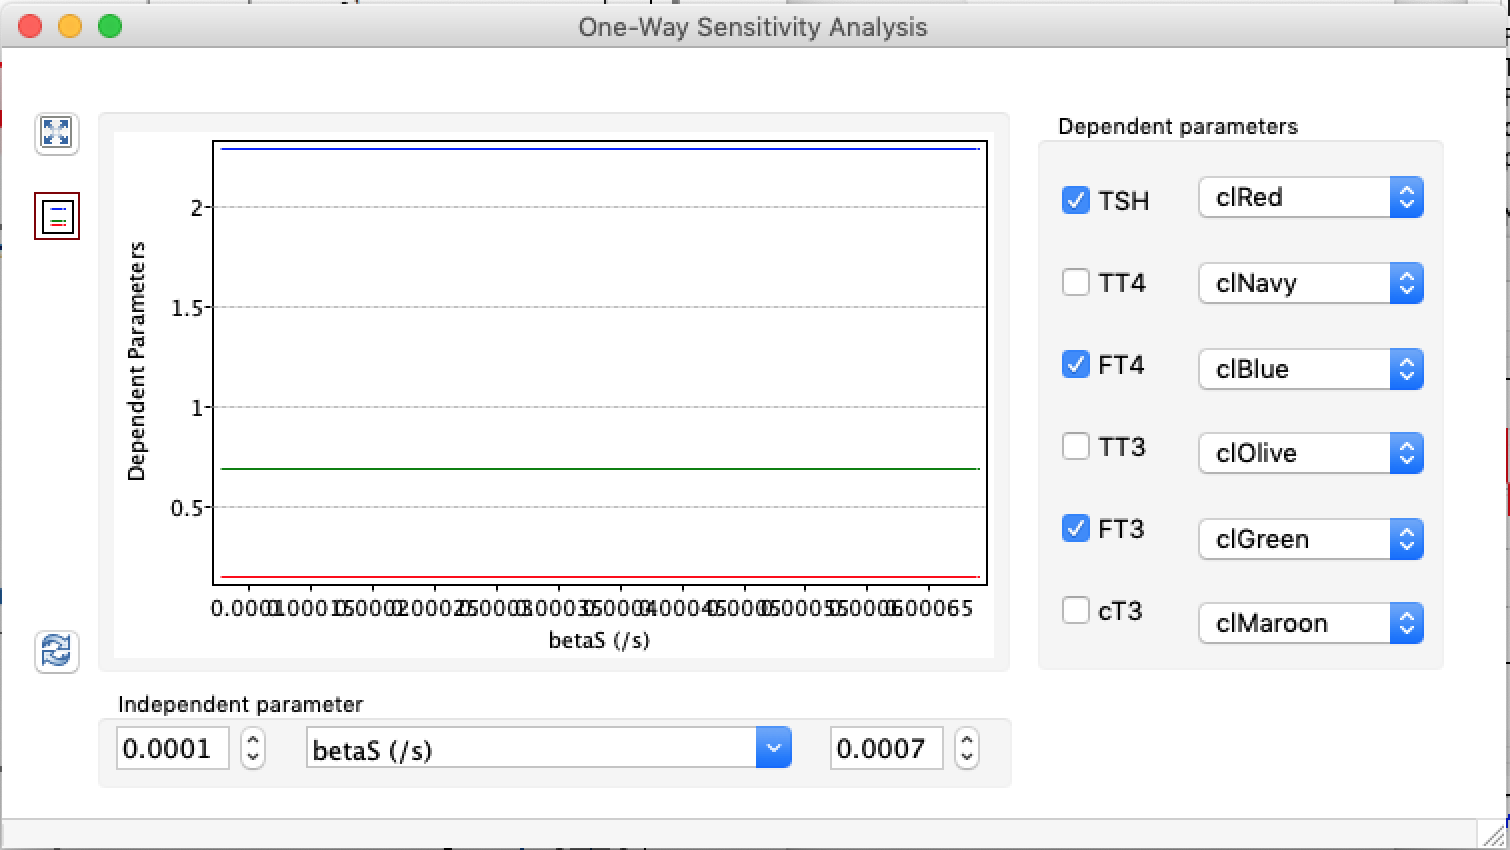
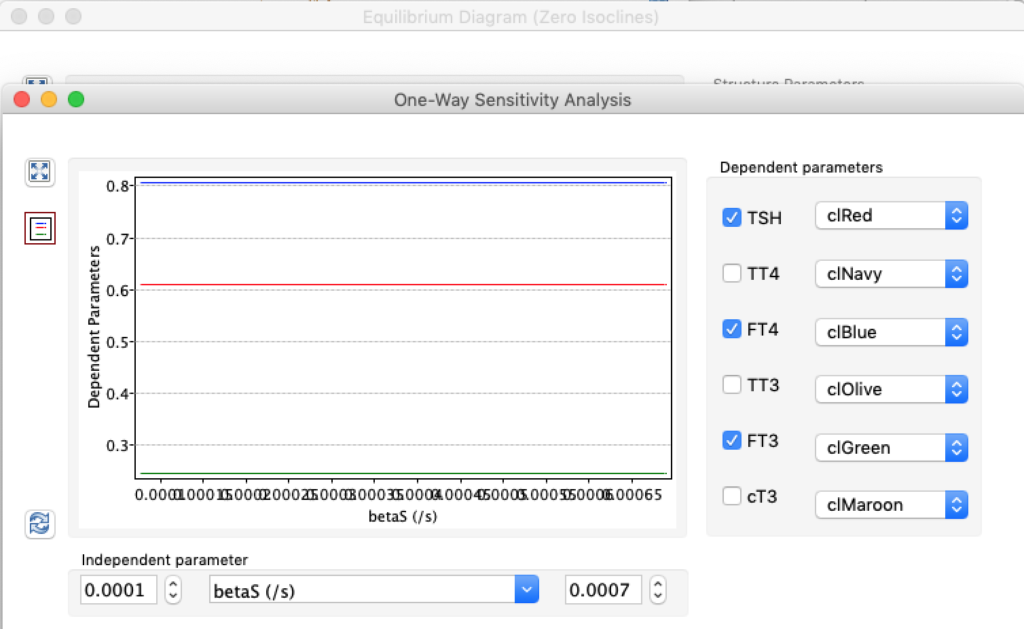
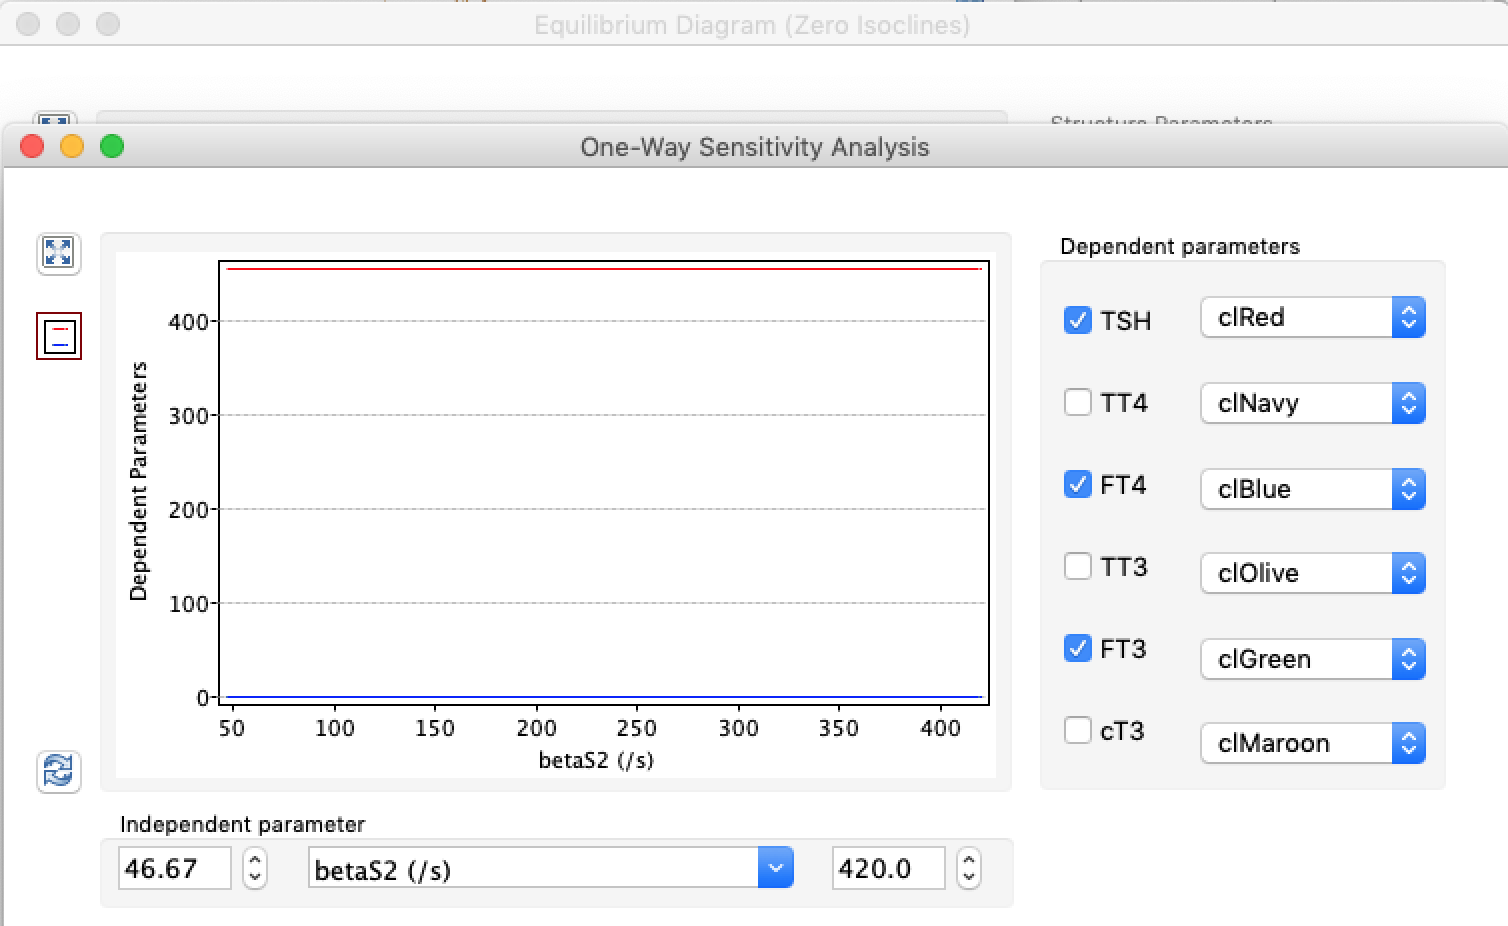
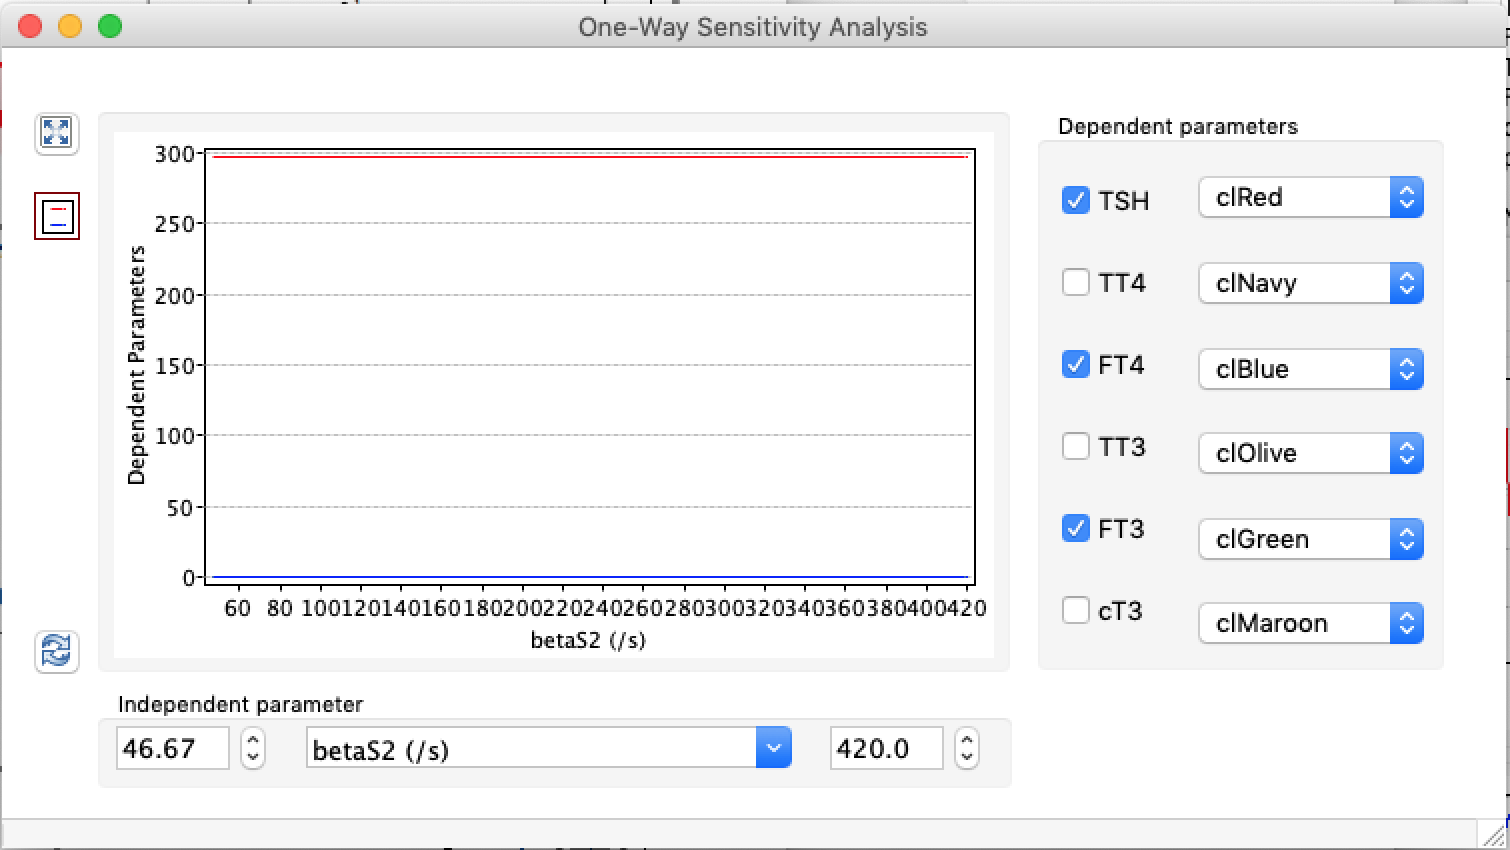
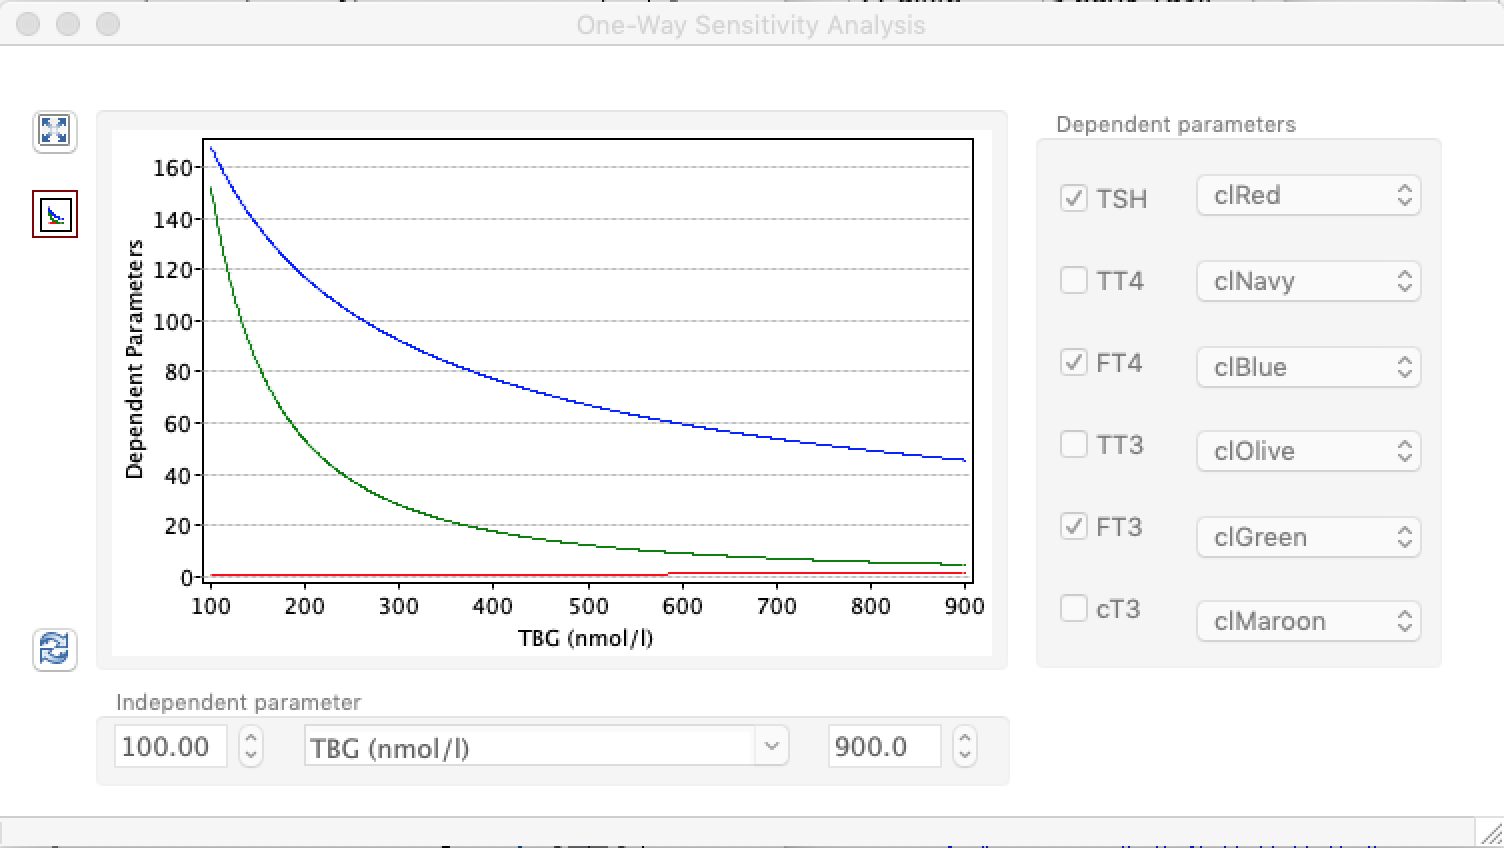
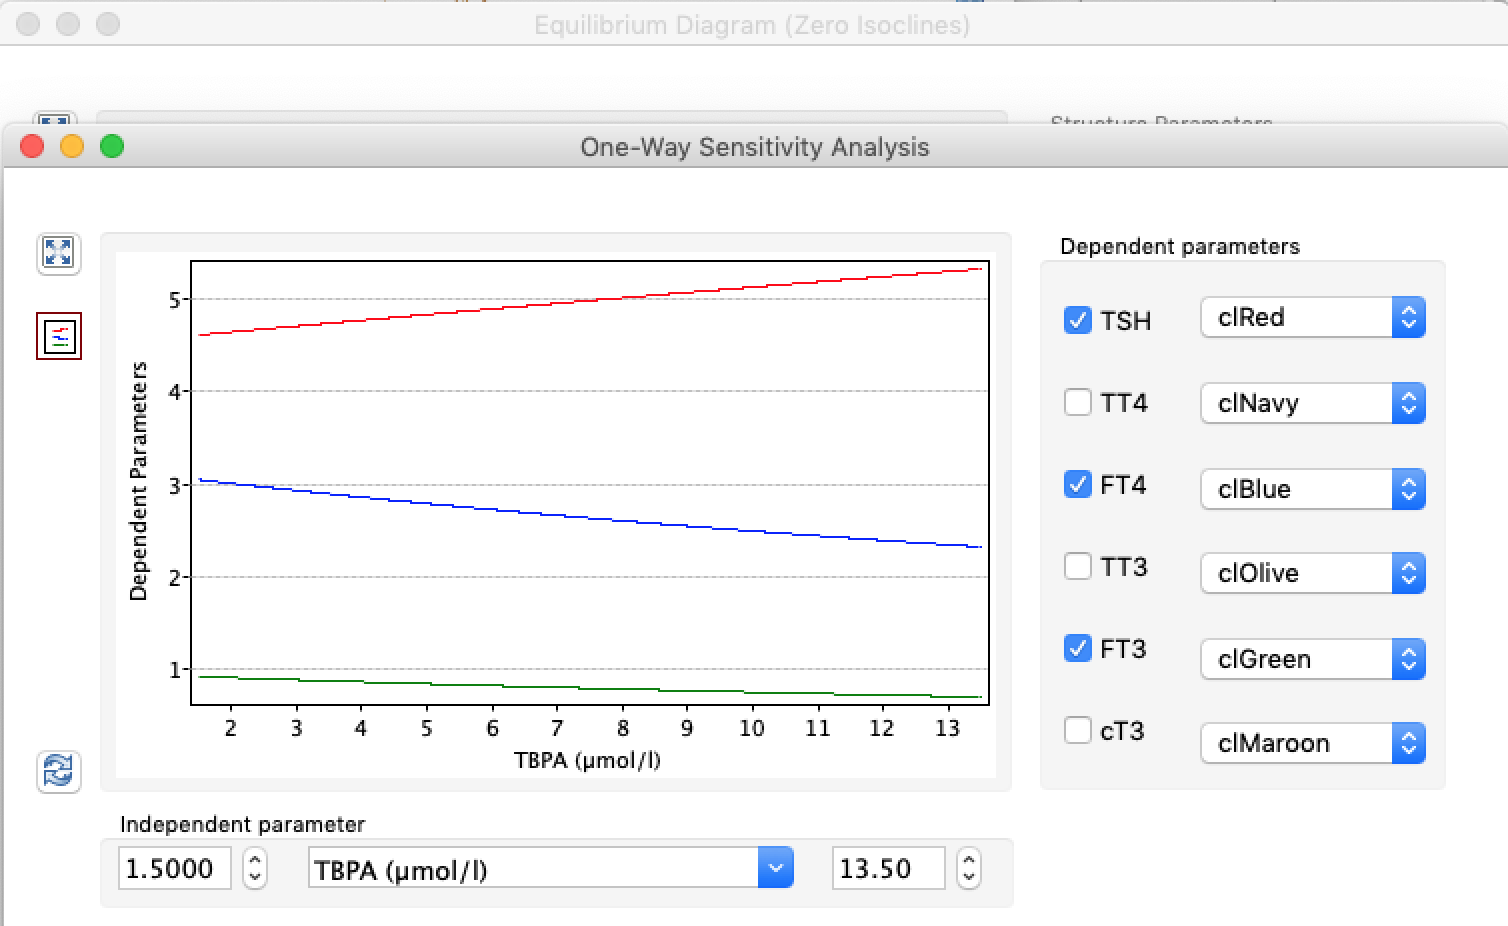
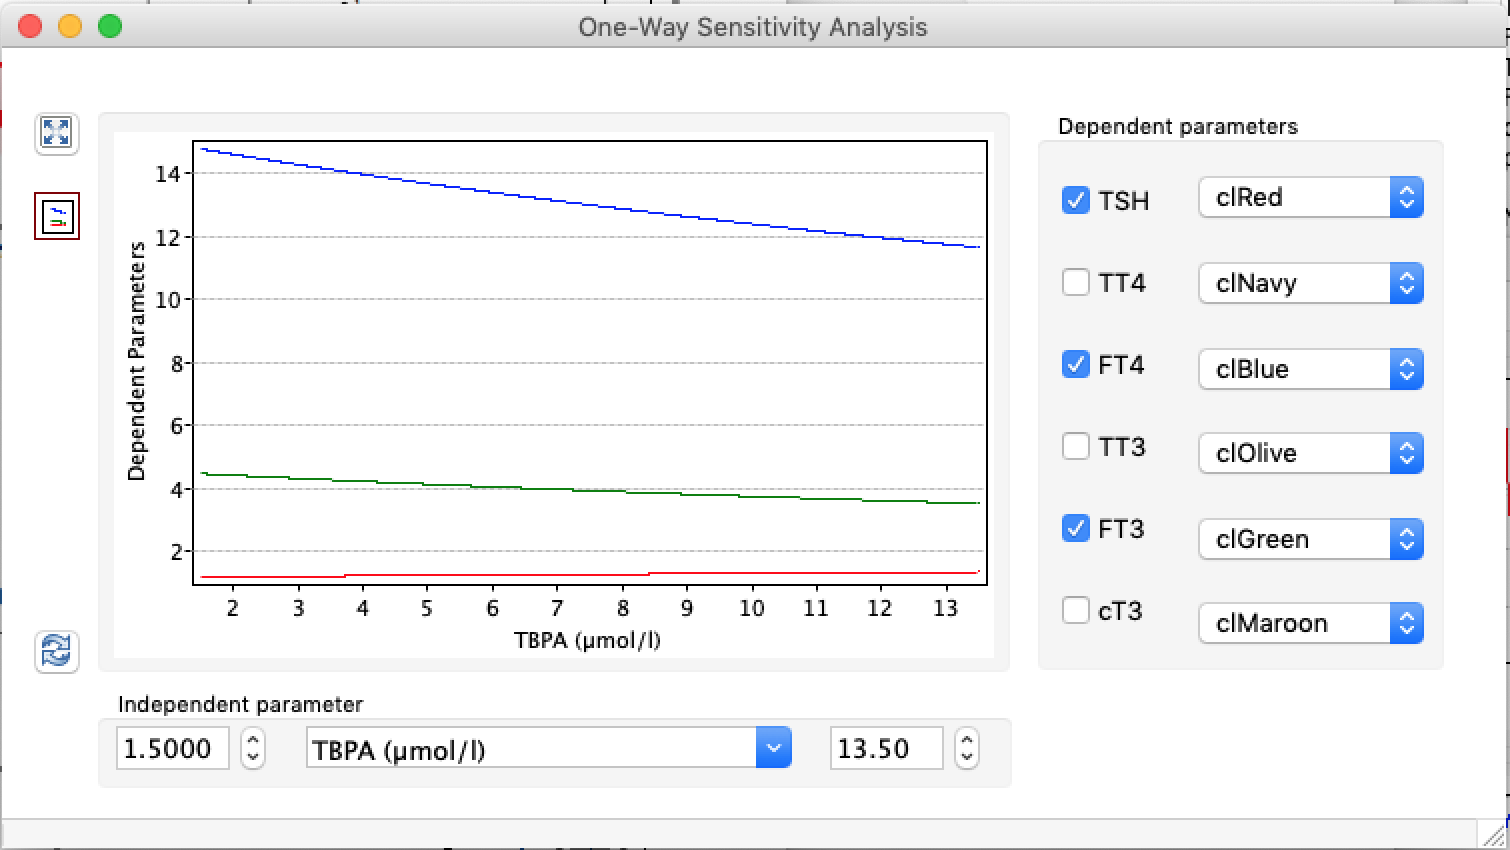
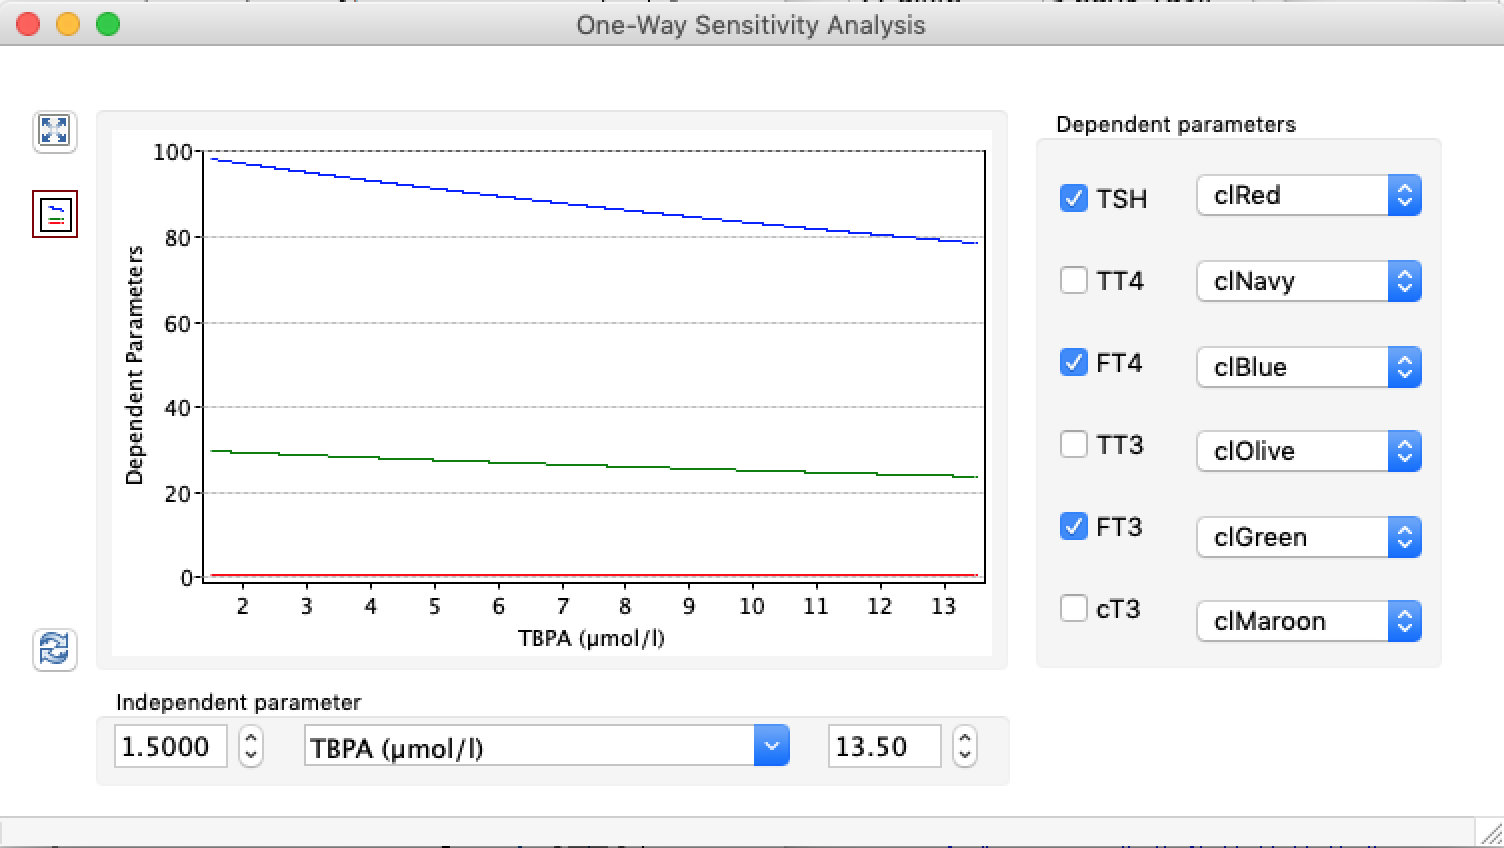
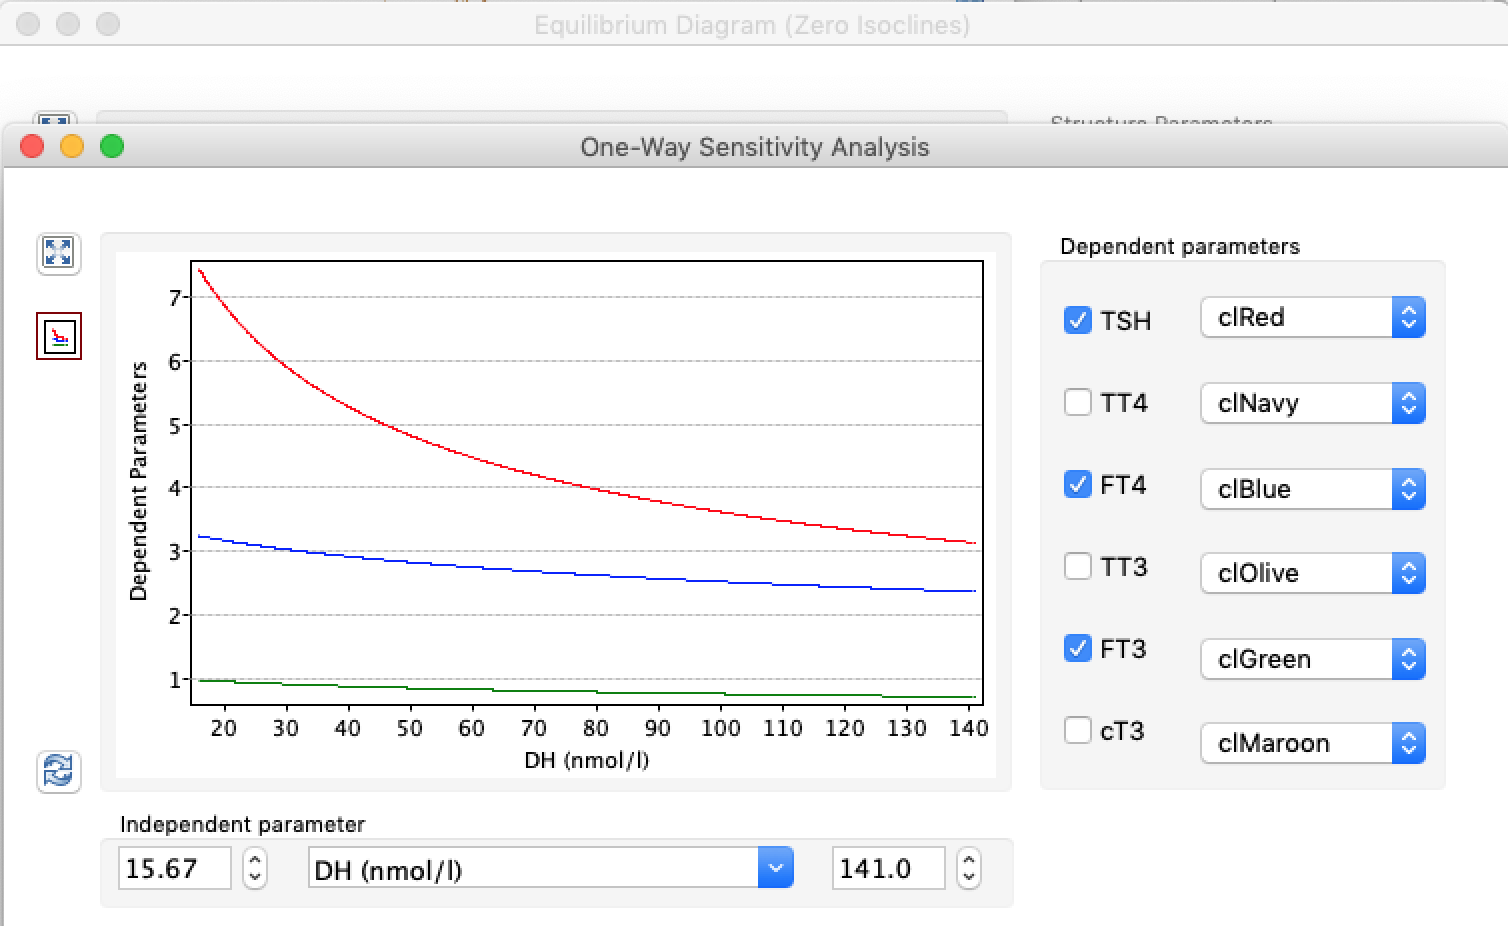
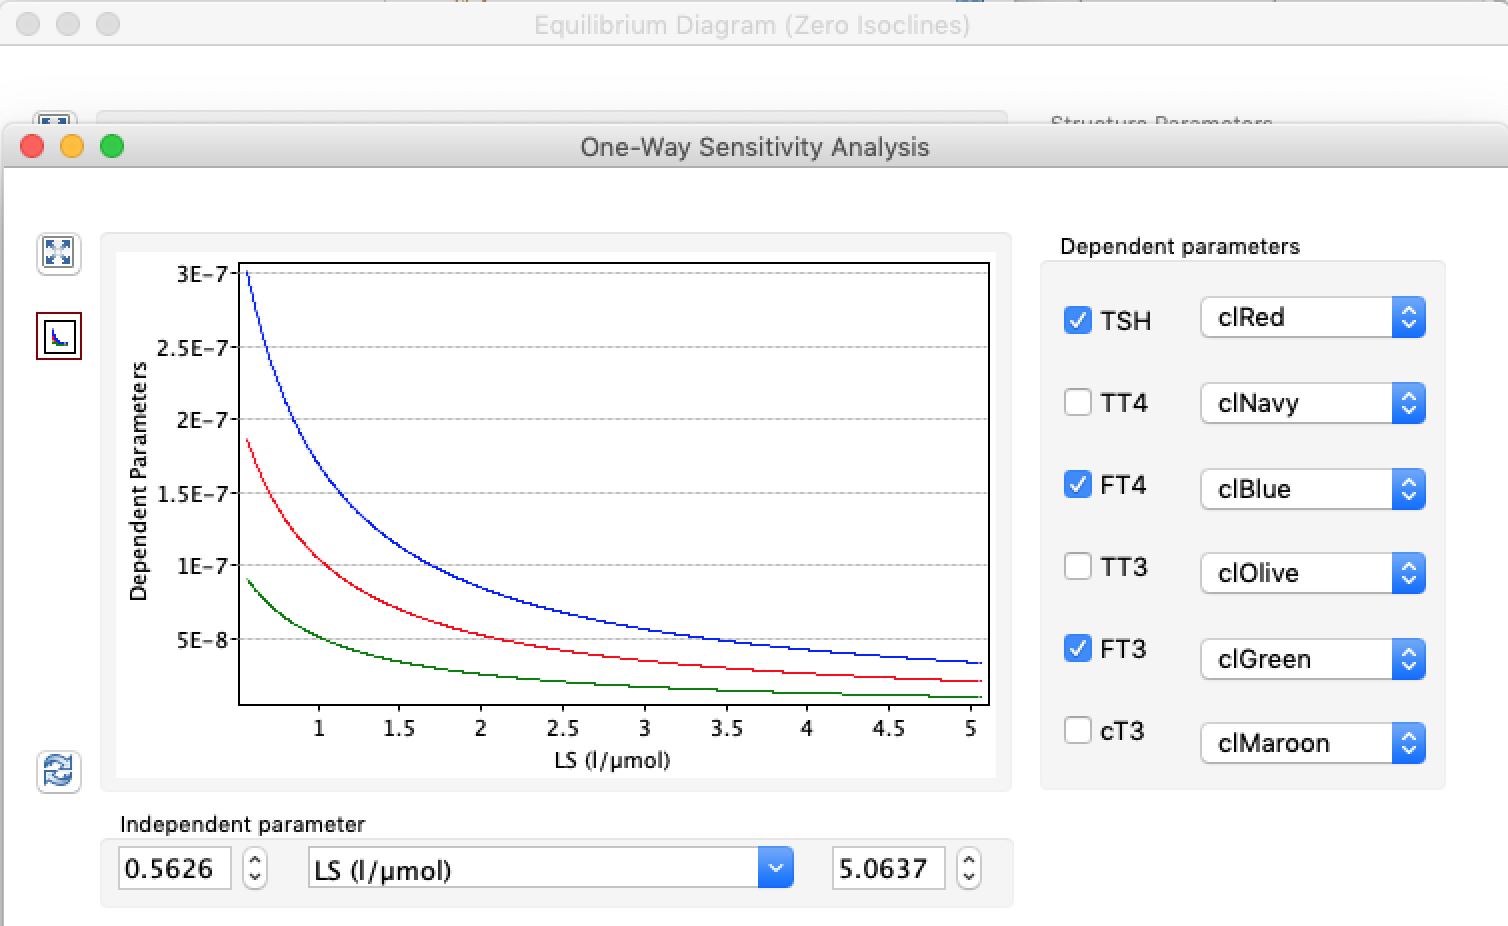
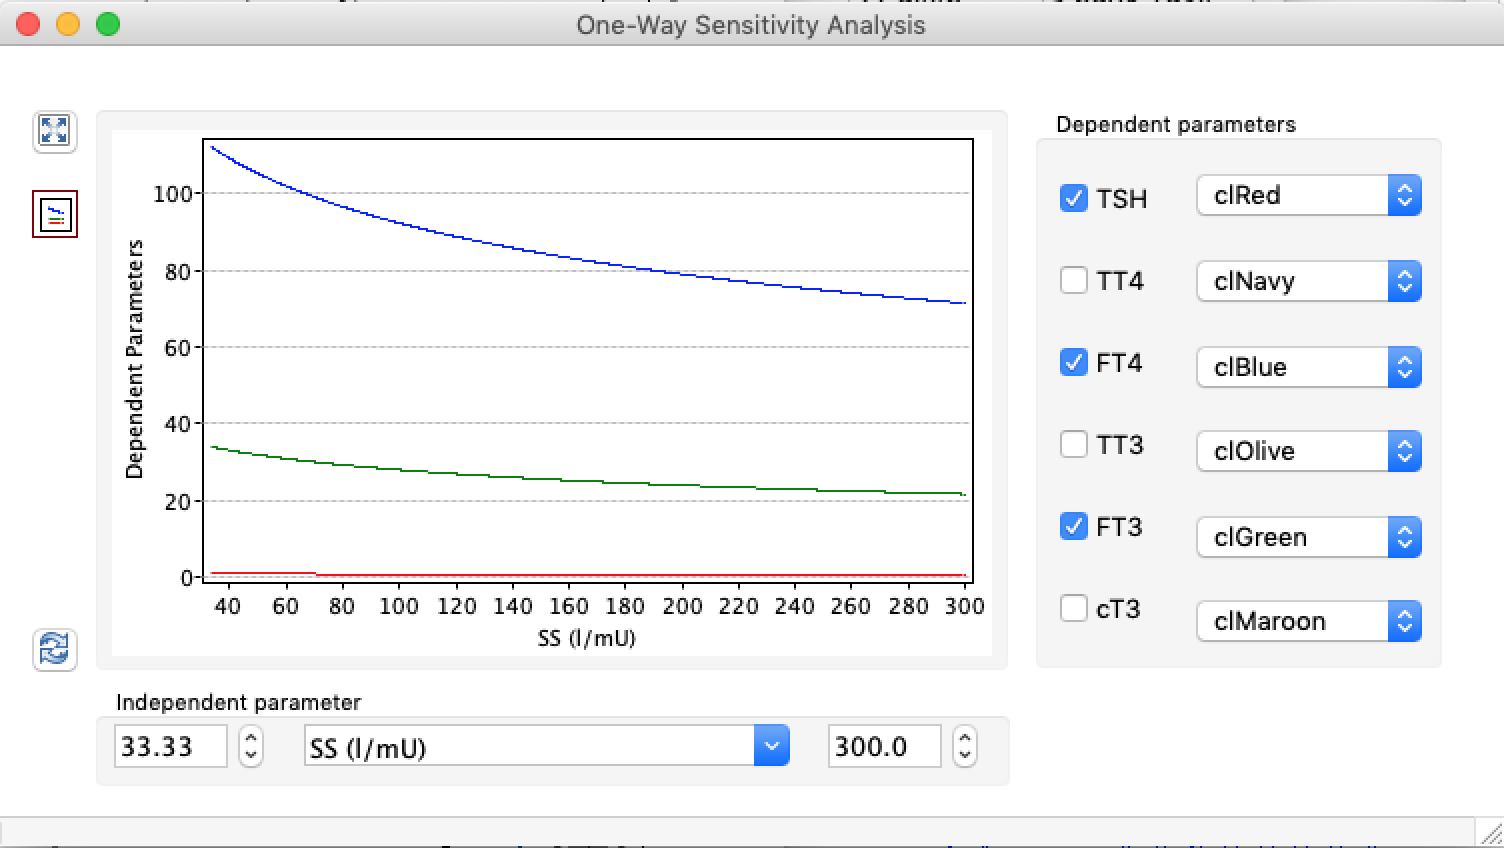
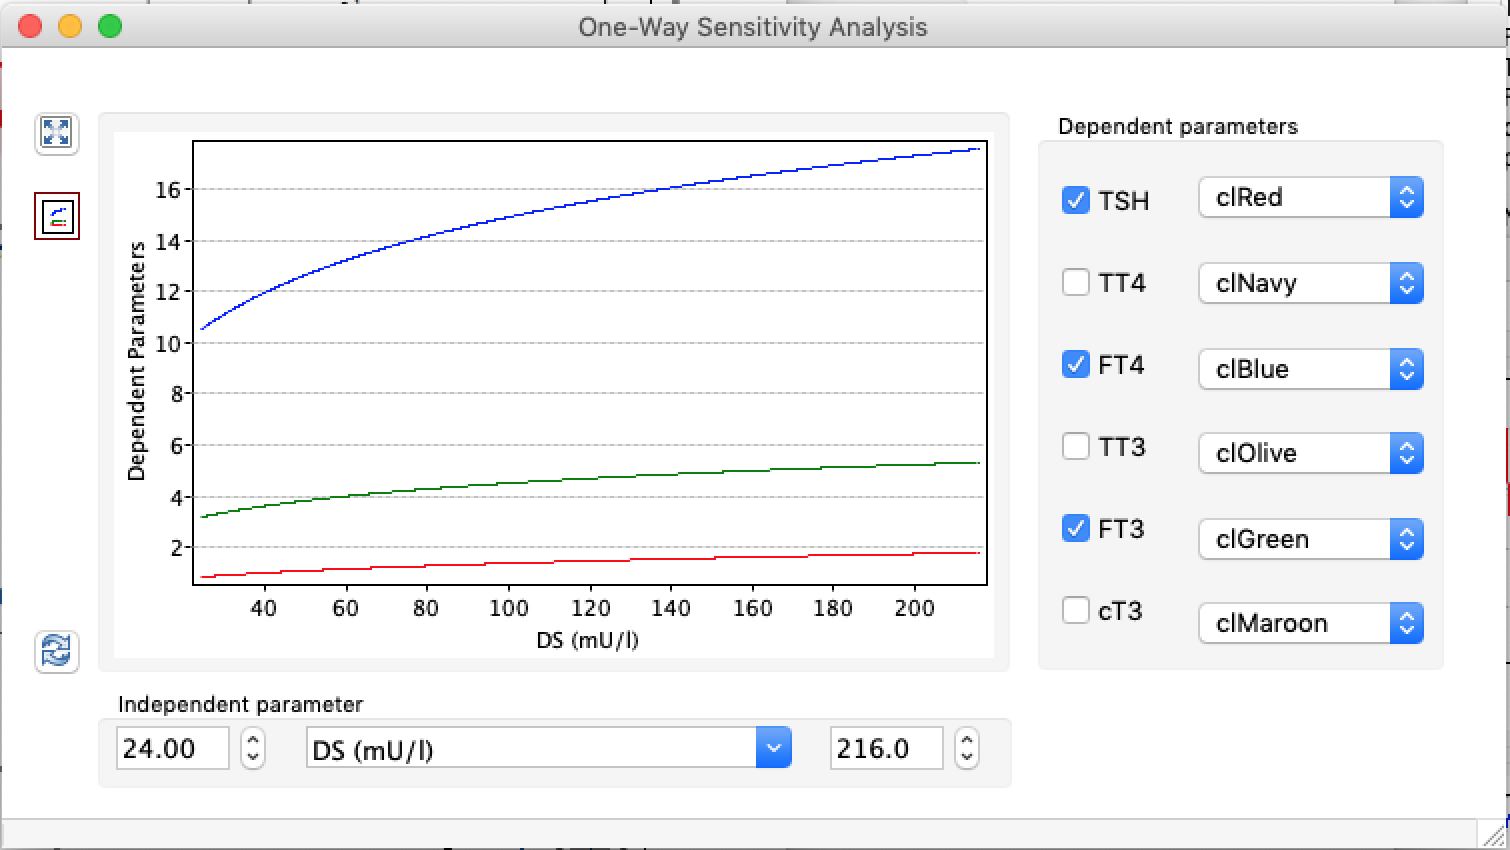
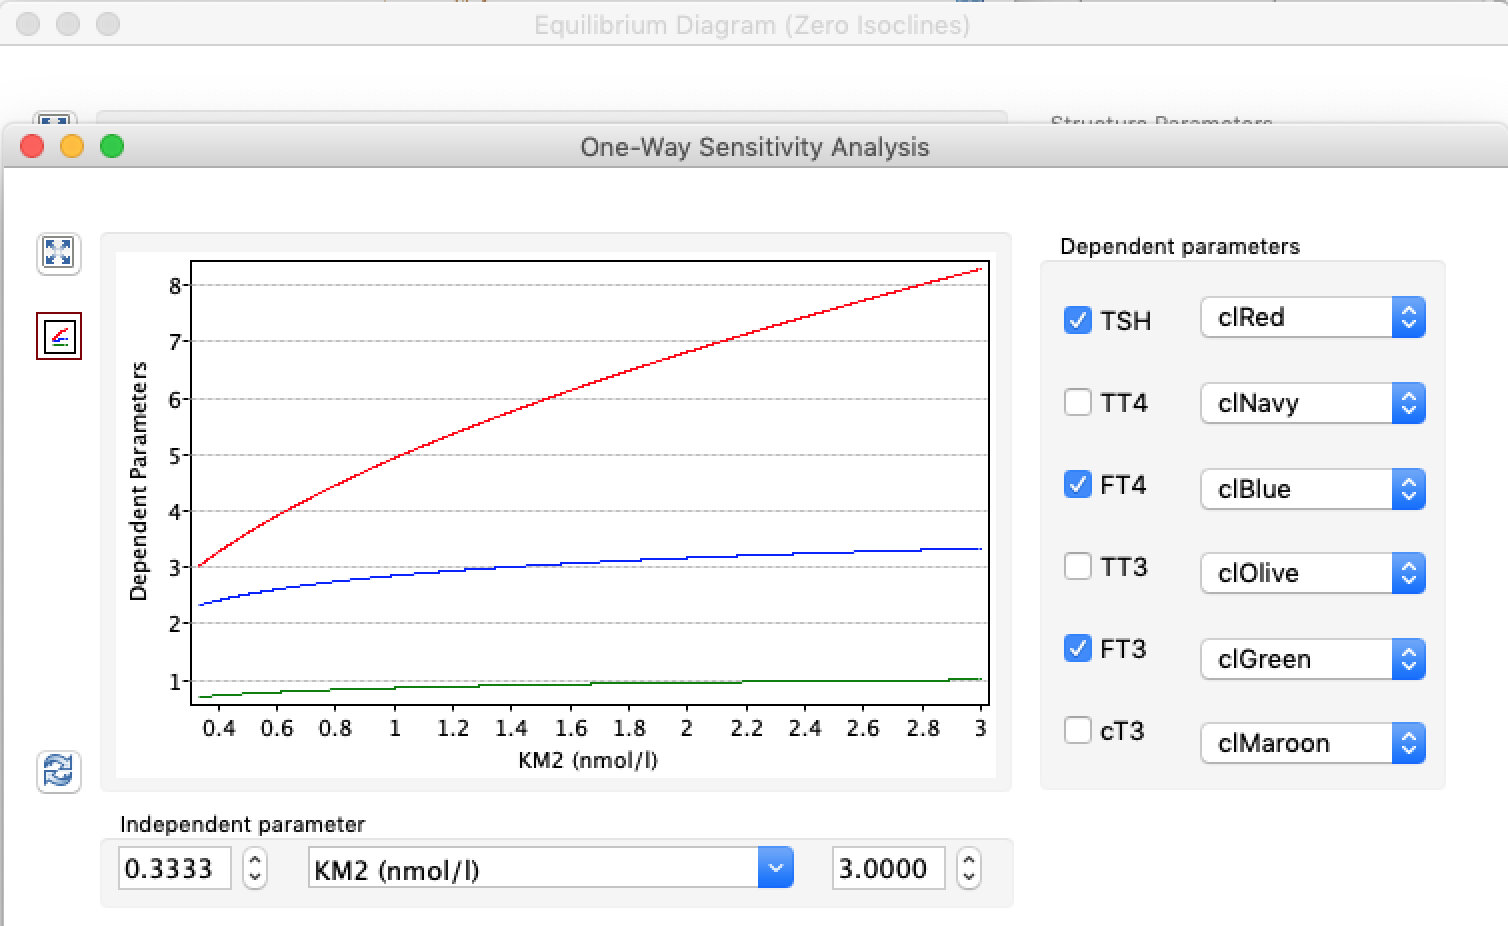
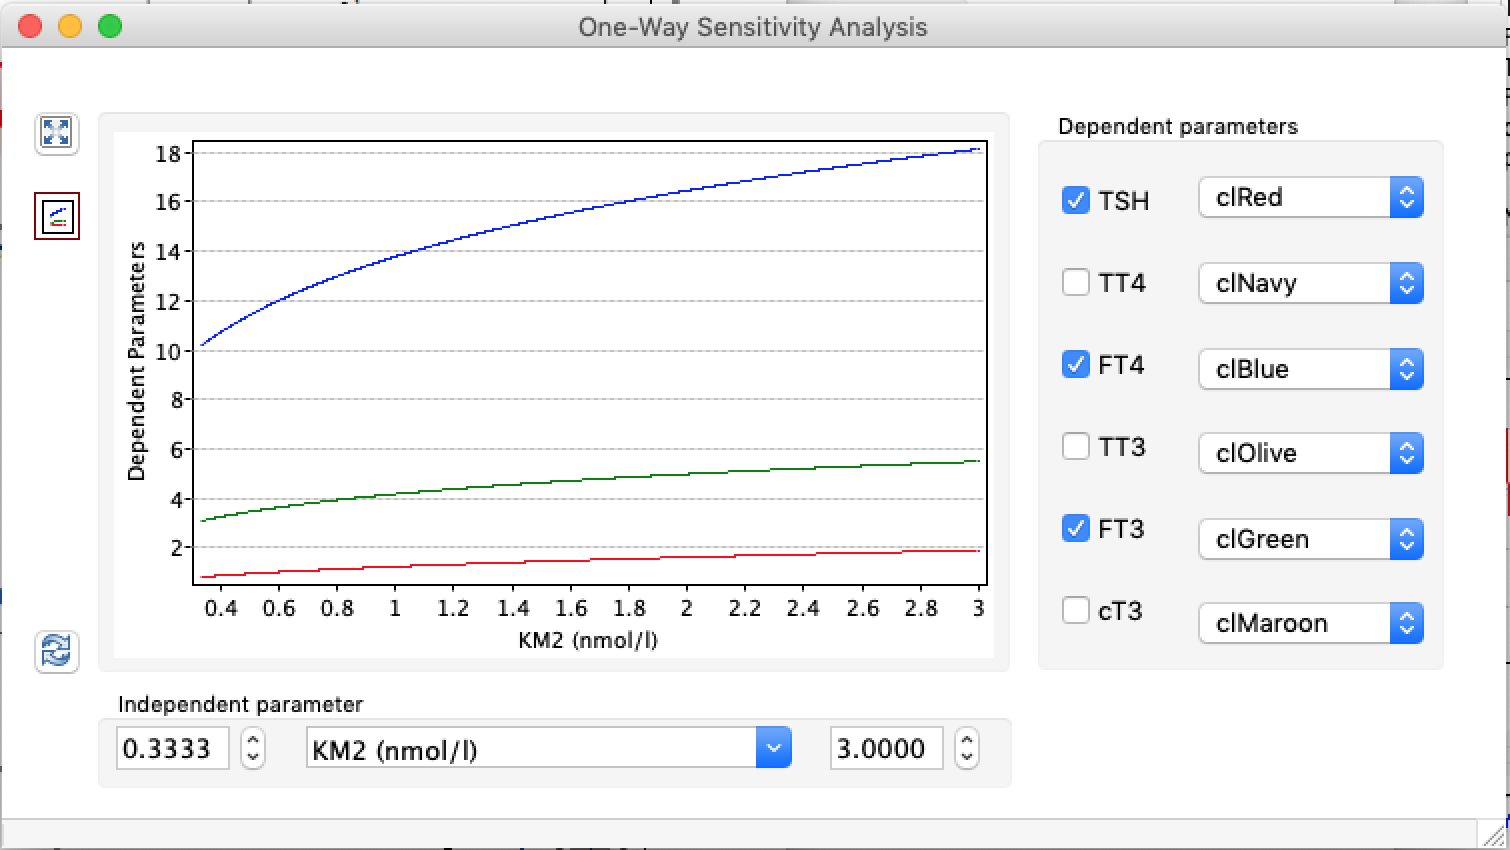
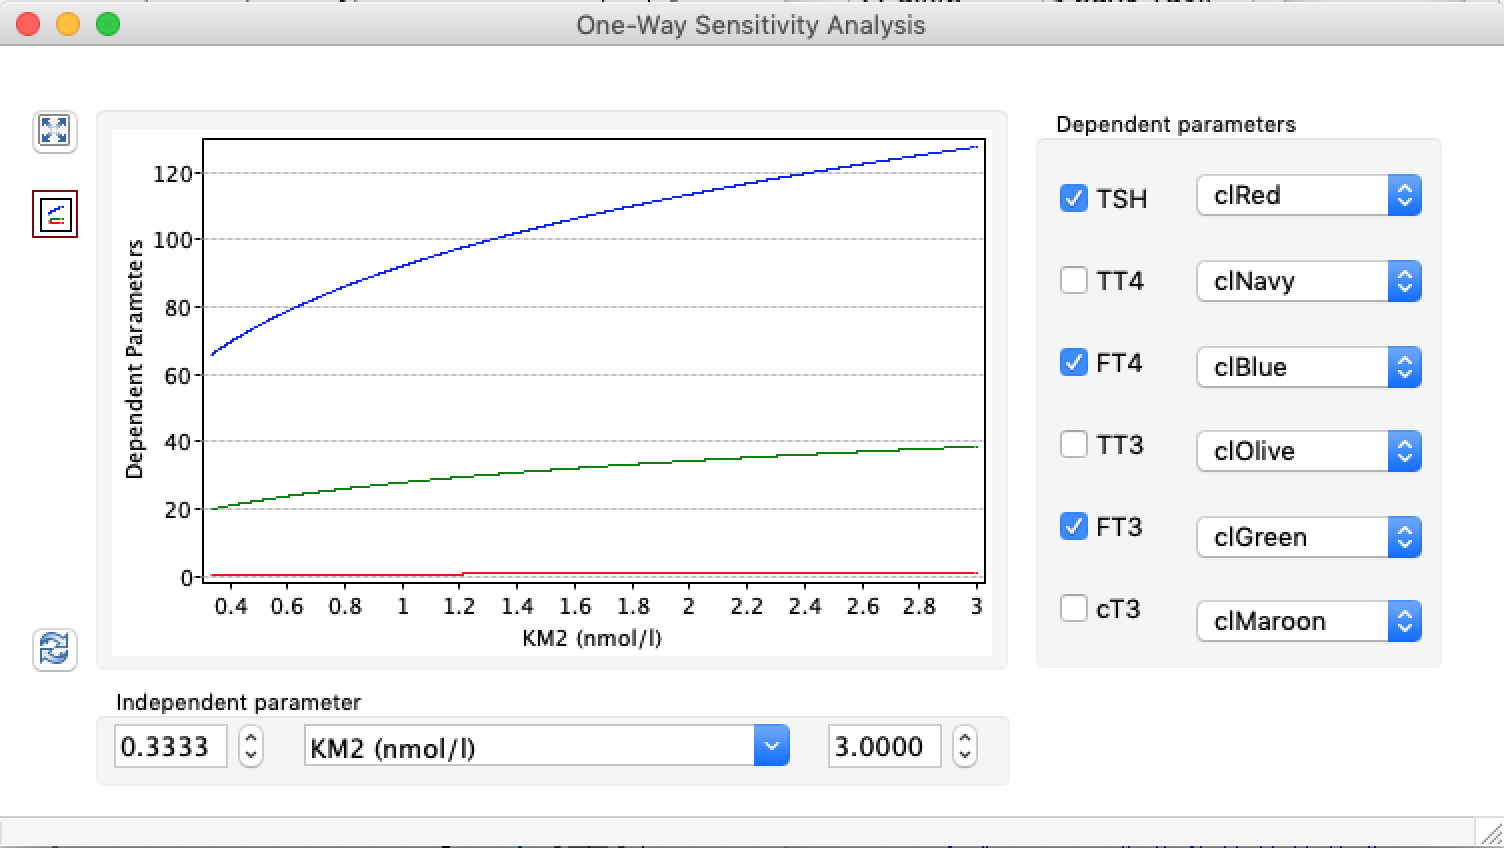
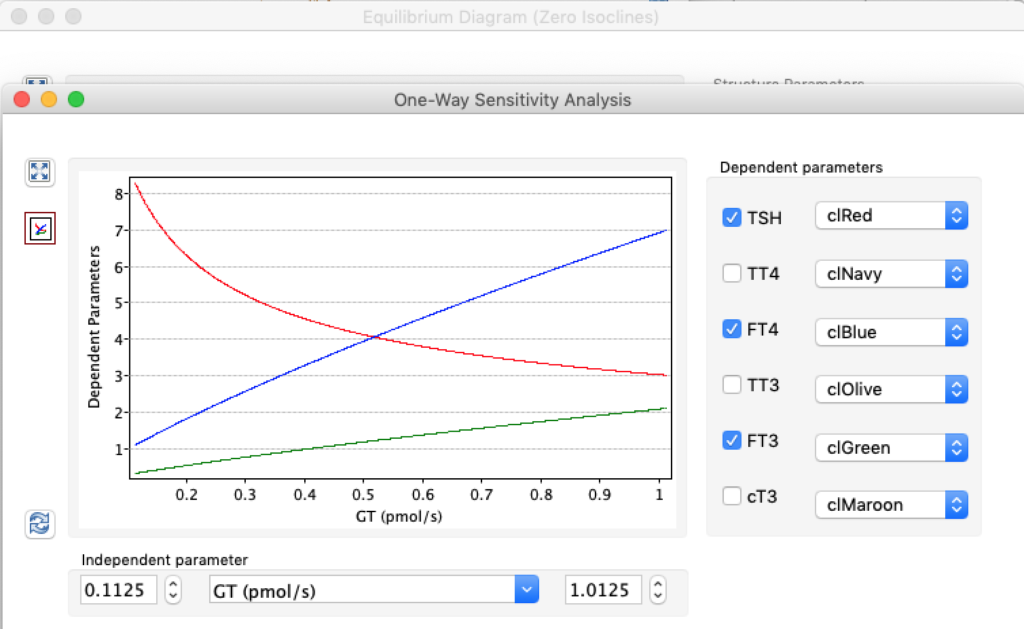
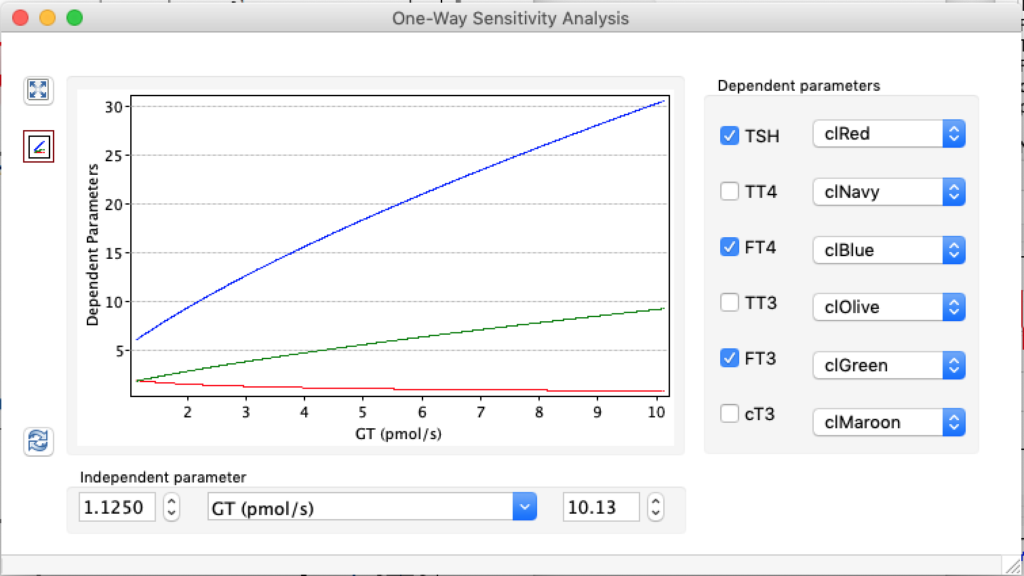
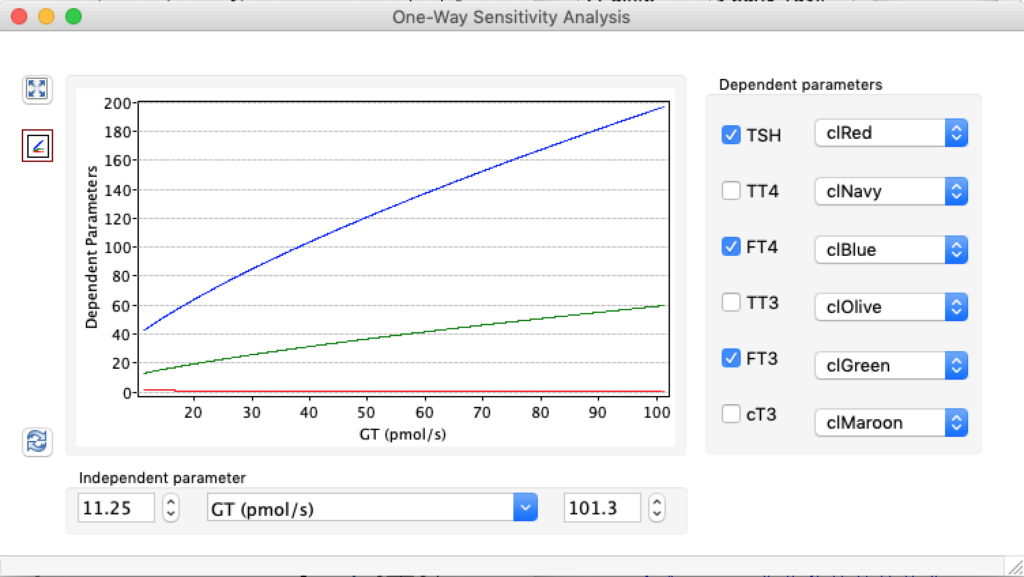
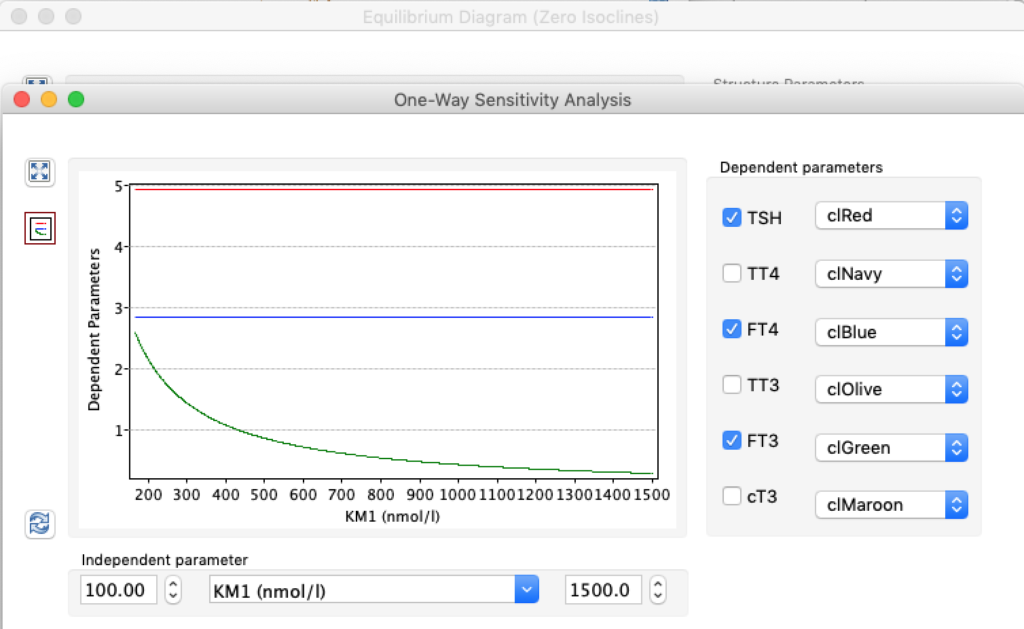
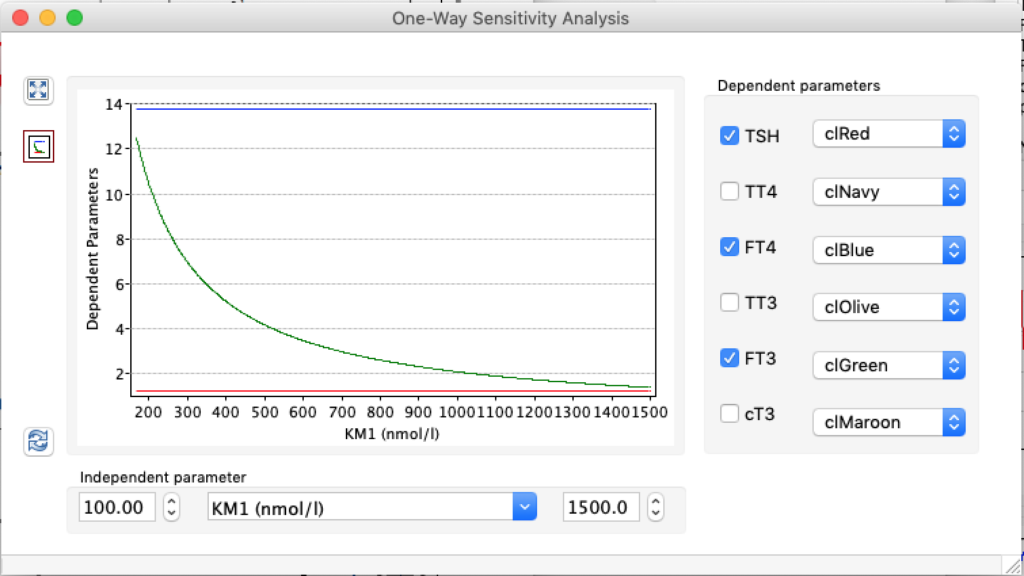
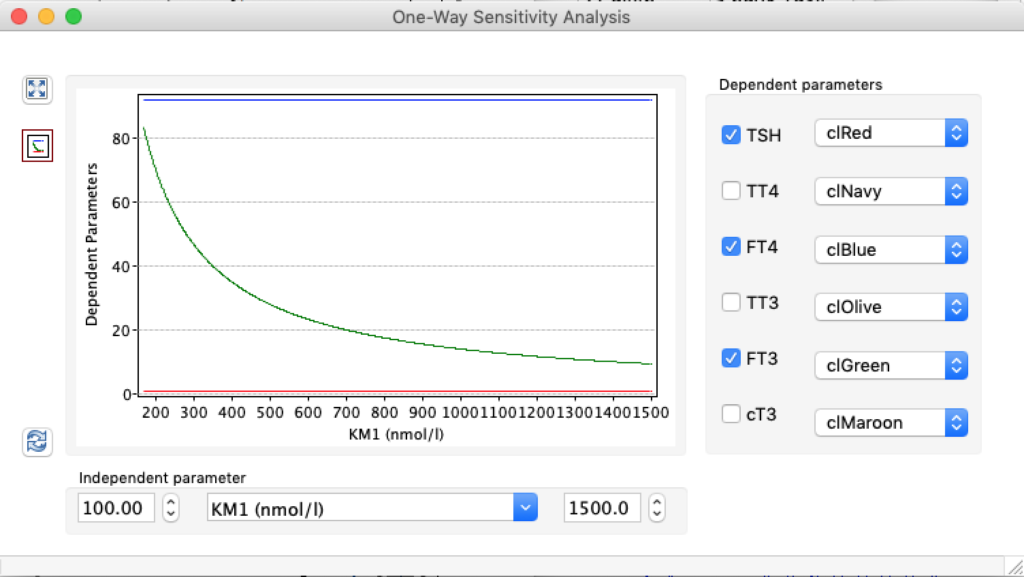
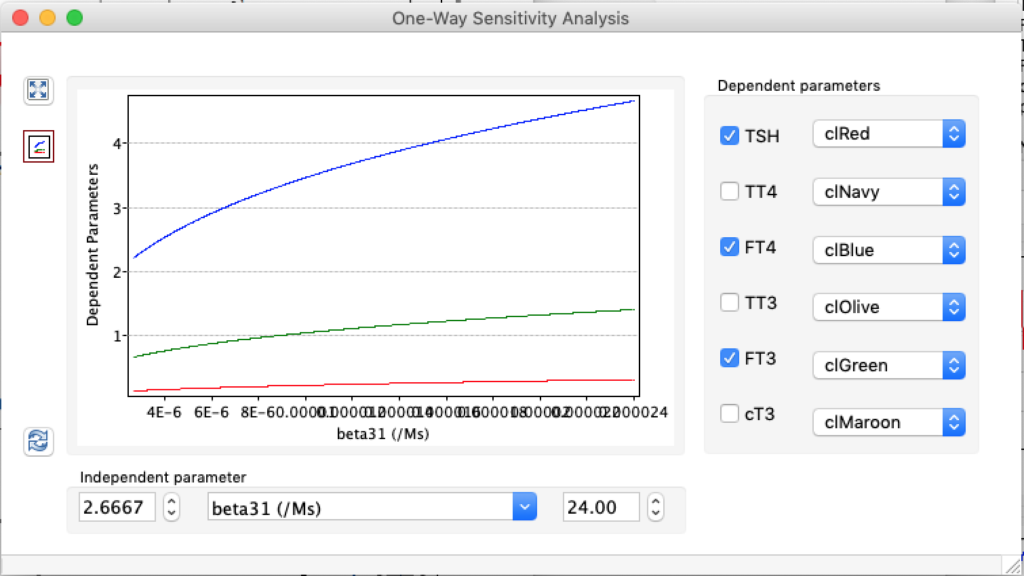
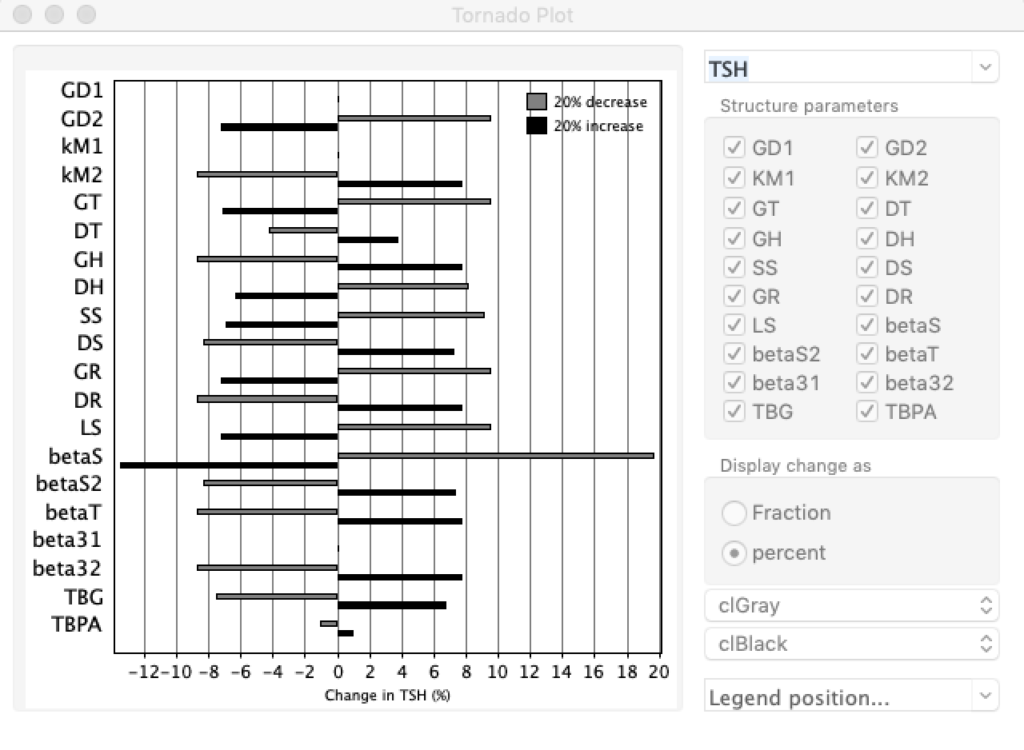
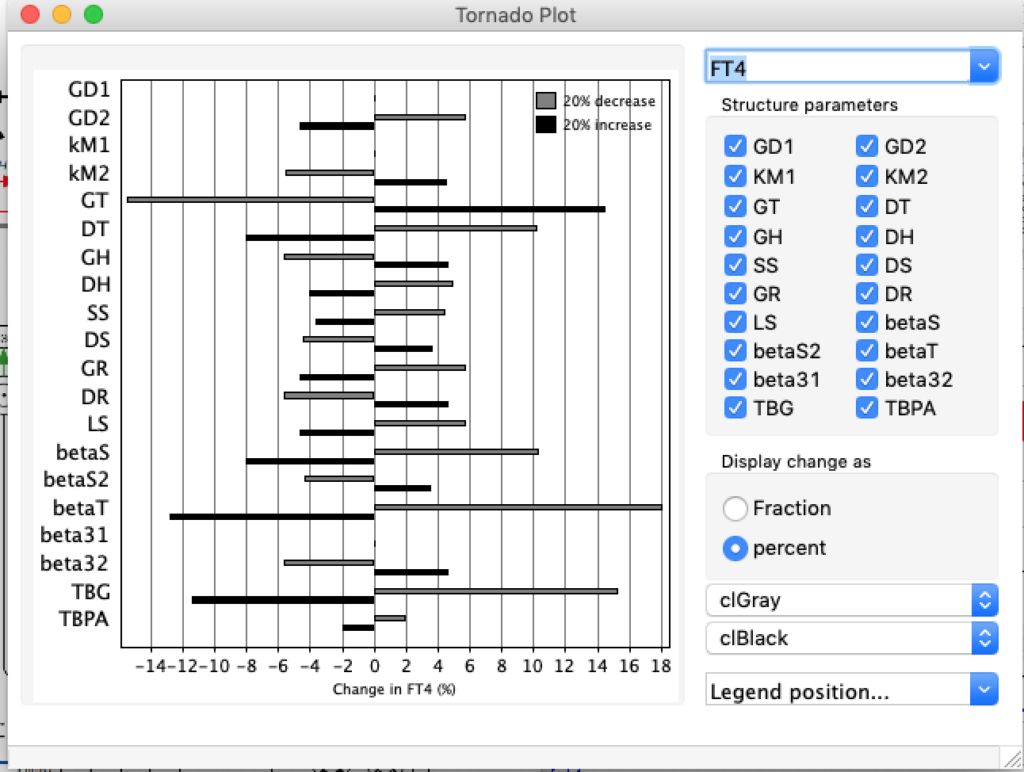
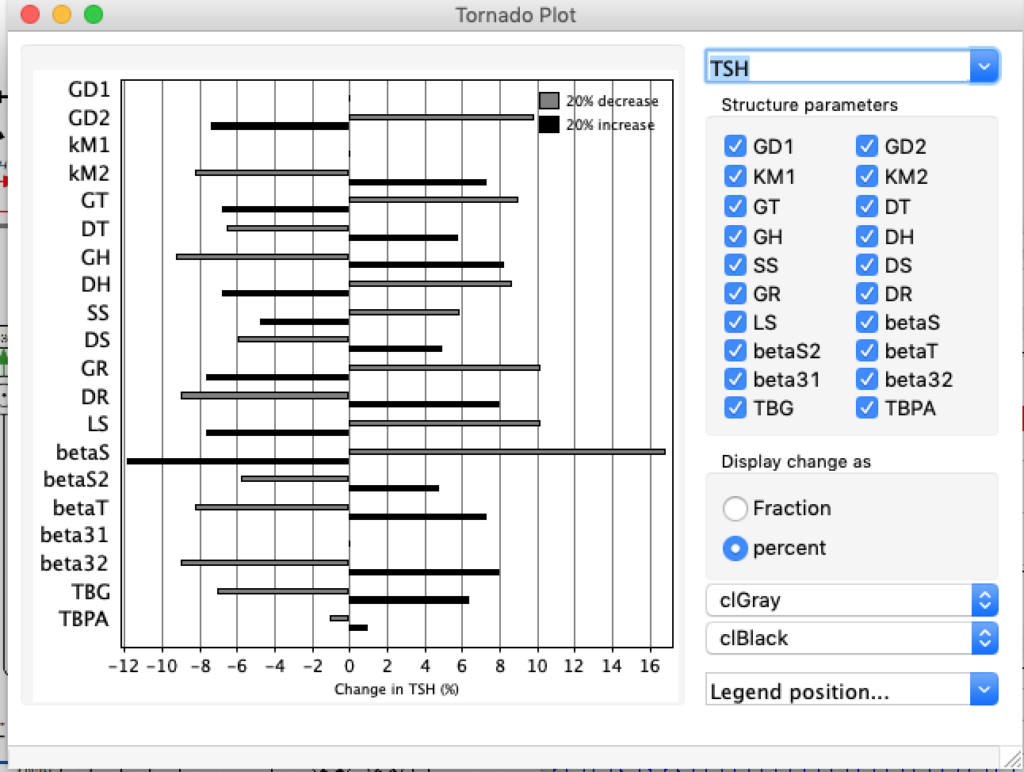
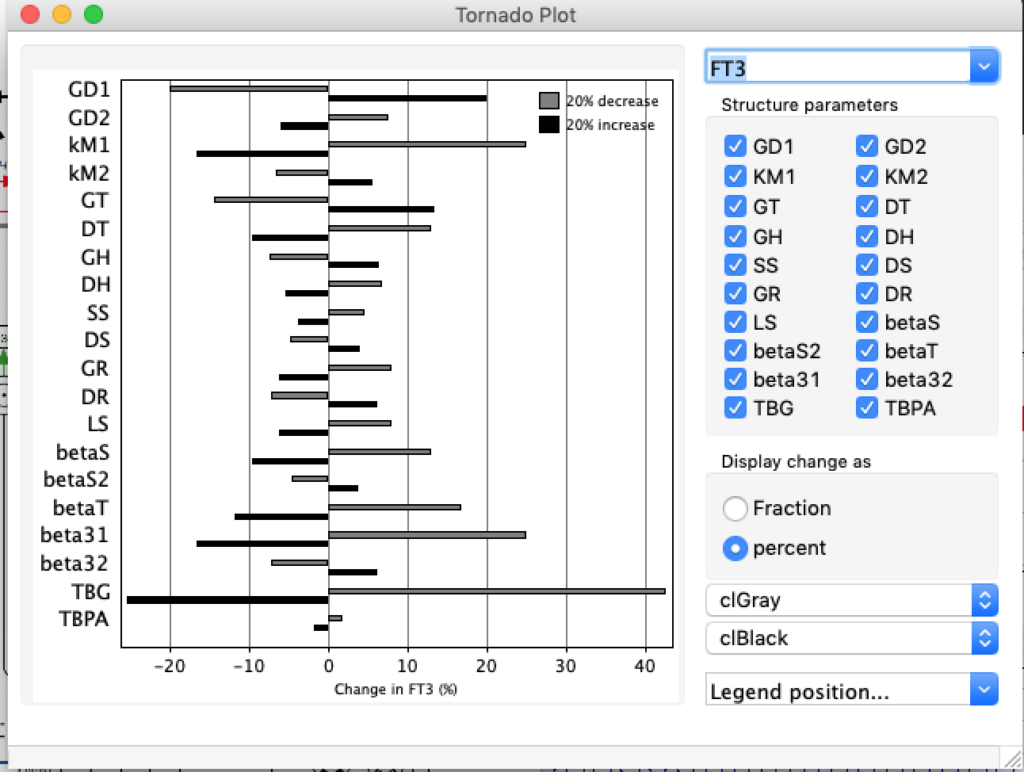
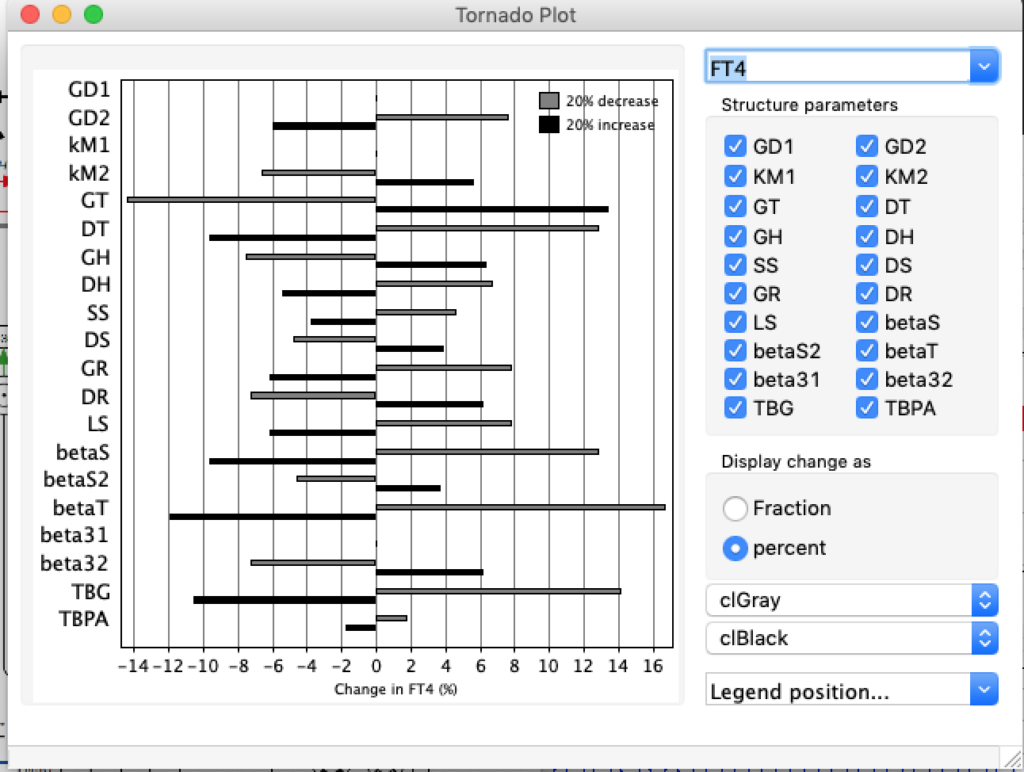
When keeping all other parameters constant, the damping constant of the main regulatory loop (LS) was found to differ significantly in the hypothyroid, euthyroid or hyperthyroid ranges (table 1). Similar to the gradients in the log TSH-FT4 relation, dampening constants (LS) differed in the different thyroid function states. Sensitivity analysis could, at least partly, explain the observed differences on the basis of distinct regulatory patterns that are operative under different conditions.
Hence, Hoermann et al propose a hierarchical type of control (see The Circle) exerted by a multimodal process with several controllers (shown in Simthyr as Constant Structures Parameters) and separate operating ranges of each controller. (See: Supplemental Material in Berberich J, Dietrich JW, Hoermann R and Müller MA (2018) Mathematical Modeling of the Pituitary–Thyroid Feedback Loop: Role of a TSH-T3 -Shunt and Sensitivity Analysis. Front. Endocrinol. 9:91. doi: 10.3389/fendo.2018.00091
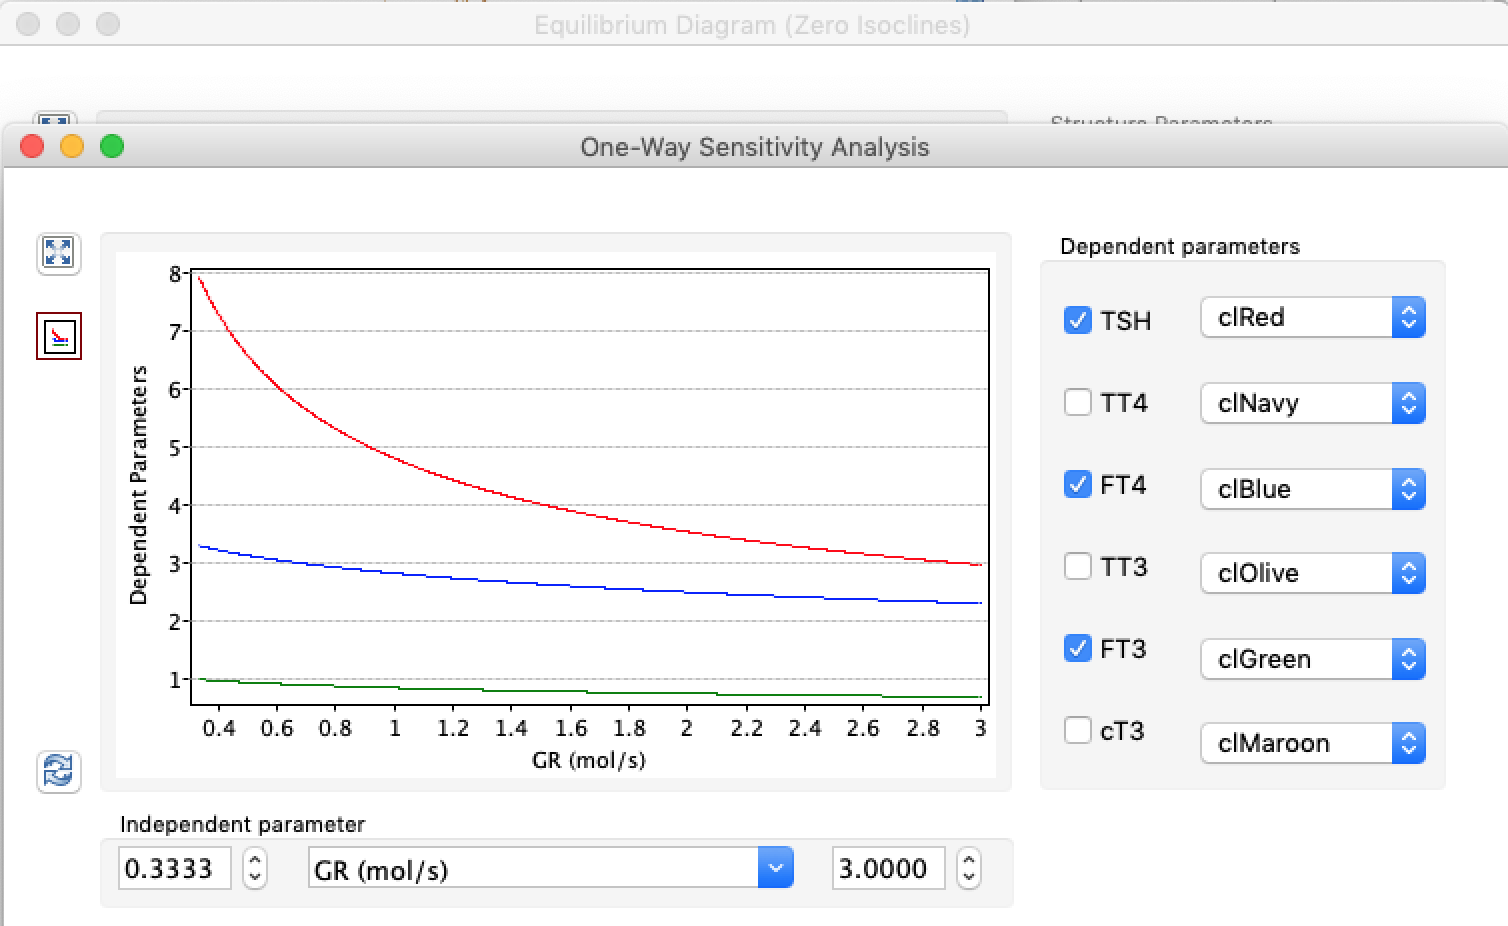
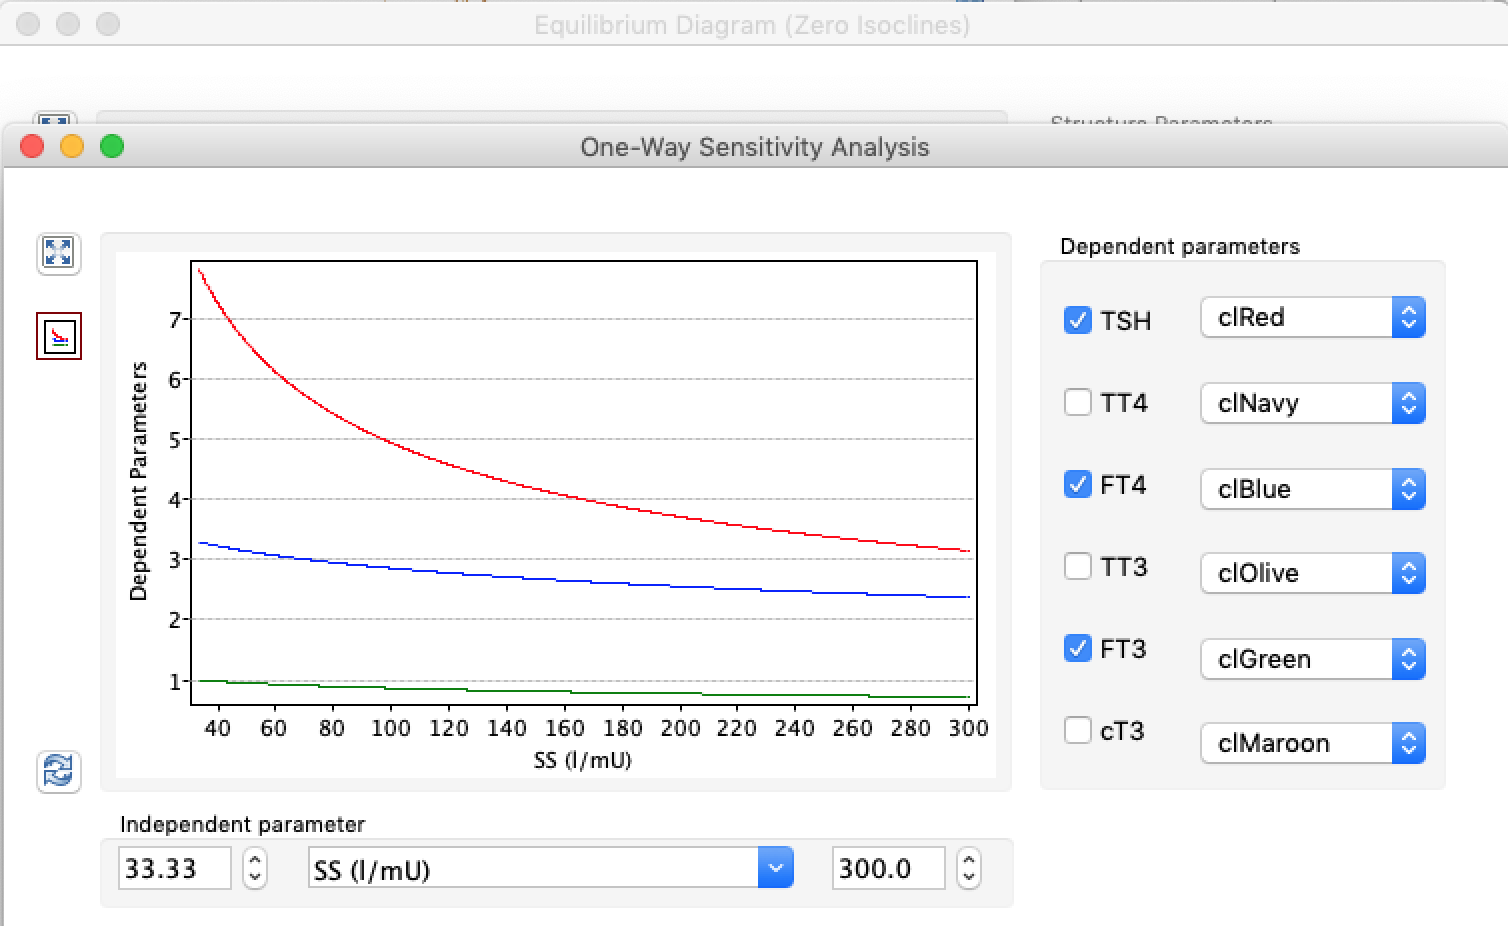
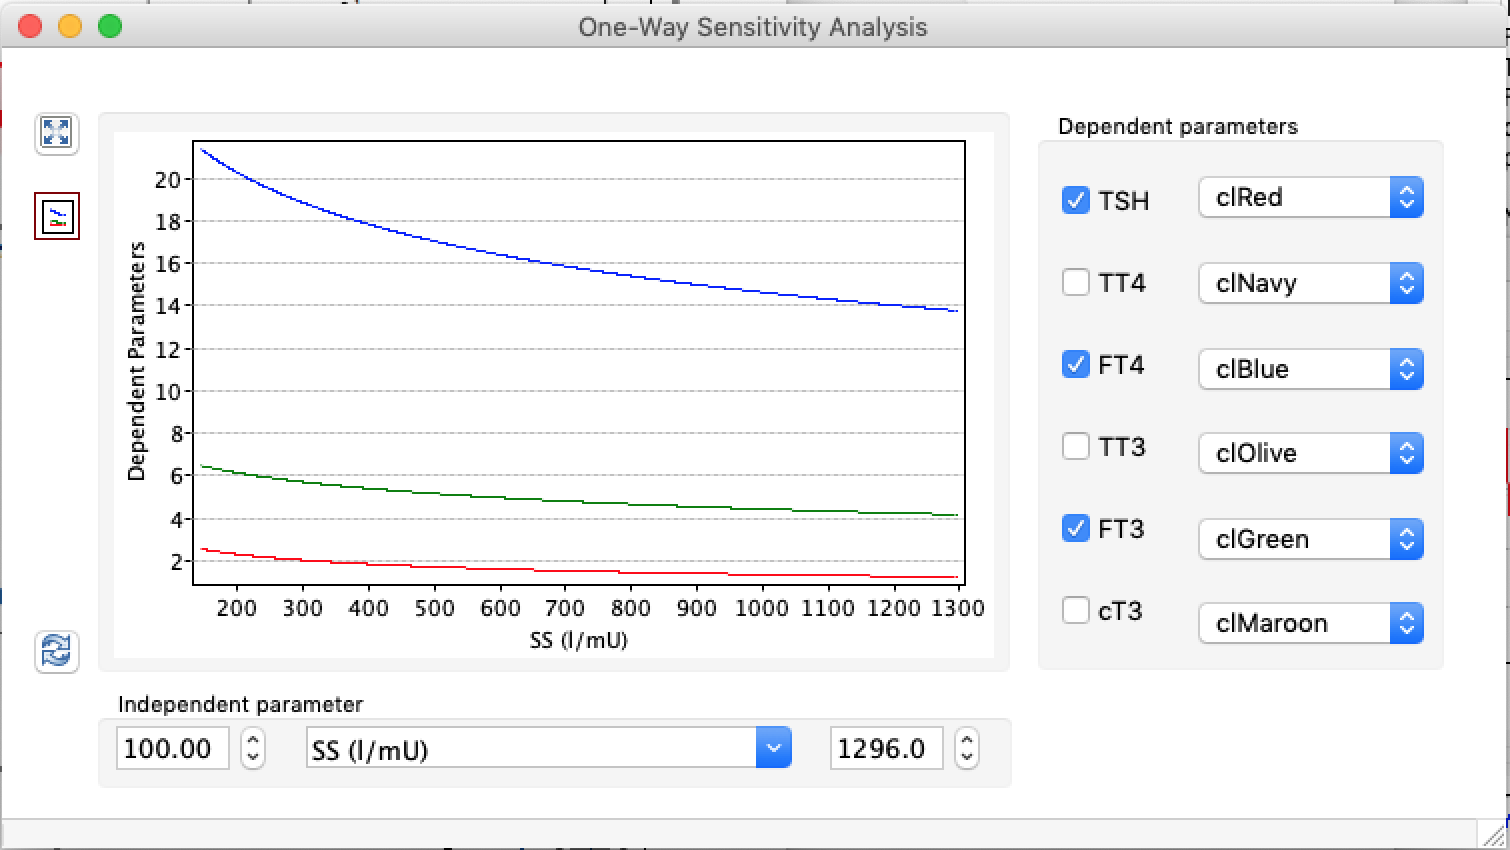
Thus, the classical FT4-TSH feedback regulation represented by the parameters GT, GR, DR and LS appears to be more actively involved in TSH regulation in the hyperthyroid state,
.