I stumbled over this image the other day – mixing together two images. Yet recreated in R.
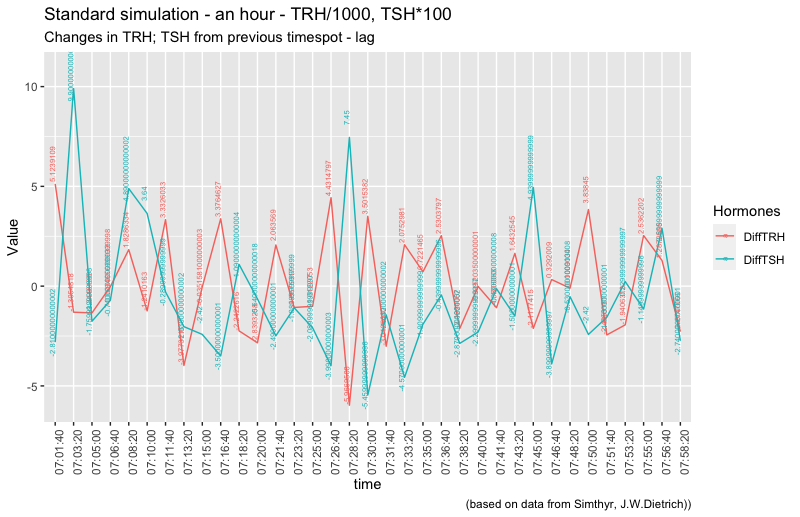
For many of the registrations, you see that there is an opposite movement in TRH and TSH. Though there are registrations where this is not the case. What is the reason? I will, later on, dig into the patterns of the other parameters to look for an explanation.
Looking at TT4 and FT4 gives another picture
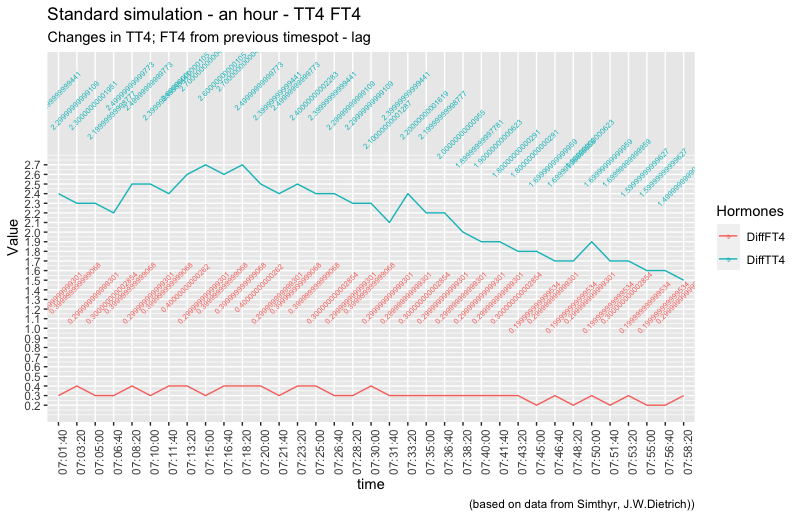
During this time period, it seems as if both total and free T4 is dropping. I will, later on, insert either TSH or TRH to see if there is a pattern to comment on.
TT3 and FT3 have a pattern totally on their own:
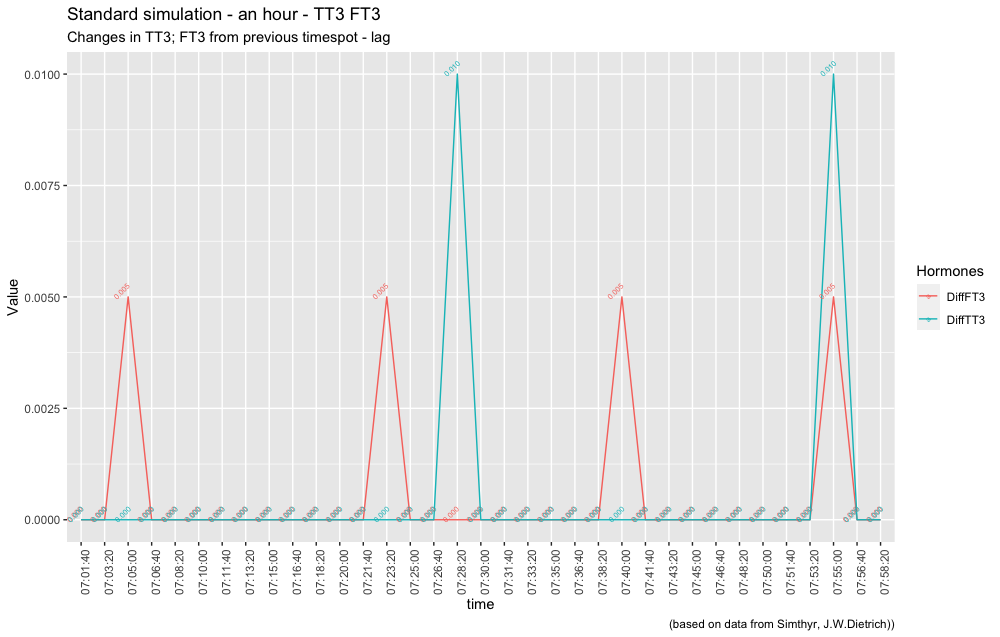
Subtle spikes of either FT3 or TT3 during one hour – this is interesting and totally different from the other patterns.
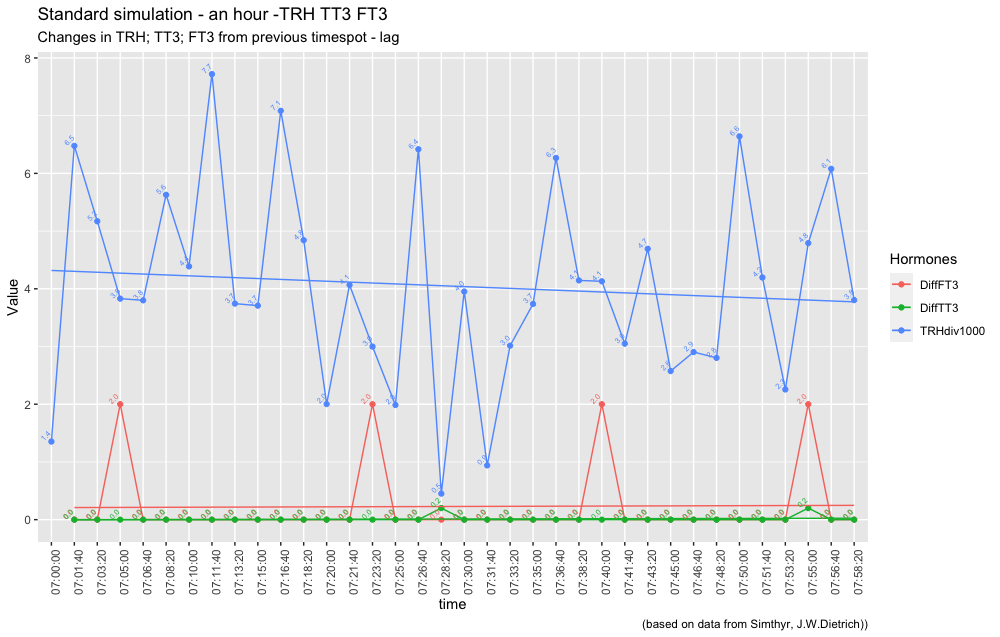
As can be seen – the TRH decrease and in this image, we can see the intervals of FT3 spikes shortens. (Update 23-11-2021) If this pattern also exists in vivo it means that it is difficult to capture the T3 changes as the halflife of T3 is short.
This post will be updated with the same data from a hypothyroid simulation – looking into the changes in the thyroid hormones during hypothyroidism. (19-11-2021)
| Standard figures hour split into quartiles | ||||
| 1 q minutes | 2 q minutes | 3 q minutes | 4 q minutes | |
| FT3_pmol.l | ||||
| Max | 5.6233 | 5.6234 | 5.6235 | 5.6236 |
| Mean | 5.623267 | 5.623344 | 5.623433 | 5.623533 |
| Min | 5.6232 | 5.6233 | 5.6234 | 5.6235 |
| SD | 5E-05 | 5.3e-05 | 5E-05 | 5E-05 |
| FT4_pmol.l | ||||
| Max | 18.6077 | 18.6109 | 18.6137 | 18.6159 |
| Mean | 18.606256 | 18.609511 | 18.6125 | 18.614911 |
| Min | 18.6049 | 18.608 | 18.6113 | 18.6139 |
| SD | 0.00095 | 0.001001 | 0.000822 | 0.000672 |
| TRHdiv1000 | ||||
| Max | 7.720417 | 7.08441 | 6.267683 | 6.641718 |
| Mean | 4.678992 | 3.728701 | 3.770022 | 4.005787 |
| Min | 1.352853 | 0.451124 | 0.939859 | 2.25577 |
| SD | 1.84202 | 2.154548 | 1.435854 | 1.569699 |
| TSH_mU.l | ||||
| Max | 2.7315 | 2.6841 | 2.5769 | 2.4747 |
| Mean | 2.667311 | 2.630967 | 2.491 | 2.4117 |
| Min | 2.5719 | 2.557 | 2.4253 | 2.3814 |
| SD | 0.055473 | 0.037612 | 0.053888 | 0.030551 |
| TT3_nmol.l | ||||
| Max | 3.3796 | 3.3797 | 3.3797 | 3.3798 |
| Mean | 3.3796 | 3.379611 | 3.3797 | 3.379733 |
| Min | 3.3796 | 3.3796 | 3.3797 | 3.3797 |
| SD | 0 | 3.3e-05 | 0 | 5E-05 |
| TT4_nmol.l | ||||
| Max | 128.4115 | 128.434 | 128.4528 | 128.468 |
| Mean | 128.401744 | 128.424311 | 128.444867 | 128.461456 |
| Min | 128.3923 | 128.4142 | 128.4363 | 128.4546 |
| SD | 0.006533 | 0.006775 | 0.005693 | 0.00463 |
Update (22-11-2021)