Pilo 1 overview

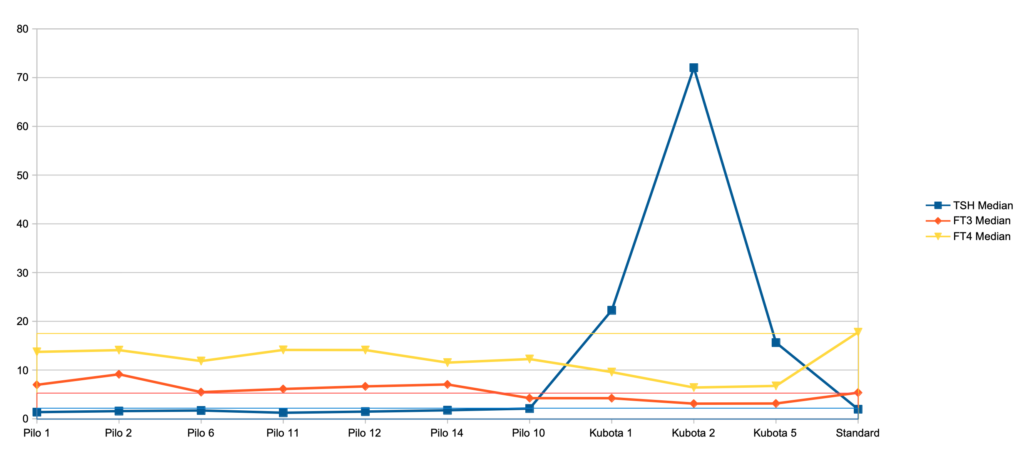
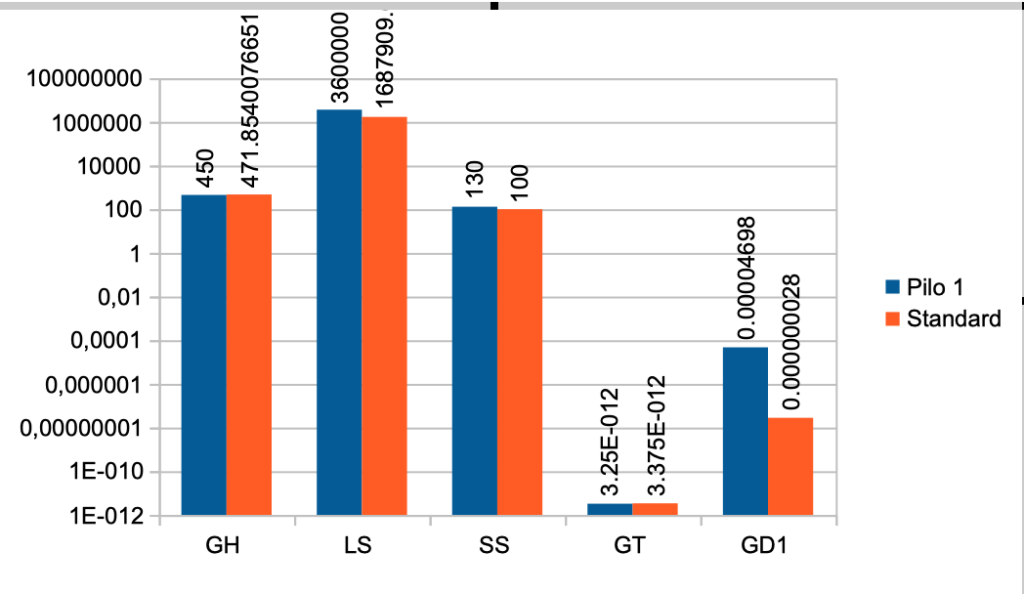
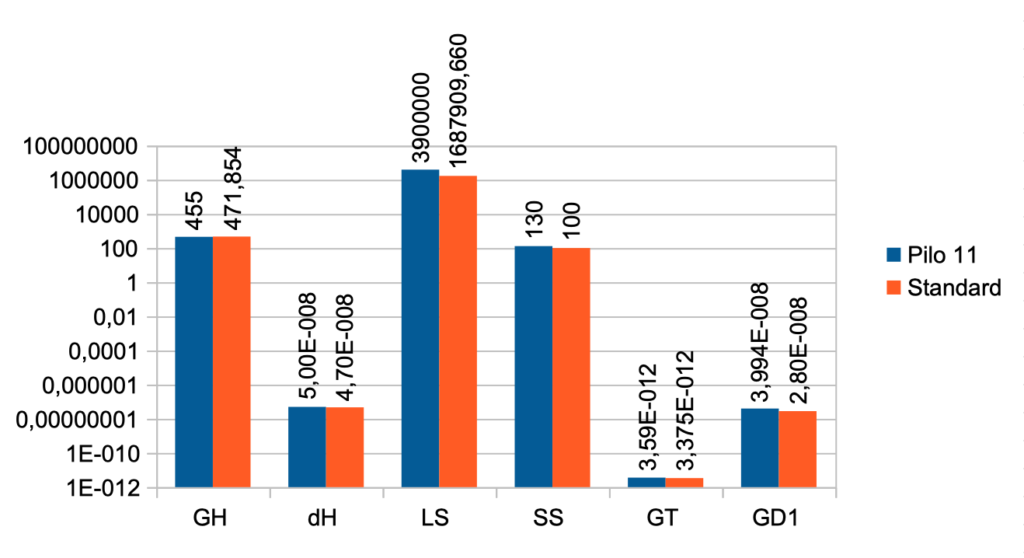
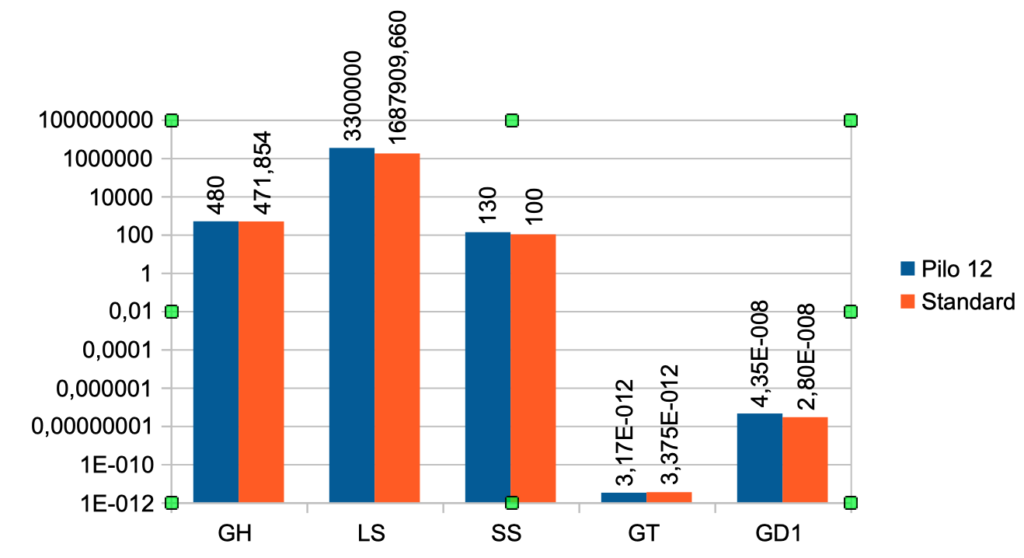
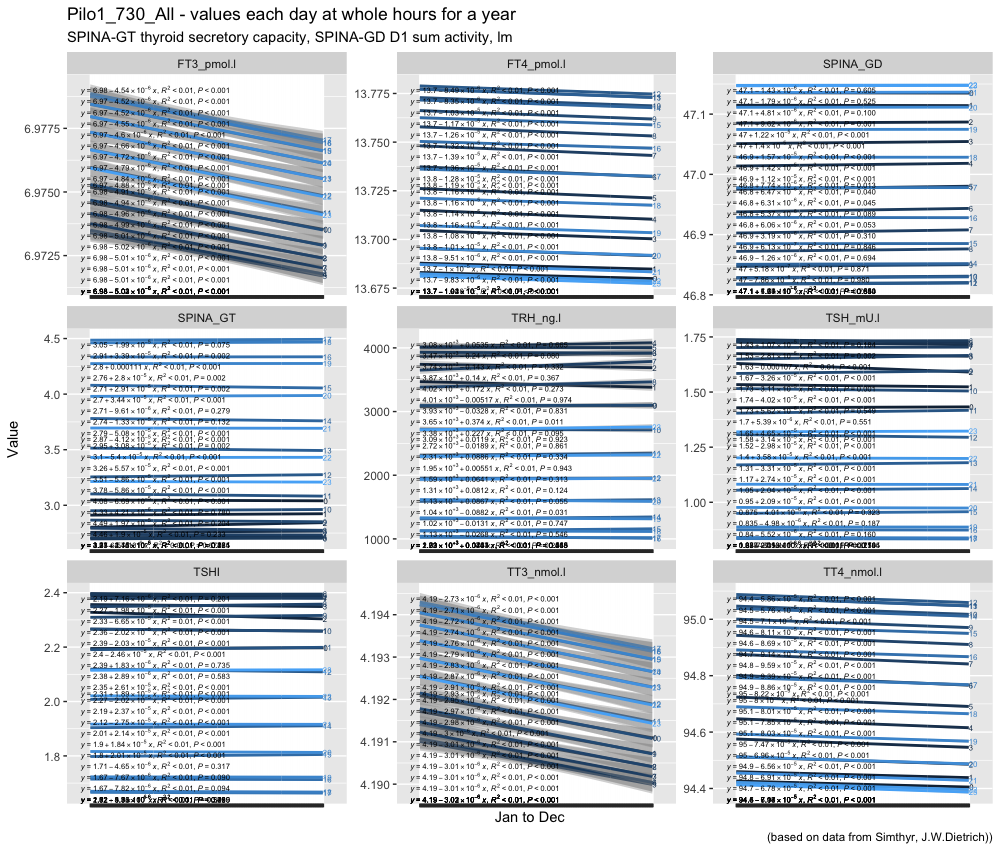
Objective: To visualize different computer-based scenarios from Simthyr with the help of RStudio and different packages. Pilo 1 summary reflects the values at 7.00 o’clock each day for a year.

Three distinct SPINA-GD categories defining poor (<23 nmol/s), intermediate (23–29 nmol/s) or good (>29 nmol/s) converters. (LINK)

Pilo 1 skim_summary all year reflects the values at any time during a year.

The profile of the histogrammes in the summaries shows the differences in the profile.

From the information of the Pilo 1 file:

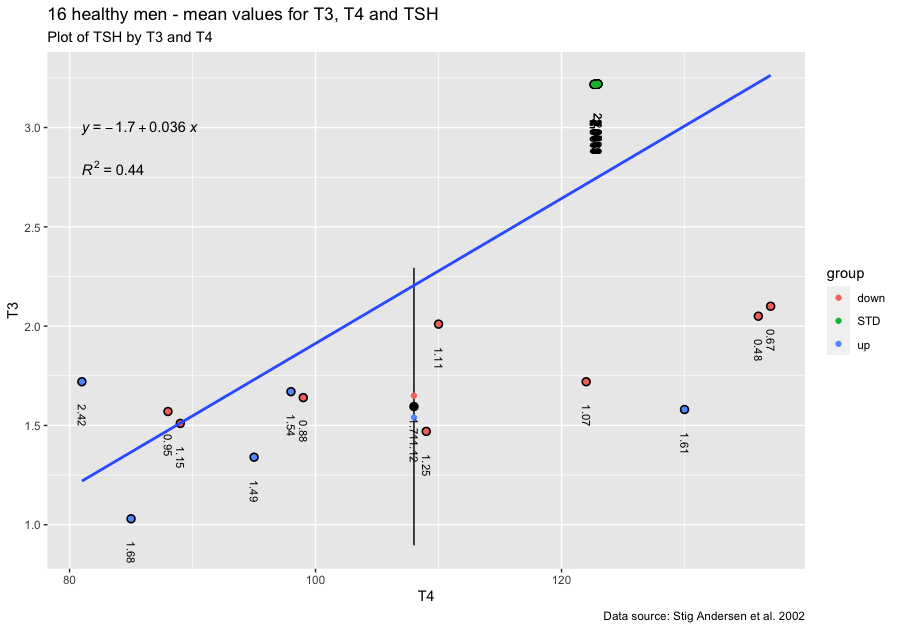
Case No. 1 from Pilo et al. showing slight hyperdeiodination and high conversion rate [Pilo A, Iervasi G, Vitek F, Ferdeghini M, Cazzuola F, Bianchi R. Thyroidal and peripheral production of 3,5,3′-triiodothyronine in humans by multicompartmental analysis. Am J Physiol. 1990 Apr;258(4 Pt 1):E715-26. PubMed PMID: 2333963.] LINK

Slight hyperdeiodination:
may lead to suppressed TSH levels,
Isolated high-T3 syndrome with normal or even low FT4 levels is a rare form of NTIS that is caused by hyperdeiodination.
Recently, the first case of thyroid hormone receptor alpha mutation was reported. The phenotypical pattern consisted in skeletal abnormalities, microsomia, constipation, and hyperdeiodination. (LINK)

High conversion rate:
– From a systems biologic perspective, thyroid homeostasis is a processing structure whose signalling is implemented by two different mechanisms, conversion and relaying.
– Another example of conversion processes is transport of thyroid hormones by plasma and transmembrane transporters.
– A large portion of thyroxine binds reversibly to plasma proteins. Only a small free fraction (0.02% to 0.03%) is available for conversion to T3 and transport to cytoplasm. T3 is formed from T4 by 5′ deiodination at the outer ring by type 1 deiodinase predominantly in liver, kidney, and thyroid. Type 2 deiodinase mediates intracellular deiodination in glial cells, pituitary, brown adipose tissue, skeletal muscle, and placenta [19]. Obviously, intracellular deiodination facilitates feedback at the pituitary level by providing a mainly T4-dependent mechanism, which is faster than one that would depend on T3 from systemic circulation [20]. In addition, T3 is regulated by nonthyroidal factors, first of all peripheral deiodination [19, 2125] that is subject of multiple metabolic control inputs [19, 2630], which would also render a primarily T3-dependent feedback mechanism ineffective. High pituitary DIO2 expression rate ensures operative feedback despite T4-induced ubiquitination of type 2 deiodinase [31].(LINK)

Hyperdeiodination compensates for beginning thyroid failure (LINK)

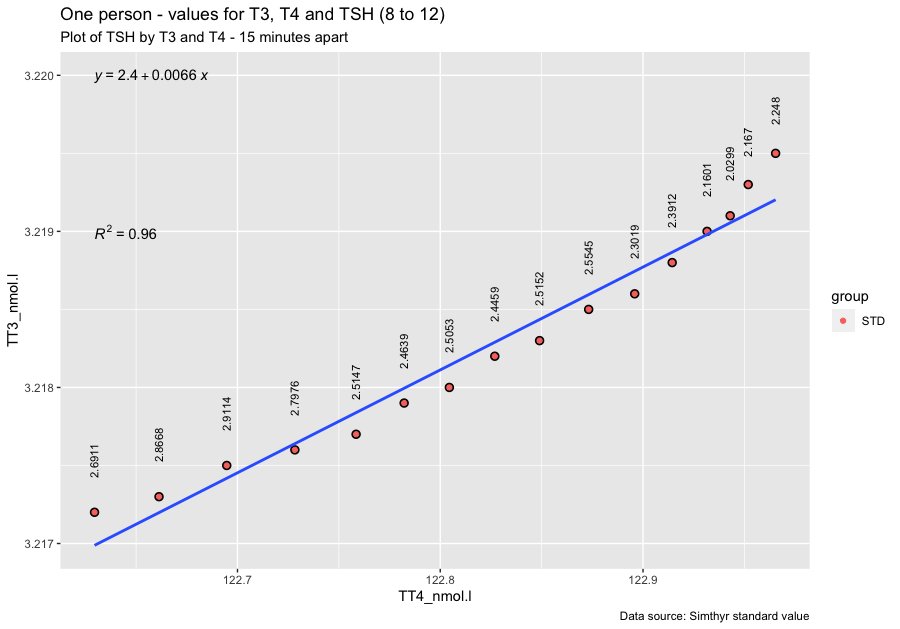
A correlation only shows if there is a relationship between variables. (LINK)

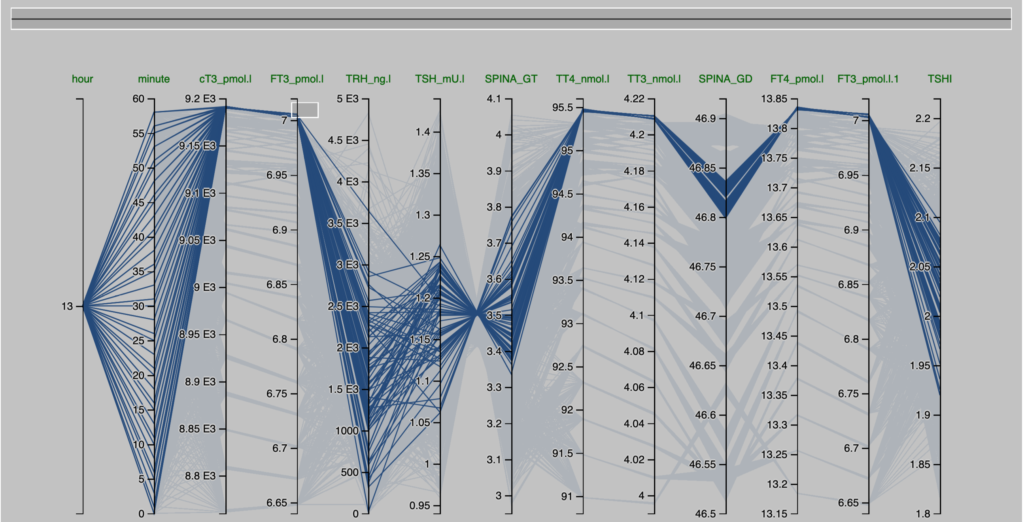
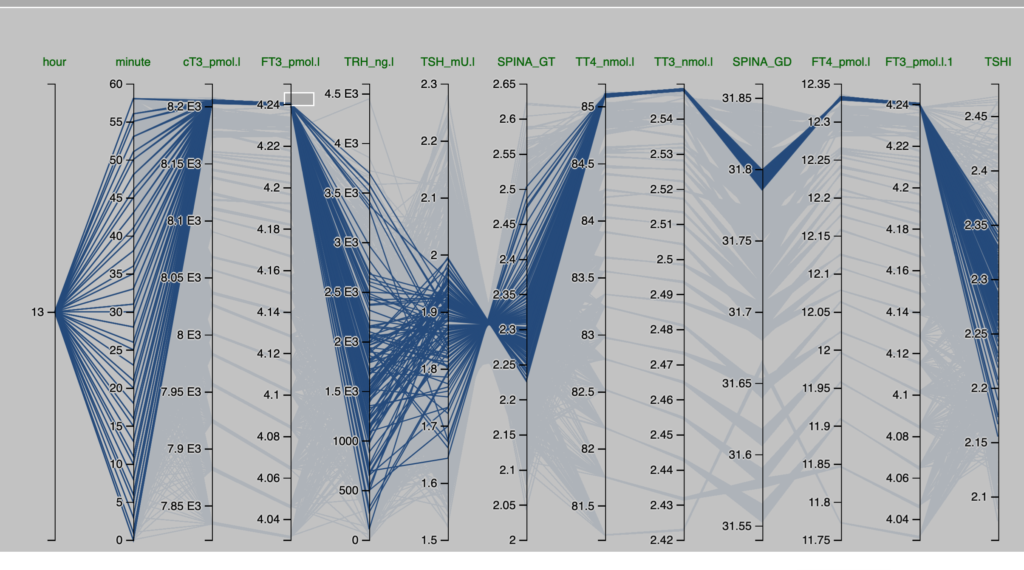
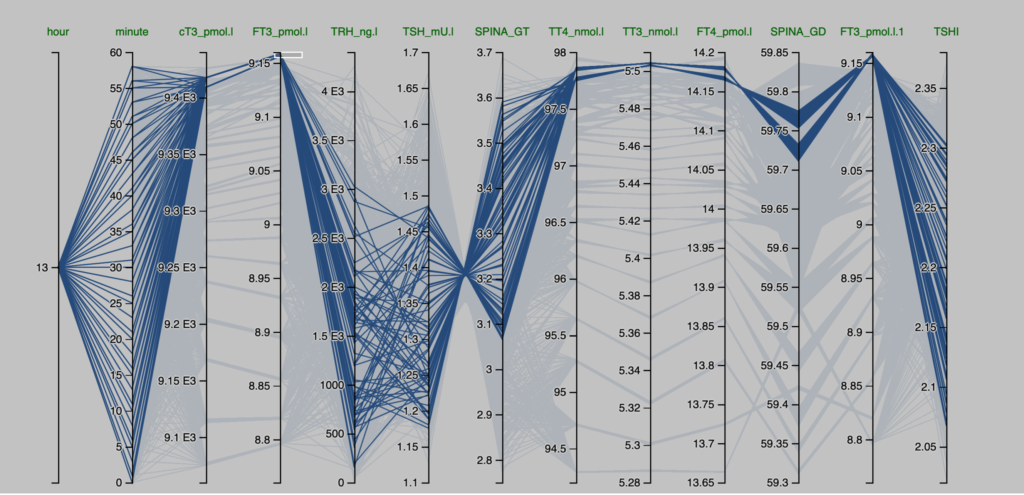
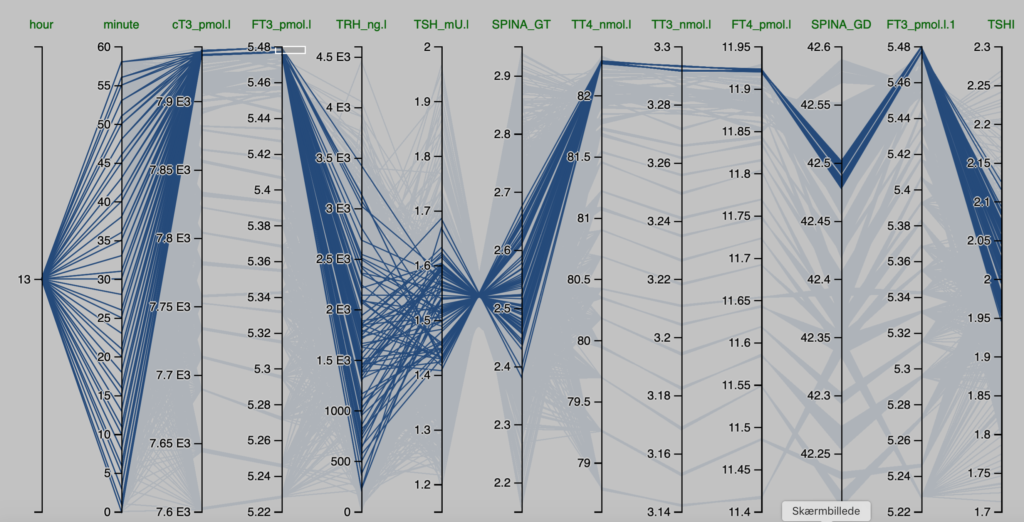
Looking at SPINA-GD and the correlation with T4 and T3 and comparing the three hours from 7 to 9 with figures for the whole year shows that the T3 values differs markedly.

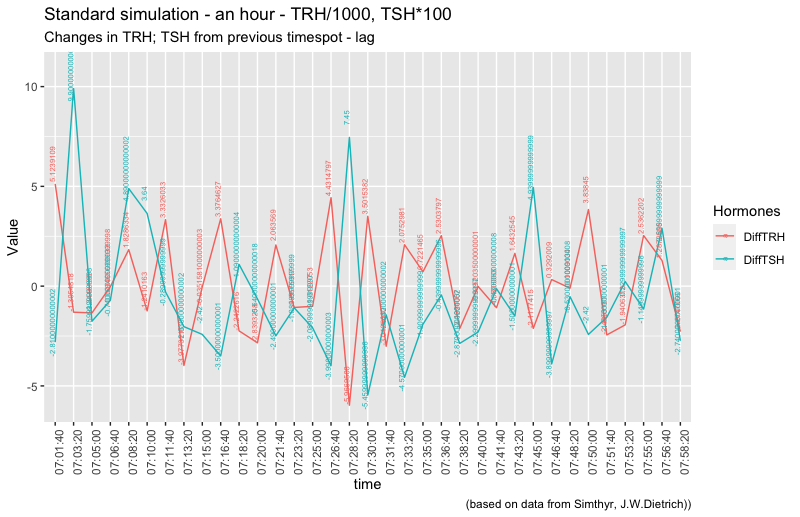
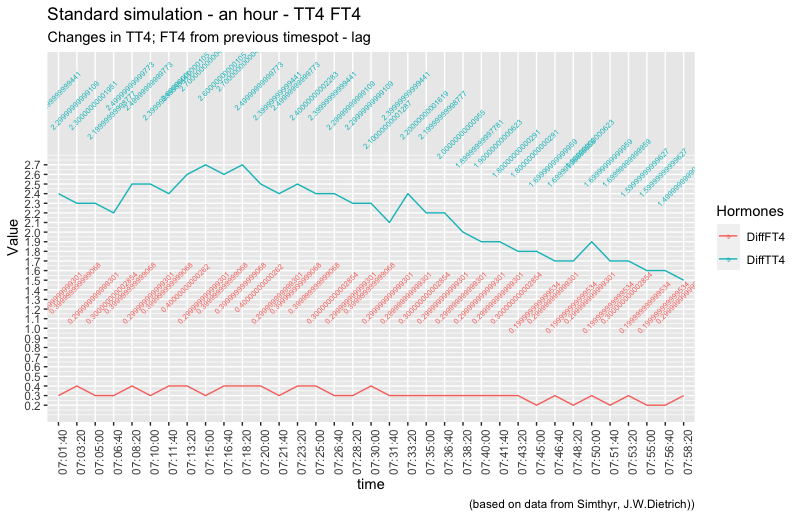
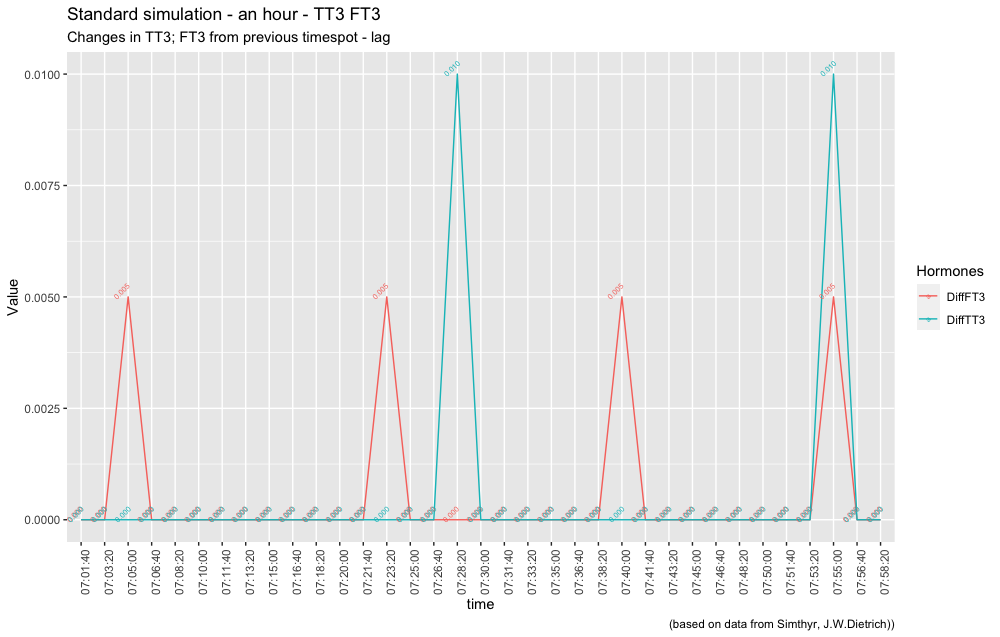
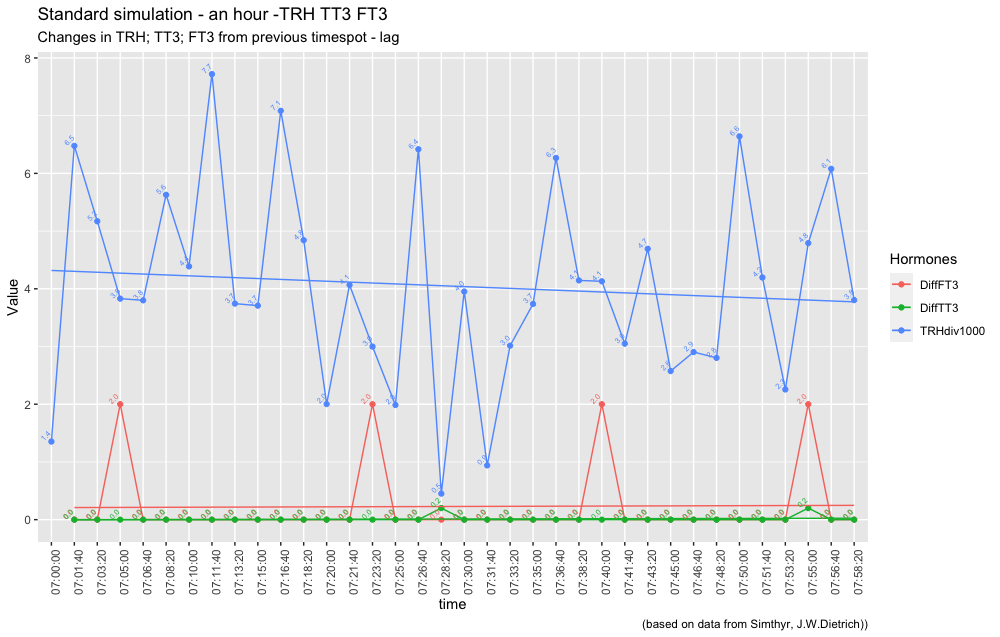
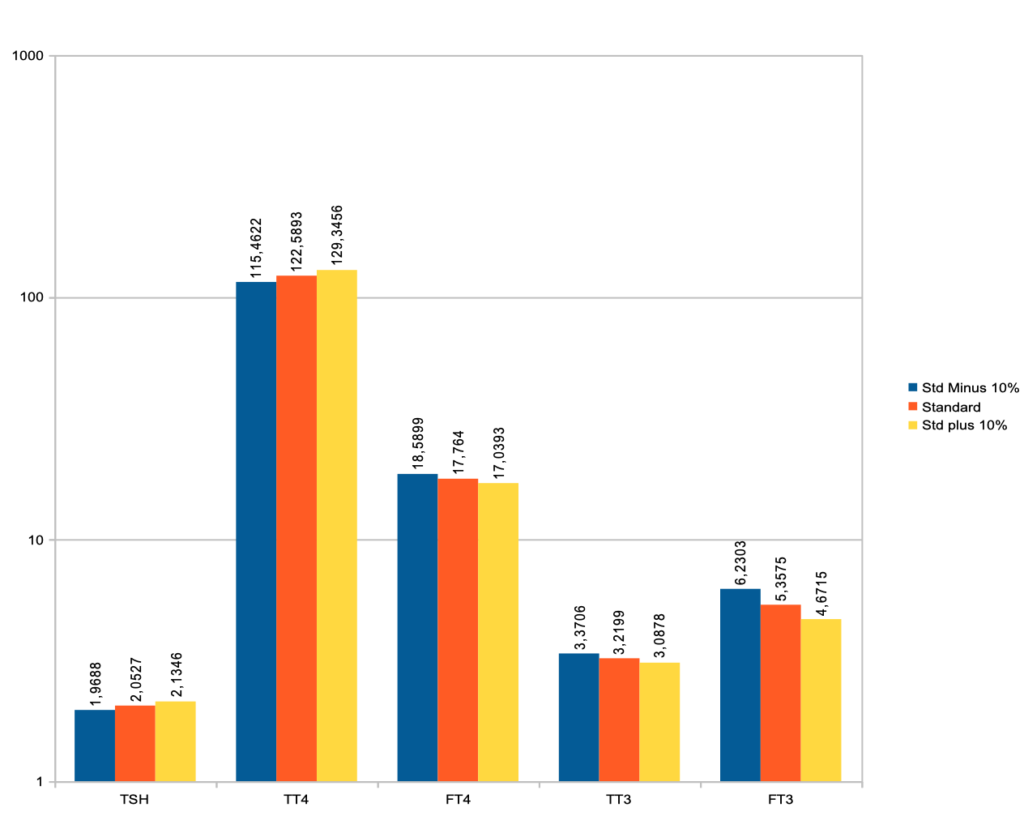
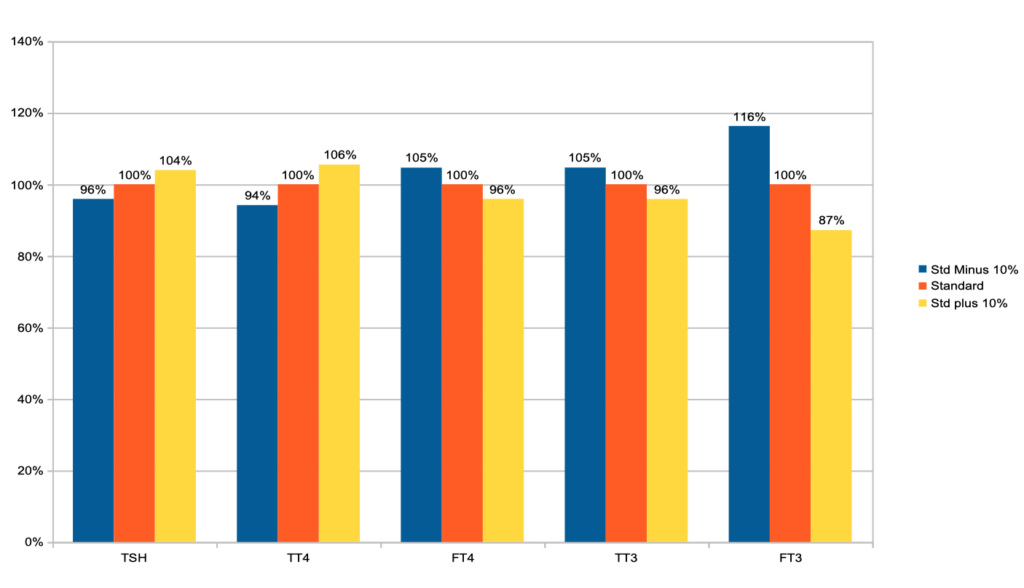
Deliberate overplotting! Showing that most of the parameters change significantly within each hour over a year.

Looking specifically at the three hours normally used for drawing blood for testing TSH, T3 and T4. Again TRH is different from the other values.

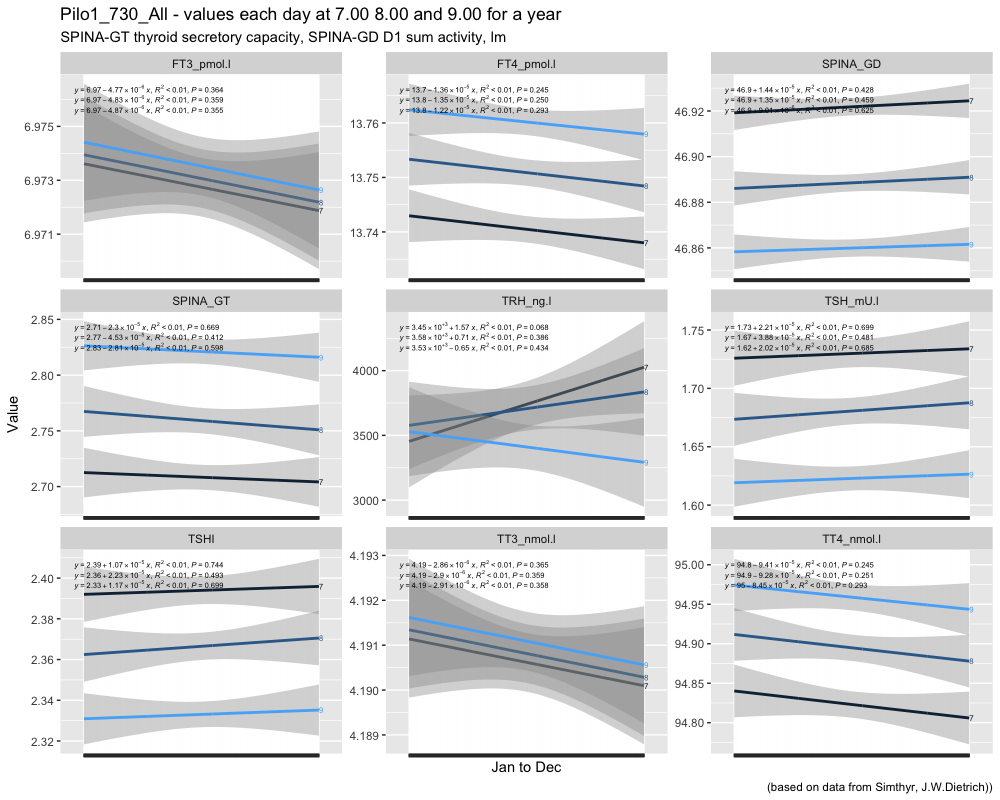
I am not able to explain the differences in P-values from the whole year compared to the three selected hours.

7.00 o’clock TSH compared to TSH (mean whole-year 1,3256) with a one sample t-test:

t = 67.191, df = 364, p-value < 2.2e-16 (0,00000000000000022)
alternative hypothesis: true mean is not equal to 1.3256 (The mean whole-year TSH value)

8.00 o’clock TSH compared to TSH (mean whole-year) with a one sample t-test:

t = 61.288, df = 364, p-value < 2.2e-16
alternative hypothesis: true mean is not equal to 1.3256

9.00 o’clock TSH compared to TSH (mean whole-year) with a one sample t-test:

t = 56.799, df = 364, p-value < 2.2e-16
alternative hypothesis: true mean is not equal to 1.3256

Looking into finding perspectives on the figures I read the Data Science Live Book and experimented with MIME, MIC and MAS. This lead to the following plot based on a sample of 32.000 observations (from a 315.361 obs. from the thyroid hormones during a year). TRH, TSH, TT4, FT4, TT3 and FT3 are shown.

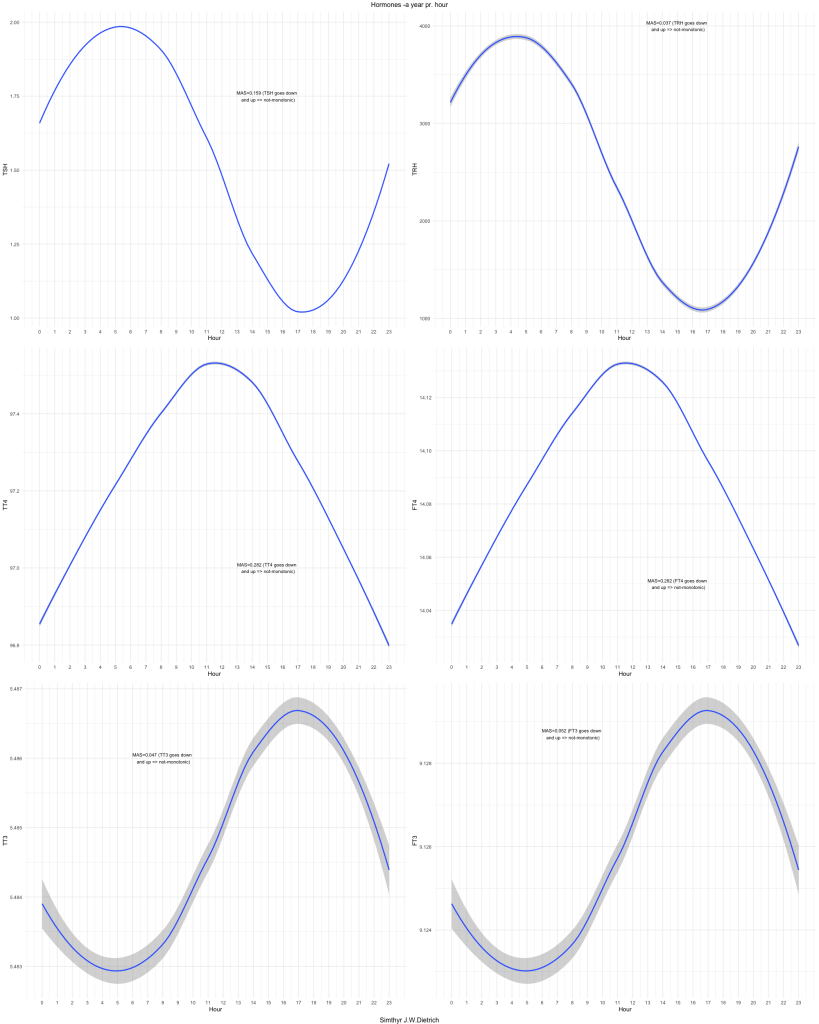
Maximum Asymmetry Score tells you if the figures have one direction (up/down) = monotonic or goes up-down or down up = non-monotonic.

In order to be able to reduce the time for calculation of MAS I have checked the effect of the size of the three different subsets 3.200, 32.000, 315.361:

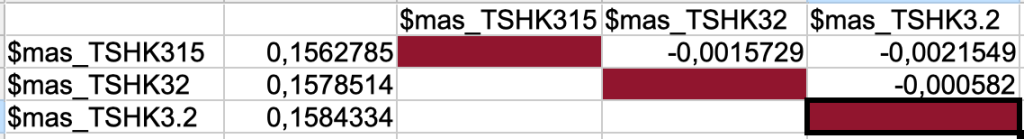
I will for the rest of the plots and calculations use 3.200 as the subset.

(07.01.2022) to be continued…..

Changes

I stumbled over this image the other day – mixing together two images. Yet recreated in R.

Subtracting from the day before – lag – gives this pattern in TSH and TRH when looked at through Simthyr.

For many of the registrations, you see that there is an opposite movement in TRH and TSH. Though there are registrations where this is not the case. What is the reason? I will, later on, dig into the patterns of the other parameters to look for an explanation.

Looking at TT4 and FT4 gives another picture

Subtracting from the day before – lag – gives this pattern in TT4 and FT4 when looked at through Simthyr.

During this time period, it seems as if both total and free T4 is dropping. I will, later on, insert either TSH or TRH to see if there is a pattern to comment on.

TT3 and FT3 have a pattern totally on their own:

Subtracting from the day before – lag – gives this pattern in TT3 and FT3 when looked at through Simthyr.

Subtle spikes of either FT3 or TT3 during one hour – this is interesting and totally different from the other patterns.

As can be seen – the TRH decrease and in this image, we can see the intervals of FT3 spikes shortens. (Update 23-11-2021) If this pattern also exists in vivo it means that it is difficult to capture the T3 changes as the halflife of T3 is short.

This post will be updated with the same data from a hypothyroid simulation – looking into the changes in the thyroid hormones during hypothyroidism. (19-11-2021)

Standard figures hour split into quartiles

1 q minutes2 q minutes3 q minutes4 q minutes
FT3_pmol.l


Max5.62335.62345.62355.6236
Mean5.6232675.6233445.6234335.623533
Min5.62325.62335.62345.6235
SD5E-055.3e-055E-055E-05
FT4_pmol.l


Max18.607718.610918.613718.6159
Mean18.60625618.60951118.612518.614911
Min18.604918.60818.611318.6139
SD0.000950.0010010.0008220.000672
TRHdiv1000


Max7.7204177.084416.2676836.641718
Mean4.6789923.7287013.7700224.005787
Min1.3528530.4511240.9398592.25577
SD1.842022.1545481.4358541.569699
TSH_mU.l


Max2.73152.68412.57692.4747
Mean2.6673112.6309672.4912.4117
Min2.57192.5572.42532.3814
SD0.0554730.0376120.0538880.030551
TT3_nmol.l


Max3.37963.37973.37973.3798
Mean3.37963.3796113.37973.379733
Min3.37963.37963.37973.3797
SD03.3e-0505E-05
TT4_nmol.l


Max128.4115128.434128.4528128.468
Mean128.401744128.424311128.444867128.461456
Min128.3923128.4142128.4363128.4546
SD0.0065330.0067750.0056930.00463

Update (22-11-2021)

Index of individuality and Simthyr

Stig Andersen et al. (1.) 2002 has a table with figures for TSH, TT3, and TT4. With Simthyr I have generated 16 values in intervals of 15 minutes from 8 to 12 o’clock. Of notice is the values for the 16 men and the simulated person from SimThyr the levels in the study are lower than that of the simulated person.

Notice the difference in mean T3 and TSH values between the 16 healthy men (down and up) and the simulated person from SimThyr (STD). The 16 figures from SimThyr are hard to read I have extracted the figures here:

None of these 16 pairs of values are alike. They change slightly over the period of time where most people are having drawn their laboratory tests.

The interactive graph below (opens slowly in a new window) shows the same picture. It is possible easily to identify how different the values are for each individual visualizing the index of individuality. Let the curser hit the dots and view the different patterns.

https://www.glensbo.dk/Files/sa1.html

References:

  1. Stig Andersen, Klaus Michael Pedersen, Niels Henrik Bruun, Peter Laurberg, Narrow Individual Variations in Serum T4 and T3 in Normal Subjects: A Clue to the Understanding of Subclinical Thyroid Disease, The Journal of Clinical Endocrinology & Metabolism, Volume 87, Issue 3, 1 March 2002, Pages 1068–1072, https://doi.org/10.1210/jcem.87.3.8165
  2. Simthyr – or here on these pages

SimThyr – pattern

I have done a little experiment. Subtracted ten and added ten percent to the standard parameters and “surprisingly” it gave the following pattern:

Notice the y axis is logaritmic.

What is obvious from this chart is that there are opposite effects of the parameters on the TSH and the thyroid hormones:

In FT3 there are effects above the ten percent (16% above and 13% below)

Scenarios – observations 1

Pilo (1) and Kobuta (2) are different scenarios and here we have looked into TSH, FT3 and FT4 from the Simthyr model.

Below you find the description of the Pilo scenarios (The Kubota scenarios will follow later in the text) – The last entry is the figures for the standard scenario in SimThyr:

Case No. 1 from Pilo et al. showing slight hyperdeiodination and high conversion rate
The FT3 value is 6,97 a little higher than the standard value (5,36)
The FT4 value is lower than the standard value (17,76) – Pilo 1 (13,72)
The TSH value is 1,36 and the standard value is 1,96
Pilo 1 GH < (lower than) standard. See the effect of GH here
Pilo 1 LS > (higher than) standard. See the effect of LS here
Pilo 1 SS > standard. See the effect of SS here
Pilo 1 GT < standard. See the effect of GT here
Pilo 1 GD1 > standard. See the effect of GD1 here
(Diagram)
Case No. 2 from Pilo et al. showing slight hyperdeiodination
The FT3 value is 9,13 a little higher than the standard value (5,36)
The FT4 value is lower than the standard value (17,76) – Pilo 2 (14,08)
The TSH value is 1,57 and the standard value is 1,96
Pilo 2 LS > standard. See the effect of LS here
Pilo 2 GT < standard. See the effect of GT here
Pilo 2 GD1 > standard. See the effect of GD1 here
(Diagram)
Case No. 6 from Pilo et al. with low secretion rate for T4
The FT3 value is 5,46 a little higher than the standard value (5,36)
The FT4 value is lower than the standard value (17,76) – Pilo 6 (11,84)
The TSH value is 1,70 and the standard value is 1,96
Pilo 6 LS > (higher than) standard. See the effect of LS here
Pilo 6 SS > standard. See the effect of SS here
Pilo 6 GT < standard. See the effect of GT here
Pilo 6 GD1 > standard. See the effect of GD1 here
(Diagram)
Case No. 11 from Pilo et al. with high secretion rate for T4
The FT3 value is 6,11 a little higher than the standard value (5,36)
The FT4 value is lower than the standard value (17,76) – Pilo 11 (11,84)
The TSH value is 1,23 and the standard value is 1,96
Pilo 11 GH < standard. See the effect of GH here
Pilo 11 dH < standard. See the effect of GH here
Pilo 11 LS > standard. See the effect of LS here
Pilo 11 SS > standard. See the effect of SS here
Pilo 11 GT < standard. See the effect of GT here
Pilo 11 GD1 > standard. See the effect of GD1 here
(Diagram)
Case No. 12 from Pilo et al. with high production rate for T3
The FT3 value is 6,64 a little higher than the standard value (5,36)
The FT4 value is lower than the standard value (17,76) – Pilo 12 (14,1)
The TSH value is 1,47 and the standard value is 1,96
Pilo 12 GH < standard. See the effect of GH here
Pilo 12 LS > standard. See the effect of LS here
Pilo 12 SS > standard. See the effect of SS here
Pilo 12 GT < standard. See the effect of GT here
Pilo 12 GD1 > standard. See the effect of GD1 here
(Diagram)
Case No. 14 from Pilo et al. with low production rate for T3 Coming soon
Case No. 10 from Pilo et al. with normal values for SPINA-GT and SPINA-GD
Case No. 1 from Kubota et al. showing latent (subclinical) hypothyroidism
Case No. 2 from Kubota et al. showing overt hypothyroidism
Case No. 5 from Kubota et al. showing overt hypothyroidism

Look hypophyseal secretory capacity (GH) up – LINK

  1. Pilo A, Iervasi G, Vitek F, Ferdeghini M, Cazzuola F, Bianchi R. Thyroidal and peripheral production of 3,5,3′-triiodothyronine in humans by multicompartmental analysis. Am J Physiol. 1990 Apr;258(4 Pt 1):E715-26. PubMed PMID: 2333963.
  2. Kubota S, Fujiwara M, Hagiwara H, Tsujimoto N, Takata K, Kudo T, Nishihara E, Ito M, Amino N, Miyauchi A. Multiple thyroid cysts may be a cause of hypothyroidism in patients with relatively high iodine intake. Thyroid. 2010 Feb;20(2):205-8. doi: 10.1089/t

Pilo 1 and 10

Observations from the Pilo scenarios
The figures are derived from Simthyr – based on the laboratory values for the persons in the Pilo study(1). The figures mimic what may be seen in humans with this condition.

Pilo 1 (showing slight hyperdeiodination and high conversion rate)Pilo 10 (with normal values for SPINA-GT and SPINA-GD)
These are the figures entered into SimThyr, as can be seen, these values are changed:
GH, LS, SS, GT, GD1
These are the figures entered into SimThyr, as can be seen, these values are changed:
LS, GT, GD1
alphaR = 0.4

betaR = 0.0023105

GR = 1

dR = 1E-10

alphaS = 0.4

betaS = 0.00023

alphaS2 = 260000

betaS2 = 140

GH = 450

dH = 4.7E-8

LS = 3600000

SS = 130

DS = 50

alphaT = 0.1

betaT = 1.1E-6

GT = 3.25E-12

dT = 2.75

alpha31 = 0.026

beta31 = 8E-6

GD1 = 4.698E-8

KM1 = 5E-7

alpha32 = 130000

beta32 = 0.00083

GD2 = 4.3E-15

KM2 = 1E-9

K30 = 2000000000

K31 = 2000000000

K41 = 20000000000

K42 = 200000000

Tau0R = 1800

Tau0S = 120

Tau0S2 = 3240

Tau0T = 300

Tau03z = 3600
alphaR = 0.4

betaR = 0.0023105


GR = 1


dR = 1E-10


alphaS = 0.4


betaS = 0.00023


alphaS2 = 260000


betaS2 = 140


GH = 471.85

dH = 4.7E-8

LS = 2500000 (std:1.6879E6)

SS = 100

DS = 50

alphaT = 0.1

betaT = 1.1E-6

GT = 2.22E-12 (std:3.375-12)

dT = 2.75

alpha31 = 0.026

beta31 = 8E-6

GD1 = 3.188E-8 (std: 2.8E-8)

KM1 = 5E-7

alpha32 = 130000

beta32 = 0.00083

GD2 = 4.3E-15

KM2 = 1E-9

K30 = 2000000000

K31 = 2000000000

K41 = 20000000000

K42 = 200000000

Tau0R = 1800

Tau0S = 120

Tau0S2 = 3240

Tau0T = 300

Tau03z = 3600
HeaderPilo 1
xFT3_pmol.l
yTSHI
result_typepredictive power score
pps0.0399161481951055
metricMAE
baseline_score0.228599683756024
model_score0.219471509560077
cv_folds5
seed1
algorithmtree
model_typeregression
HeaderPilo 10
xFT3_pmol.l
yTSHI
result_typepredictive power score
pps0.074013572098316
metricMAE
baseline_score0.229021692772779
model_score0.212073708605622
cv_folds5
seed1
algorithmtree
model_typeregression
TRH_ng.lFT3_pmol.l
pps0.00999382
TRH_ng.lTSH_mU.l
pps0.241326
SPINA_GTTSH_mU.l
pps0.820709
SPINA_GTTT4_nmol.l
pps3.4861e-15
TT3_nmol.lTT4_nmol.l
pps0.734311
TT3_nmol.lFT4_pmol.l
pps0.7343158
SPINA_GDFT4_pmol.l
pps0.2388143
SPINA_GDFT3_pmol.l
pps0.1478555
TSHIFT3_pmol.l
pps0.03991615

More information on the Pilo 1 scenario

FT3_pmol.lTRH_ng.l
pps0.02436586
TRH_ng.lTSH_mU.l
pps0.2460819
SPINA_GTTSH_mU.l
pps0.8224402
SPINA_GTTT4_nmol.l
pps7.704948e-15
TT3_nmol.lTT4_nmol.l
pps0.7880723
TT3_nmol.lFT4_pmol.l
pps0.7880051
SPINA_GDFT4_pmol.l
pps0.3212973
SPINA_GDFT3_pmol.l
pps0.1749449
TSHIFT3_pmol.l
pps0.07401357

More information on the Pilo 10 scenario

  1. 1. Pilo A, Iervasi G, Vitek F, Ferdeghini M, Cazzuola F, Bianchi R. Thyroidal and peripheral production of 3,5,3′-triiodothyronine in humans by multicompartmental analysis. Am J Physiol. 1990 Apr;258(4 Pt 1):E715-26. PubMed PMID: 2333963.

Pilo 10 – DataExplorer

Data Profiling Report

Basic Statistics

Raw Counts

Name Value
Rows 47,520
Columns 12
Discrete columns 0
Continuous columns 12
All missing columns 0
Missing observations 0
Complete Rows 47,520
Total observations 570,240
Memory allocation 4.4 Mb

Percentages

Data Structure

Missing Data Profile

Univariate Distribution

Histogram

QQ Plot

Correlation Analysis

Principal Component Analysis

Pilo 1 – DataExplorer

Data Profiling Report

Basic Statistics

Raw Counts

Name Value
Rows 47,520
Columns 12
Discrete columns 1
Continuous columns 11
All missing columns 0
Missing observations 0
Complete Rows 47,520
Total observations 570,240
Memory allocation 4.4 Mb

Percentages

Data Structure

Missing Data Profile

Univariate Distribution

Histogram

Bar Chart (with frequency)

QQ Plot

Correlation Analysis

## Warning in dummify(data, maxcat = maxcat): Ignored all discrete features since `maxcat`
## set to 20 categories!

Principal Component Analysis

Pilo 2 and 6 further information

Observations from the Pilo scenarios
The figures are derived from Simthyr – based on the laboratory values for the persons in the Pilo study(1). The figures mimic what may be seen in humans with this condition.

Pilo 6 (with low secretion rate for T4)
Pilo 2 (showing slight hyperdeiodination)
These are the figures entered into SimThyr, as can be seen two values are changed:
GT – thyroid activity and GD – deiodinase activity
These are the figures entered into SimThyr, as can be seen two values are changed:
GT – thyroid activity and GD – deiodinase activity
alphaR
0.4
betaR
0.0023105
GR
1
dR
1E-10
alphaS
0.4
betaS
0.00023
alphaS2
260000
betaS2
140
GH
471.85
dH
4.7E-8
LS
3400000
SS
110
DS
50
alphaT
0.1
betaT
1.1E-6
GT
2.44E-12 (standard value 3.375E-12)

dT
2.75
alpha31
0.026
beta31
8E-6
GD1
4.263E-8 (standard value 2.8E-8)

KM1
5E-7
alpha32
130000
beta32
0.00083
GD2
4.3E-15
KM2
1E-9
K30
2000000000
K31
2000000000
K41
20000000000
K42
200000000
Tau0R
1800
Tau0S
120
Tau0S2
3240
Tau0T
300
Tau03z
3600
alphaR
0.4
betaR
0.0023105
GR
1
dR
1E-10
alphaS
0.4
betaS
0.00023
alphaS2
260000
betaS2
140
GH
471.85
dH
4.7E-8
LS
3400000
SS
100
DS
50
alphaT
0.1
betaT
1.1E-6
GT
3.04E-12
dT
2.75
alpha31
0.026
beta31
8E-6
GD1
5.99E-8

KM1
5E-7
alpha32
130000
beta32
0.00083
GD2
4.3E-15
KM2
1E-9
K30
2000000000
K31
2000000000
K41
20000000000
K42
200000000
Tau0R
1800
Tau0S
120
Tau0S2
3240
Tau0T
300
Tau03z
3600
HeaderPilo 6
xFT3_pmol.l
ycT3_pmol.l
result_typepredictive power score
pps0.70645161743448
metricMAE
baseline_score57.7740090792993
model_score16.9589086283796
cv_folds5
seed1
algorithmtree
model_typeregression
TRH_ng.lFT3_pmol.l
pps0.0201538424398612
TRH_ng.lTSH_mU.l
pps0.24198856824132
SPINA_GTTSH_mU.l
pps0.853016404129762
SPINA_GTTT4_nmol.l
pps0
TT3_nmol.lTT4_nmol.l
pps0.786492953457281
TT3_nmol.lFT4_pmol.l
pps0.7864154128002
SPINA_GDFT4_pmol.l
pps0.361281910084329
SPINA_GDFT3_pmol.l
pps0.150538809123081
TSHIFT3_pmol.l
pps0.0817507329667389

More information on the Pilo 6 scenario

HeaderPilo 2
xcT3_pmol.l
yFT3_pmol.l
result_typepredictive power score
pps0.721086815385527
metricMAE
baseline_score0.0649955790187846
model_score0.0181290998271268
cv_folds5
seed1
algorithmtree
model_typeregression
FT3_pmol.lTRH_ng.l
pps0.0158420628677205
TRH_ng.lTSH_mU.l
pps0.245993069890075
SPINA_GTTSH_mU.l
pps0.818806003676958
SPINA_GTTT4_nmol.l
pps9.1038e-16
TT3_nmol.lTT4_nmol.l
pps0.698920862701658
TT3_nmol.lFT4_pmol.l
pps0.698799304223429
SPINA_GDFT4_pmol.l
pps0.285240272027388
SPINA_GDFT3_pmol.l
pps0.124850236180727
TSHIFT3_pmol.l
pps0.0930791220487382

More information on the Pilo 2 scenario

  1. 1. Pilo A, Iervasi G, Vitek F, Ferdeghini M, Cazzuola F, Bianchi R. Thyroidal and peripheral production of 3,5,3′-triiodothyronine in humans by multicompartmental analysis. Am J Physiol. 1990 Apr;258(4 Pt 1):E715-26. PubMed PMID: 2333963.

Pilo 6 – DataExplorer

Data Profiling Report

Basic Statistics

Raw Counts

Name Value
Rows 47,520
Columns 11
Discrete columns 0
Continuous columns 11
All missing columns 0
Missing observations 0
Complete Rows 47,520
Total observations 522,720
Memory allocation 4 Mb

Percentages

Data Structure

Missing Data Profile

Univariate Distribution

Histogram

QQ Plot

Correlation Analysis

Principal Component Analysis

Q-Q plot – explanation: https://stats.stackexchange.com/questions/101274/how-to-interpret-a-qq-plot